Eight County Freight Plan
|
|
|
- Esther Harris
- 5 years ago
- Views:
Transcription

1 Eight County Freight Plan East Central Intergovernmental Association & Blackhawk Hills Regional Council CPCS Team November 29, 2017 Turner Hall Galena, IL

2 Project Sponsors 2
3 Work Plan Overview We are here Months Project Inception Task Kick-Off Meeting Task Literature Review and Initial Data Collection Task Project Management & revise Work Plan, as needed Task 1 - Data Collection and Inventory Task Physical Profile Task Operational Profile Task Stakeholder Consultations & 6 Council Meetings Task 2 - Needs Assessment and Analysis Task Freight System Performance Measures Task Existing and Future Commodity Flow Assessment Task Freight Modal Profiles and Needs Assessment Report Task 3 - Study Recommendations Task Freight System Infrastructure Projects Task Project Evaluation and Prioritization Task Supporting Freight System Strategies Task 4 - Reporting Task Draft Final Report Task Final Report Legend Major Task Duration Work Activity Meeting 3
4 Presentation Map Why Develop a Freight Plan? Additional Information for Projects Identification Process to Evaluate Projects Questions & Discussion 4
5 Project Understanding Project Motivations Inconsistent data across freight modes Understand link between freight transportation system and local economy Be aware freight system needs and opportunities Incorporate freight in local transportation planning decisions Project Objective To develop a better understanding of the multimodal freight system in the bi-state region and to use this information to better inform policy and programming decisions in the region. 5
6 Eight County Freight Plan Legacy Outcomes and tools to advance Regional freight planning Turnkey GIS mapping (ECIA platform) Freight modal profiles Freight commodity flow analysis tool Freight system performance measures Prioritized projects + Stakeholder Buy-In = Long-Term Success Plug-and-play information to support grant applications (INFRA, TIGER, etc.)


7 Example Modal Profile: Multimodal 7


8 Example Modal Profile: Road 8


9 Example Modal Profile: Rail 9


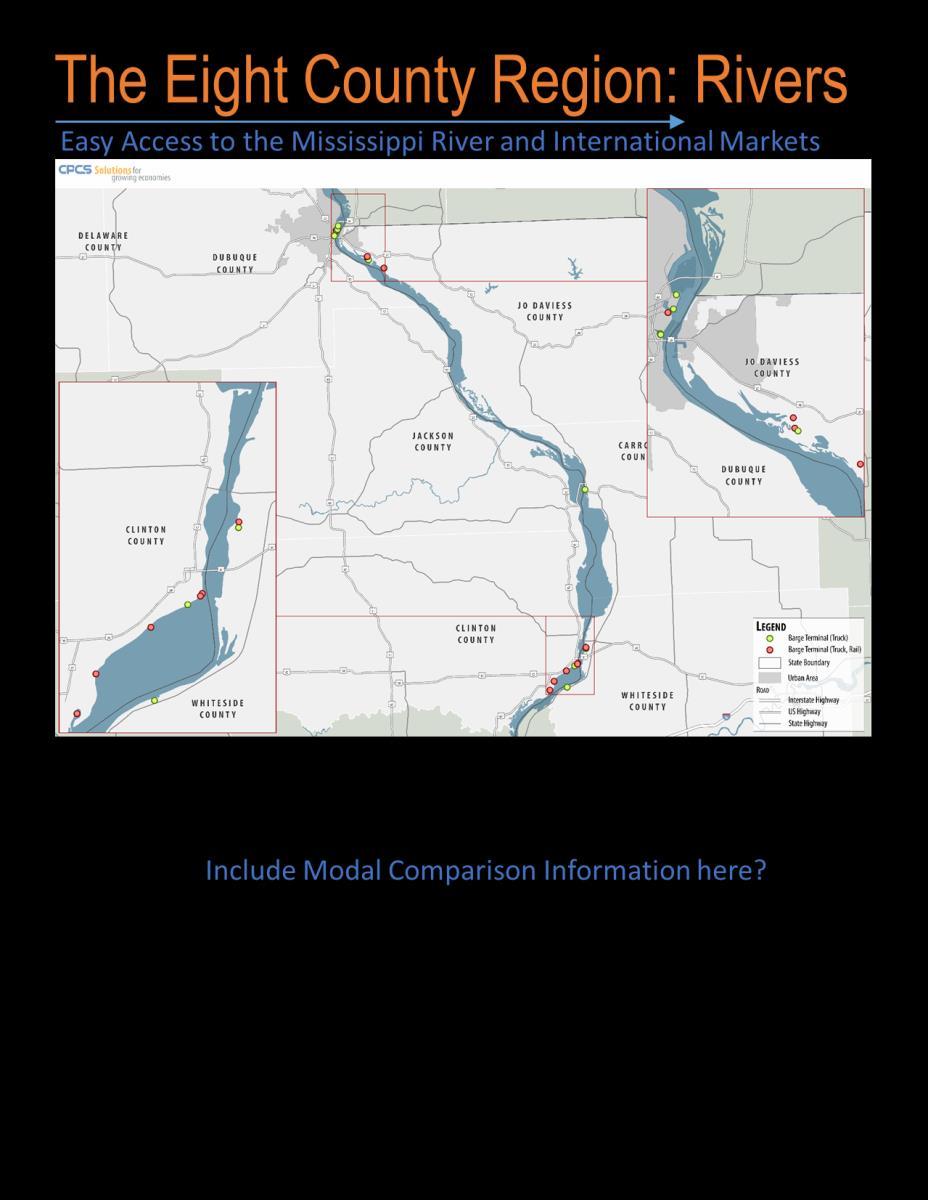
10 Example Modal Profile: Water 10
11 Data Products Goal: Equip regional stakeholders to understand current conditions, anticipate future conditions, and support continuing freight planning and investment Data analysis and tools Freight Analysis Framework (FAF), ATRI (truck), STB (rail), USACE (water) Tableau viewer package (no license needed) Tableau viewer Previously demonstrated FAF workbook New live demos of ATRI, STB, USACE workbooks Implementation support Market demand / Benefit-Cost Analysis
12 Discussion on tools you can use Open Discussion Are there tools that you are interested in/ expecting that we have not yet identified? 12
13 Presentation Map Why Develop a Freight Plan? Additional Information for Projects Identification Process to Evaluate Projects Questions & Discussion 13

14 Freight System Needs Assessment 14
15 Efficiency: Truck Travel Time Index Truck Travel Time Index (TTTI) is calculated to compare average truck travel times at peak hours (at 6:00-9:00 AM and 4:00-7:00 PM) against free-flow traffic times The Region s TTTI value = 1.11 A truck trip that takes 1 hour in free-flow conditions takes an additional 6.6 minutes at peak times. The US overall Travel Time Index = 1.22 (in 2014) 15

16 Average Annual Speed vs. Posted Speed Sources: ATRI FPM Program, American Transportation Research Institute, 2016; National Transportation Atlas Database, Bureau of Transportation Statistics,

17 Congestion: Problems Concentrated in Urban Areas Dubuque: US-20 US-61 US-52 Galena US-20 Freeport: US-20 IL-75 IL-26 Clinton: US-30 US-67 IA-136 Sterling: I-88 US-30 IL-2 IL-40 17

18 Overall Congestion Not a Major Problem 18
19 Congestion: Overlap with Previously ID d Projects 19
20 Congestion: Major Gaps in Projects Dubuque: US-20 US-151 Freeport: US-20 IL-75 Sterling: I-88 US-30 IL-2 IL-40 20
21 Gap Areas for Congestion / Potential Project Locations Highway Area from Maps Location Specifically Mentioned in Outreach? US-20 Dubuque to IL-84 No (US-20 mentioned as a need) US-20 Western Dubuque No (US-20 mentioned as a need) US-20 Freeport Yes (US-20 mentioned as a need) US-30 Clinton Yes (US-30 mentioned as a need) US-20 Sterling Yes (US-30mentioned as a need) US-151/61 US-52 Junction, south of Dubuque No IA-136 Between Charlotte and Delmar No IL-78 North and South of Mount Carroll No I-88 Between Lincoln Road and Whiteside County Line IL-40 Sterling No IL-2 Sterling No No 21

22 Safety: Truck Crashes per Mile 22
23 Safety: The Cost of Crashes in the Region KABCO codes are assigned to crashes based on maximum level of injury. Code Definition Associated Cost K Fatality $4,008,900 A Disabling Injury Hospitalization required $216,000 B Evident Injury Scrapes and bruises, no hospitalization required. Can walk away. $79,000 C Possible Injury No visible injury, but complaints of pain $44,900 O Property Damage Only $7,400 Source: Highway Safety Manual, First Edition, Draft 3.1. April

24 Safety: Areas of Greatest Truck Crash Cost/Severity Note: Map shows crashes per segment, not per mile 24
25 Safety: Overlap with Previously ID d Projects Note: Segments with $500,000, or more, in costs are highlighted. 25
26 Safety: Gaps in Projects Note: Segments with $500,000, or more, in costs are highlighted. 26
27 Gap Areas for Safety / Potential Project Locations Highway Area from Maps Location Specifically Mentioned in Outreach? US-20 Farley to Dyersville No (US-20 mentioned as a need) US-20 Mississippi River to N Cascade Road No (US-20 mentioned as a need) US-20 Menominee Road to E. Galena No (US-20 mentioned as a need) US-20 Tapley Woods east to IL-84 Junction No (US-20 mentioned as a need) US-20 Woodbine to Canyon Park Road No (US-20 mentioned as a need) US-20 County Hwy 6 to Business 20 Junction No (US-20 mentioned as a need) US-20 West of Freeport No (US-20 mentioned as a need) US-30 Grand Mound to US-61 No (US-30 mentioned as a need) US-30 IL-136 to IL-78 No (US-30mentioned as a need) US-30/US-67 Clinton Yes (US-30mentioned as a need) IL-84 Rush Road to Savanna No US-52 Mount Carroll to Lanark No I-88 IL-78 to Lincoln Road No IL-75 Dakota to Rock City No 27
28 Total Crashes per Year Truck-Involved Crashes Per Year Count of US-20 Crashes Illinois Iowa Illinois Iowa Between 2010 and 2015: US-20 had 2,534 crashes in total. 44% in Illinois, 56% in Iowa. 324 (13%) of these crashes were truck-involved. 160 (49%) of truck-involved crashes occurred in Illinois. 164 in Iowa. 28
29 Annual Total Crash Cost Annual Truck-Involved Crash Cost Cost of US-20 Crashes $20,000,000 $10,000,000 $18,000,000 $9,000,000 $16,000,000 $8,000,000 $14,000,000 $7,000,000 $12,000,000 $6,000,000 $10,000,000 $5,000,000 $8,000,000 $4,000,000 $6,000,000 $3,000,000 $4,000,000 $2,000,000 $2,000,000 $ $1,000,000 $ Illinois Iowa Illinois Iowa Between 2010 and 2015: US-20 total crash cost exceeded $148.5 million. 75% in IL, 25% in IA. Truck involved crashes cost $31.8 million (21%). Illinois had 73% of truck crash costs ($23m). 29


30 US-20: Comparing Congestion and Safety 30
31 Previously Identified Project Overlaps Shown with Safety and Congestion Data / Needs Note: Yellow areas indicate overlap of both safety and congestion-relevant projects. 31
32 Project Gaps Shown with Safety and Congestion Data Dubuque: US-20 US-151 Freeport: US-20 IL-75 Sterling: I-88 US-30 IL-2 IL-40 Note: Black circles show overlap between safety and congestion project gaps. 32
33 Discussion on System Evaluation Open Discussion Does this enhanced data evaluation better highlight the regions roadway needs? 33
34 Presentation Map Why Develop a Freight Plan? Additional Information for Projects Identification Process to Evaluate Projects Questions & Discussion 34
35 About Benefit-Cost Analysis What do we learn? Benefits of freight improvements Improvements in supply chain performance -- cost, speed, reliability, etc. compared to without-project conditions Performance and cost data to help define/fine-tune projects Support discretionary grant applications Benefit-cost analysis typically does not include economic impact evaluation (jobs, wages, taxes, etc.) or neutral transfers of benefits across regions or facilities 35
36 Benefit Cost Analysis Guidance Recent USDOT guidance for INFRA and TIGER Costs and monetized benefits calculated annually over longterm (20-30 years) and discounted to present value at 7% and 3%; BCR is the ratio of discounted benefits to discounted costs Primary benefit categories 1. State of good repair (pavement damage, etc.) 2. Economic competitiveness (transportation cost, land value) 3. Livability (congestion reduction, etc.) 4. Sustainability (emissions reduction, etc.) 5. Safety (crash reduction, etc.) New provisions Reduced value for modal diversion projects No recommended federal value for marginal social cost of carbon Increased rigor in modeling congestion and safety improvements 36
37 Implementation Support Primary option (from scope of work) Develop Benefit-Cost Analyses for three projects, using WSP BCA model from latest round of TIGER/INFRA grants, and representative project data as available Suggest mix of: truck, rail, water; large, medium, small; conventional and innovative; regional, bi-state, national; nearterm and long-range Input to state plans and state/federal grant programs Spreadsheet model for future use (example from NM rail project)
38 Implementation Support (cont d) Alternative option Develop BCA for one project (container on barge) with supporting operational feasibility analysis Would quantify the O-D volumes/commodities that could be served, test different capture rates, determine capture rate(s) necessary for service development and sustained operation Would not determine physical feasibility (requires site analysis) or whether the necessary capture rate can be achieved (requires full market study)
39 Discussion and Next Steps What approach should we use? What types of projects should we address? Rail Intermodal terminal, transload terminal Existing line improvement / new line construction Highway Grade crossing or other bottleneck elimination Bypass or performance/capacity enhancement Water Transfer terminal Others? 39
40 Presentation Map Why Develop a Freight Plan? Additional Information for Projects Identification Process to Evaluate Projects Questions & Discussion 40
41 Our Next Steps Continue stakeholder outreach Refine list of freight plan recommendations Conduct freight project evaluation Months Project Inception Task Kick-Off Meeting Task Literature Review and Initial Data Collection Task Project Management & revise Work Plan, as needed Task 1 - Data Collection and Inventory Task Physical Profile Task Operational Profile Task Stakeholder Consultations & 6 Council Meetings Task 2 - Needs Assessment and Analysis Task Freight System Performance Measures Task Existing and Future Commodity Flow Assessment Task Freight Modal Profiles and Needs Assessment Report Task 3 - Study Recommendations Task Freight System Infrastructure Projects Task Project Evaluation and Prioritization Task Supporting Freight System Strategies Task 4 - Reporting Task Draft Final Report Task Final Report Legend Major Task Duration Work Activity Meeting 41


42 Thank You Erika Witzke, PE Project Manager Alan Meyers Supply Chain and Industry Expert 42