Cool Chain Management in the international supply chain
|
|
|
- Anthony Phillips
- 5 years ago
- Views:
Transcription


1 Aalsmeer, 25 May 2011 Cool Chain Management in the international supply chain Peter Bouma, Area Manager Africa
2 2 Presentation line FloraHolland, its scope & contribution Flower Quality Cold Chain: monitoring, system and achievement


3 3 Milestone at FloraHolland 2011 FloraHolland: 100 years


4 We love flowers! 4
5 5 Quality is not a coincidence it s always the result of intelligent effort John Ruskin
6 6 Greenport Holland General Largest center of trade and knowledge in the world for horticulture. Innovative and trendsetting industry Almost 70% of the production in the west of the Netherlands Importance for the Dutch economy: Export value horticulture 14 billion Floricultural industry 6,5 billion Fruits and vegetables industry 7,5 billion Contribution of 24% of the Dutch trade surplus Direct and indirect employment: FTE
 The world market place Centre of knowledge and")

7 7 Introduction FloraHolland Flower auction and mediation Grower owned Merger FloraHolland and Flower Auction Aalsmeer Largest and best stocked sales and distribution centers (one-stop-shopping) The world market place Centre of knowledge and meeting place Trendsetter in logistics innovation and ICT FloraHolland s aim To achieve maximum sales proceeds at the lowest possible total costs of ownership both in the short and long term, in order to maximize business profitability for all the members.
 Scope : Import from 60 countries : Export to 140 countries Surface : 2,700,000 m 2 ( 500 soccer playing fields) Coldstores : 240.000 m 2 Turnover : 4.")
8 8 FloraHolland in figures Growers : 8,000 nationally and internationally (4,900 members) Customers : Employees : Locations : 3,000 exporters and wholesalers 4,400 (from 40+ countries) 5 (+ 1 Intermediate and 1 Import department) Scope : Import from 60 countries : Export to 140 countries Surface : 2,700,000 m 2 ( 500 soccer playing fields) Coldstores : m 2 Turnover : 4.1 billion (2010) Products : 11 billion cut flowers 1,3 billion plants different products Daily : 126,000 clock transactions


9 9 Global Trade Production, consumption and import Country TO 2010 % of imports Kenya % Ethiopia % Israel 82 12,2 % Belgium % Germany %
 Germany 1.")

10 10 Exports from the Netherlands (flowers & plants) Sales in million euro s (2010) Germany ,1 % United Kingdom % France ,0 % Italy 331 6,4 % Belgium 238 4,6 % To 140 countries in total


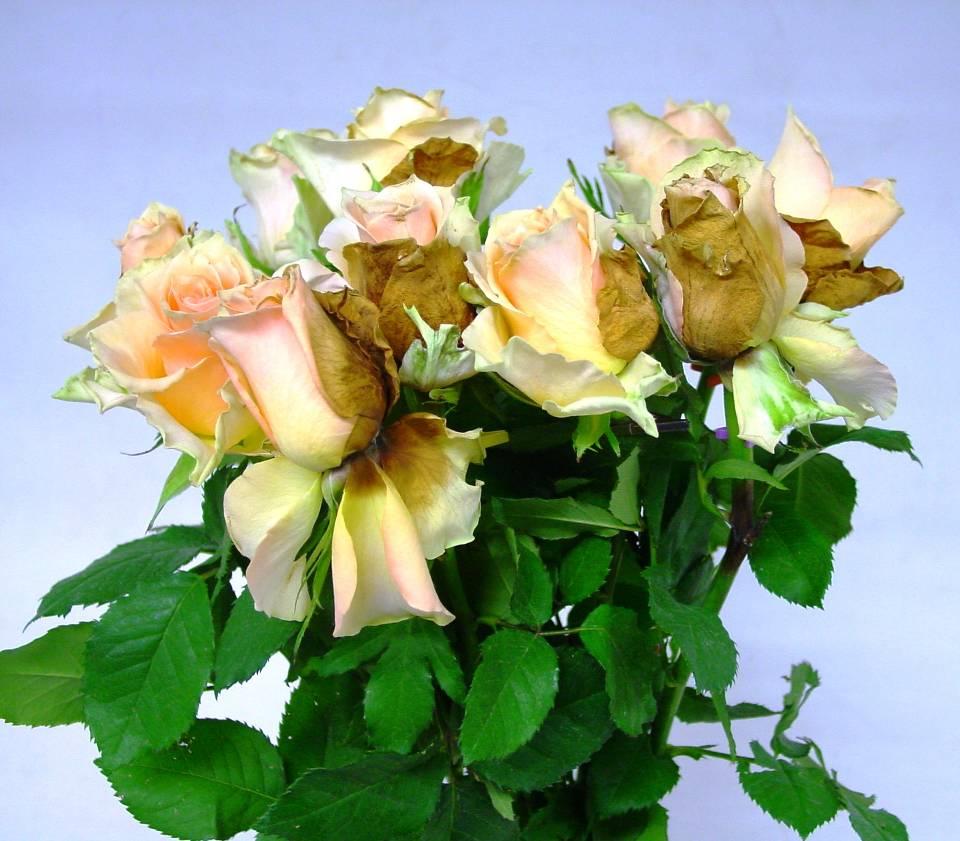
11 Flower Quality (??) 11
 Pre-Harvest Post-Harvest Transport")

12 12 Flower quality (?!) Pre-Harvest Post-Harvest Transport Handling Prepare for sales Transport Handling Shop-phase Consumer phase Knowledge Capabilities Interest Control

13 Quality demand rises 13
14 14 Length of the Supply Chain 1. Production moves towards the Equator 2. Growing markets develop further away from natural hubs Harvest + Grading + Local Transport + International Transport + Local Transport + Auction + International Transport + Shelf Life + Guarantee = X = 17 DAYS


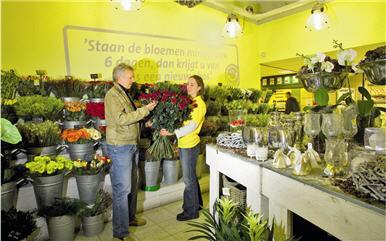
15 15 Demand for flexibility Smaller Quantities Frequent deliveries Just-in-time With overview in the supply chain To the doorstep
16 16 Living flower Transpiration Relative Humidity Temperature Air Speed Respiration Temperature Nutrition Time Ethylene Temperature
17 17 Respiration at different temperatures (Rose) Source: M.S Reid & F.G. Celikel; Acta Hort. 682 ISHS 2005


18 Upper Gold, transport dry, 10 days, at different temperatures Pictures taken after 7 days vase life 0,5 C 5 C 18 8 C 15 C


19 Valentino, transport dry, 10 days, at different temperatures Pictures taken after 7 days vase life ,5 C 5 C 8 C 15 C
20 20 Knowledge of the chain - Cooling Types of Cooling Conventional Forced Air Vacuum cooling When do you cool? What is the effect of cooling?


21 21 Knowledge of the Chain - packaging Influences the amount of damages (ethylene!!) Influences your half time cooling Influences the amount of botrytis


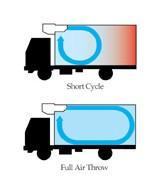
22 Knowledge of the Chain - Airflow 22

23 Knowledge in the Chain?? 23

24 Ishikawa - example 24


25 Cool Chain Management: Verdict Chain View Cool Chain Management 25
26 26 Process & Procedure Option for supply chain partners to see only their own performance (internet based and secured) Introduced in Kenya as a pilot project year 2006 and rolled out in System contributed to aim and objectives of the FloraHolland Freight Group. Categories of users (Growers, Freight forwarders, imports/unpacking agents). Airlines and clearing agents can also use the system. System installed at grower s farm and 1 logger sent in every shipment with a sample rate of 10 minutes Immediately loggers are analyzed in Holland, users can be able to see the results online.
27 Changing flower market 27 Objective is to improve quality of cool chain 1. Measure (with Verdict and Quality department): loggers are set by the grower and packed into the box. 2. Analyze (with specialists)- Users of the system can then analyze the missions or finding of the temperaturesand point out the weakest link on the chain. The Verdict system also automatically generates a summary of the temperatures of a particular shipment/s. 3. Advise (to chain partners- through consultants and experts): The experts will use the generated information to make mitigation action plans towards improving the cool chain and helping growers to achieve set benchmarks.

28 28 Overview of the missions You can filter data based on a number of criteria Active missions = all missions that have been started and not yet uploaded Completed missions = all uploaded missions Failed missions = not yet working Archived missions = old missions All missions

29 29 Tabs to see relevant data Summary of mission settings Summary of shipment

30 30 Adding events screen Events are optional, packing and unpacking are most important! Fill in date and times to keep track of events during shipments.

31 31 View mission graph Go to mission Double click on line Select line chart You can also select several missions

32 32 Line graphs See performance of shipments
33 Servicing chain partners Grower Manage incidents and structural performance Evaluate partners Improve (logistical) process and product (vase life) Freight Forwarder/Carrier/Clearing Agent/Unpacker Analyse own process and chain Manage incidents and structural performance Evaluate partners Buyer Review grower performance Analyse supply chain Reduce risks and create awareness FloraHolland Manage and develop system Chain objectives and developing performance indicators Advice, consult and guide Test and research
34 Achievements so far: Awareness of cool chain management in general (growers, service providers) Further understanding of relationship between so-called temperature hours and vase life performance.- doing vase life testing monthly to support this. Results/ data from Kenya, Ethiopia, Israel, South America give an insight in supply chain to help the buyers Payments of claims via Verdict system certified system Reduction of claim rate partners- improved cool chain thus no damages of flowers by temperature related issues. (one freight forwarder said since the introduction of this system his claims have reduced by 20% 34
35 35 Growers improvements Great improvement since the start of the system. See statistics below; Year Performance <5 C arrival NBO Performance <14 C arrival NL % 63% % 71% % 79% What has lead to this achievement: Continual weekly analysis evaluation reports to growers; (See extract next slide) Quarterly individual farm visits evaluation and training Cool chain expert consultant workshops as well as farm visit training. Constant Airport shipment arrival temperature monitoring and reporting. Growers participation level Investing in reefer trucks and improvements in their cold storage (expansion and servicing) Freight forwarder participation level Vacuum cooling Forced air cooling
36 36 Extract of weekly report WK 19/ Growers Loggers shipped Arrival NBO> 5 C issues in % performance in % arrival NL (>14 C) issues in % performance in % Average. Temp C Maridadi 5 0 0% 100% 0 0% 100% 6.69 Xflora % 0% 1 14% 86% 8.45 Kreative 3 0 0% 100% 1 33% 67% 9.65 Panocal % 0% 1 20% 80% S/Mazuri % 17% 0 0% 100% 8.08 S/Agriflora % 50% 1 50% 50% 7.83 S/Winchester % 50% 1 25% 75% 8.83 S/Equator % 50% 4 100% 0% S/Maasai % 86% 1 14% 86% 8.63 Beautyline % 0% 0 0% 100% 6.64 Equinox % 0% 1 17% 83% 8.06 Total % 43% 10 23% 78%
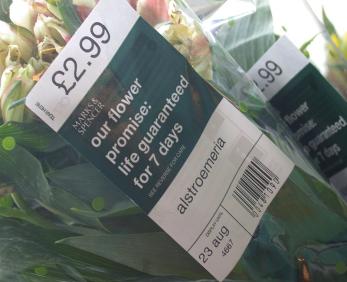
37 Supply Chain Developments: Conclusions Competitive value chains become more important Transparency, flexibility, flow of information will be key words Developing techniques and systems bring new opportunities. A performance driven chain is achievable. Chain partners can have one (coldchain) objective Incorporation of temperature performance of growers on the Auction clock & other sales process. FloraHolland supports growers and buyers in research and development, consultancy and advise.

38 38 To Conclude: Chain analysis Where in your Chain is the breach?? Can you determine the cause of that breach?? Can you determine the associated loss in $?? Or profits when the breach is fixed?? Can this breach be influenced by your company?? What is your next step?? Are you financially committed to accept a bonus or a penalty?