Capacity drop in Belgium: empirical observations and implications
|
|
|
- Sharon Robinson
- 5 years ago
- Views:
Transcription


1 Capacity drop in Belgium: empirical observations and implications L-MOB KU Leuven Mobility Research Center Prof. dr. ir. Chris Tampère Dr. ir. Willem Himpe TRAIL masterclass Mysteries on motorway traffic operations 14 december 2016
2 Overview Part 1: capacity drop on Belgian motorways o o o R0 ring of Brussels empirical observations implications for potential impact control applications Part 2: capacity drop on Belgian intersections o o o concept and definition empirical set-up empirical observations 2

3 Capacity drop on Belgian motorways master thesis Thijs Van Tieghem KU Leuven master Traffic & Logistics 3
4 Motivation and objective potential for traffic control claimed o literature capdrop = one of two main degradation mechanisms e.g. work Papageorgiou predicts ~50% TTS reduction by eliminating capacity drop and spillback if even 20% of that were true o field deployment coordinated metering in Melbourne confirmed spectacular gains e.g. John Gaffney (VicRoads) this finally convinced Flemish road authority to support study into potential for ramp metering in Belgium


5 2. Why Ramp Metering? 1st Answer qcap qcon Ts nc Ts rm Ts nc Ts qin d qcon e.g. qcon 0.95qcap ; qin d 1.2qcap Ts A 20% prof. Markos Papageorgiou (TU Crete) is kindly acknowledged for sharing these slides! 5


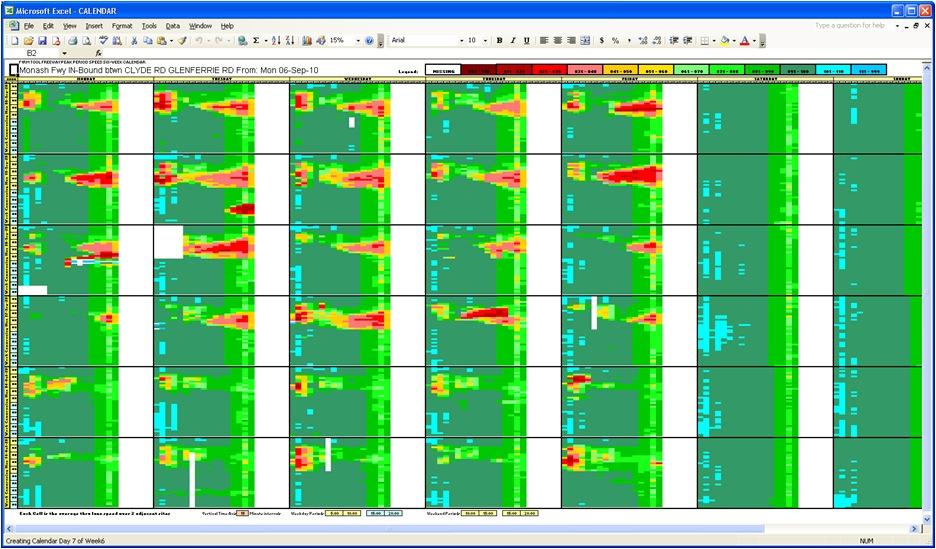
6 2nd Answer Ts nc Ts rm Ts nc Ts Note: On-ramp queue should not interfere with surface street traffic. Coordinated Ramp Metering Strategy HERO: Field 6 Implementation at the Monash Freeway in Melbourne,
7 6. Simulation Results Amsterdam ring-road A10: 32 km (counterclockwise) 21 on-ramps 20 off-ramps Coordinated Ramp Metering Strategy HERO: Field 7 Implementation at the Monash Freeway in Melbourne,
8 No-Control Case TTS = veh h Density profile Ramp queue profile density (veh/km/lane) queue (#veh) A8 A A2 30 segment A time (sec x 10) 0 1 A8 A on-ramp 1200 A2 800 A1 16 Coordinated Ramp Metering Strategy HERO: Field 8 Implementation at the Monash Freeway in Melbourne, time (sec x 10)
9 ALINEA without Queue Control TTS = 7563 veh h -47% Density profile Ramp queue profile density (veh/km/lane) queue (#veh) A8 A A2 30 segment A time (sec x 10) 0 1 A8 A on-ramp 1200 A2 800 A1 16 Coordinated Ramp Metering Strategy HERO: Field 9 Implementation at the Monash Freeway in Melbourne, time (sec x 10)
10 Motivation and objective potential for traffic control claimed o literature capdrop = one of two main degradation mechanisms e.g. work Papageorgiou predicts ~50% TTS reduction by eliminating capacity drop and spillback if even 20% of that were true o field deployment coordinated metering in Melbourne confirmed spectacular gains e.g. John Gaffney (VicRoads) this finally convinced Flemish road authority to support study into potential for ramp metering in Belgium
 is kindly acknowledged for")
11 M1 Corridor what are the traffic patterns? City Werribee John Gaffney (VicRoads) is kindly acknowledged for sharing these slides! Narre Warren


12 Getting Control of the Freeway System wide control is effective After Before 2rd Bottleneck 1st Bottleneck 2rd Bottleneck Reduced 1st Bottleneck Removed


13 Before After
14 Empirical set-up R0 ring of Brussels o o massive daily queuing on ring and connecting radial motorways, AM and PM succession of on-off ramps with much exchange of traffic many bottlenecks capacity drop? many blocked outflows o little support for capacity extension Research question: can we quantify the drop in capacity during bottleneck activation, as an indicator for potential of managed motorway?
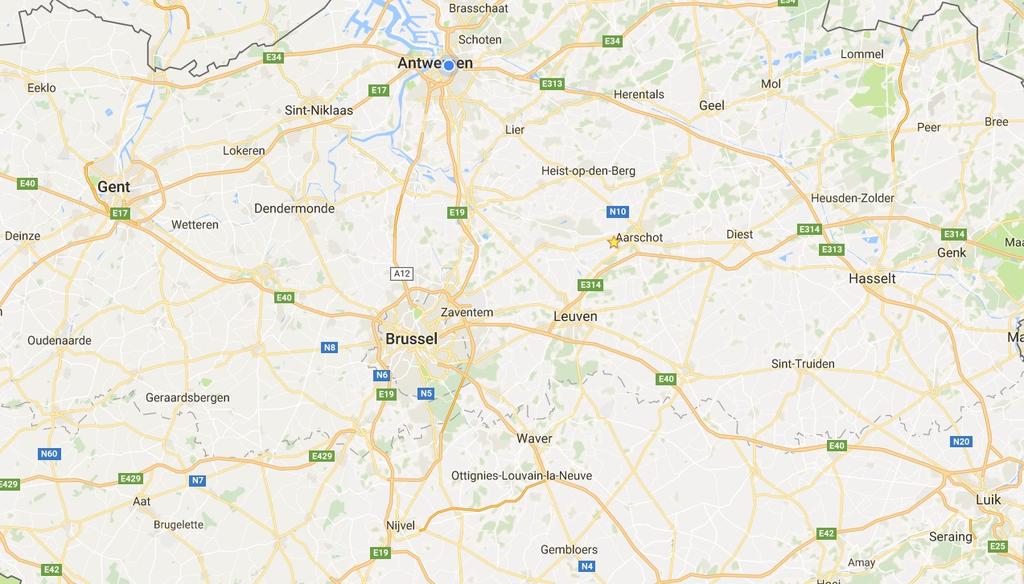
15 40 km 15

16 Queues AM 1. E40 Buitenring, SintStevens-Woluwe 2. E19 Binnenring, Machelen 3. Binnenring, Vilvoorde 4. Binnenring, Zellik 5. Binnenring, Huizingen/Halle 6. E411 Buitenring, Leonardkruispunt 16

17 Queues PM 7. Buitenring, Wemmel 8. Buitrenring, Zaventem 9. Binnenring, WezembeekOppem 17
18 Data availability and methodology double loop detector data 44 working days March & October 2015 o speed, occupancy + flow per lane o 5-min aggregate methodology o aggregation over lanes o cumulative flow analysis o discharge just downstream, if needed aggregated main+off-ramp bottleneck activation / de-activation by occupancy just upstream 18

19 Capacity drop occupancy 1st upstream detector o threshold site specific o determines discharge period average flow during discharge period = discharge rate longest constant flow period prior pre-queue capacity 19

20 Result example: E40 (East) R0 (outer - North) Sint-Stevens-Woluwe AM peak weaving zone bottleneck o 3+2 lanes o activated 38 times pre-queue cap o 7970 veh/h discharge rate o 7528 veh/h drop o 5.52% 20
 used E19 (North) R0 (inner South) Machelen AM peak o pre-queue:")
 R0 (outer N) Leonard interchange AM o pre-queue: 2604 veh/h o discharge 1995 veh/h o drop:")
21 Examples special cases bottleneck in on-ramp before the merge (only on merge) o no downstream observation o detector on merge (i.e. just in queue) used E19 (North) R0 (inner South) Machelen AM peak o pre-queue: 3585 veh/h o discharge: 3303 veh/h o drop: 7.8% E411 (SE) R0 (outer N) Leonard interchange AM o pre-queue: 2604 veh/h o discharge 1995 veh/h o drop: 23.3% to be distrusted, instable discharge (no cause found) 21
22 Overview results 22
23 Conclusion and implication Some bottlenecks allow for CD estimation, which reproduces reliably o % (range over sites) o 0 16% (range over days and sites) Others give unreliable estimates Others exhibit no noticeable drop Implication: Does not seem like a sound basis to recommend CDavoiding traffic control operations like ramp metering or MTFC? Would you agree or am I missing something? 23
24 Capacity drop on Belgian intersections Master thesis Martin Camerman KU Leuven master Traffic & Logistics 24
25 Capdrop of intersections - definition Capacity drop is the reduction in throughput for a movement over the intersection, caused by conflicts that were underestimated during design of the traffic control, or that were supposed to be excluded by traffic control but still activate due to problems in evacuating the intersection. 25
26 Let s go back 10 years my presentation at masterclass November 2006 PhD Francesco Viti 26
27 Application 13 November 2006 Monte-Carlo simulation of capacity drop at intersections 27

28 Modelling the network 13 November 2006 Monte-Carlo simulation of capacity drop at intersections 28
29 Simulation results: reference without hindrance averaged over runs for each gridpoint other demands 500 veh/h 13 November 2006 Monte-Carlo simulation of capacity drop at intersections 29
30 95% confidence interval and composition fow [veh/h] +/- 20 veh/h demand queue 2 [veh/h] 13 November 2006 Monte-Carlo simulation of capacity drop at intersections 30

31 Simulation results: capacity drop! averaged over runs for each gridpoint other demands 500 veh/h November 2006 Monte-Carlo simulation of capacity drop at intersections 31
32 total fow surface 2 x 3 [veh/h] Sensitivity analysis: Infuence service time increase when obstructed demand queue 2 [veh/h] 13 November 2006 Monte-Carlo simulation of capacity drop at intersections 32
33 Boomsesteenweg L1 33
34 Boomsesteenweg L2 34

35 Boomsesteenweg L3 35

36 Boomsesteenweg R1 36

37 Mortsel R2 37

38 Dynamische effecten - block 38


39 Dynamische effecten - push 39


40 Dynamische effecten - squeeze 40

41 Conflict linksaf - referentiecapaciteit ~ CAPCAL methode 41
42 Conflict linksaf gemeten vs. referentie 42
43 Conflict linksaf regressie totaal T_block Dynamic effects (Squeeze, push) influence significantly but not predicted themselves 43
44 Conclusions of this first exploration Literature: unrealistic performance of saturated intersections need for theory and observations of capacity drop of intersections Proposed definition of capacity drop intersections Exploration of role of 3 dynamic effects o Block o Push o Squeeze Some empirical results prove their influence on intersection discharge, along with o (time blocked) o volumes of conflicting flows 44
45 Can I consult you? Do you think my conclusion about capacity drop on R0 Brussels is justified? Empirical results do not appear to be a sound basis to recommend CD-avoiding traffic control operations like ramp metering or MTFC? Do you think capacity drop at intersections is a topic worth further consideration? o if so, which aspects? how? 45
46 Questions?