Global Supply Chain Management: Seattle-Tacoma
|
|
|
- George Howard Briggs
- 5 years ago
- Views:
Transcription
 (781) 250 8150 Page 1 This report has been prepared by Boston Strategies International at the request of CLIENT for the purpose of establishing its operating strategies.")
1 Boston Strategies International, Inc. February 2008 Global Infrastructure Series Global Supply Chain Management: Seattle-Tacoma b t t t i (1) (781) Page 1 This report has been prepared by Boston Strategies International at the request of CLIENT for the purpose of establishing its operating strategies. It may not be appropriate for other purposes or audiences. This report contains forward-looking statements and projections with respect to anticipated future performance of CLIENT, suppliers, customers, and/or general or specific economic conditions and factors that are based on Boston Strategies International s analysis of market trends and external data. Forward-looking statements and projections are not guarantees of future performance and involve significant business, economic and competitive risks, contingencies and uncertainties, which are difficult to predict. Accordingly, these projections and forward-looking statements may not be realized and actual results may vary up or down. This report may not be reproduced or distributed without express written approval from Boston Strategies International.
2 Agenda Seattle in Perspective Terminals, Services, and Connections Congestion and Capacity Issues Development and Expansion Plans Seattle in Your Global Supply Chain Page 2
3 Seattle-Tacoma in Perspective Page 3
4 Rail Transit Source: Port of Tacoma Page 4
5 Truck Transit Source: Port of Tacoma Page 5
6 Port of Tacoma Ocean Transit Source: Port of Tacoma Page 6
 1 Los Angeles - Long Beach, CA $305,126.39 2 Newark, NJ $145,620.")


7 One of the Largest US Port Complexes 2006 US Port Rankings Value of Foreign Trade Rank Port Complex (Billion USD) 1 Los Angeles - Long Beach, CA $305, Newark, NJ $145, Houston, TX $102, Seattle-Tacoma, WA $68, Charleston, SC $55, Source: Boston Strategies International, U.S. Dept. of Commerce, Bureau of Census Source: Port of Seattle Rank Port Complex Million TEUs 1 Los Angeles-Long Beach $15,759, New York/New Jersey $5,092, Seattle-Tacoma $4,054, Oakland $2,390, Savannah $2,160, Source: Boston Strategies International, AAPA Page 7


8 The Distribution Hub for the Pacific Northwest Source: Page 8
9 Strong West Coast Container Growth US Maritime Containerized Export and Imports by Coast Seattle-Tacoma Container Throughput 20 4 TEUS (millions) 15 TEUs (millions) West Coast East Coast Gulf Coast Sources: Boston Strategies analysis of BTS Page 9
10 TEU Throughput Surge % Growth in five years 5 4 TEUs (millions) Sources: Boston Strategies analysis of BTS Page 10
11 Tacoma Will Dominate Future Growth Planned Expansions Recent Planned Port Expansion Expansion Total Port of Seattle Port of Tacoma Port of Tacoma , ,757 Total 827 1,455 2,282 Container Capacity (1000 TEUs) Port Share of Growth Port of Seattle % Port of Tacoma ,806 76% Source: Kemer Nelson, US Customhouse Guide Ttl Total , % Sources: Port of Tacoma Page 11
12 Port of Seattle Terminals, Services, and Connections Page 12


13 Overview of Port of Seattle Facilities Image: Courtesy of Port of Seattle. Page 13


14 View of key cargo terminals Central Harbor North Harbor South Harbor Images: Courtesy of Port of Seattle. Page 14
 Ten container handling cranes 97,000 SF covered transit shed Efficient road access via truck into terminal Sources: www.")
15 Terminal 5 Six container-handling cranes On dock intermodal rail facilities 80,000 SF covered transit shed with truck access 48,000 SF maintenance and repair center 182 acres (74 hectares) Terminal 18 One of the largest in North America Terminal Size 196 acres (79 hectares) Ten container handling cranes 97,000 SF covered transit shed Efficient road access via truck into terminal Sources: Pacific Shipper Key Cargo Terminals Terminal 25 Terminal Size : 32 acres (12.9 hectares) Within 2 miles of UPRR & BNSF yards Terminal 46 Leased by Total Terminals Int l. and Hanjin until Includes 16 lane truck gate Terminal 30 Provides shore power to two vessels at the same time Page 15


16 Seattle Break Bulk Terminals Terminal 91 Terminal Size : 212 acres Frozen food use Terminal 115 Terminal 91 Receipt and shipment of import/export Terminal 115 cargo (domestic and international) 70 acres of yard space Photos: Courtesy of Port of Seattle. Page 16


17 Seattle Grain Facility Fully automated 3.99-million-bushel capacity 68 silos each holding a total of 54,000 bushels Grain Facility Photo : Courtesy of Port of Seattle. Page 17
18 Seattle Real Estate Division Formed in 2008 to manage commercial real estate and allow Seaport and Aviation divisions to focus on core businesses Expected to run at a $5m loss in 2008 Five business groups Real Estate Development & Planning Harbor Services Maintenance Property Management & Leasing Pier 69 Facilities Management Page 18
19 Seattle Intermodal Facilities at South Harbor Photo: Courtesy of Port of Seattle. Page 19
20 Sea-Tac Airport Source: Washington State Department of Transportation Page 20


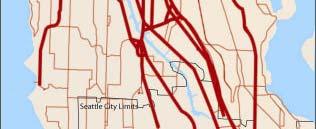
21 Rail access in Seattle Source: Seattle Dept. of Transportation Page 21


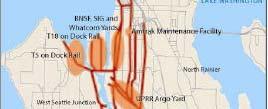
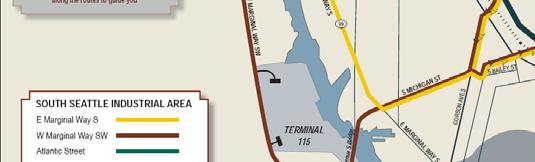
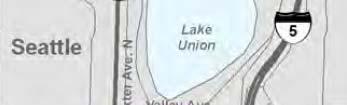
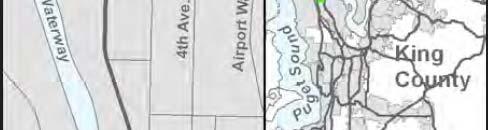
22 Major Truck Routes in Seattle Source: Seattle Dept. of Transportation Page 22


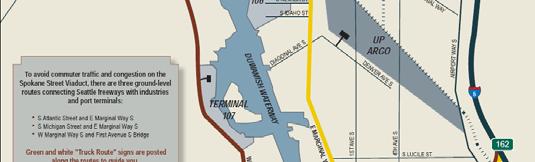
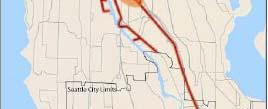
23 Spokane Corridor Truck Route Source: Seattle Dept. of Transportation Page 23
24 Port of Tacoma Terminals, Services, and Connections Page 24
25 Overview of Port of Tacoma Fascilities Source: Port of Tacoma website Page 25
26 Tacoma Key Terminal Summary APM Terminals 135 acres Five cranes 875 reefer plugs Six outbound truck lanes Husky Terminals 93 acres Four Cranes 460 reefer plugs Four outbound truck lanes Olympic Container Terminal 54 acres Four cranes 300 reefer plugs Two outbound truck lanes Source: Port of Tacoma Page 26 Pierce County Terminal 171 acres (includes PCT intermodal yard) Seven cranes Six outbound truck lanes 764 reefer Plugs Opened in 2005 TOTE Terminal 47 acres One operating and one layup berth RORO operation 140 reefer plugs Two outbound truck lanes
27 Terminal Summary, Cont d Washington United Terminals 100 acres Four Cranes 352 reefer plugs Four out Terminal 7-A/B 25 acres 2,700 feet of berth space Four cranes at OCT 100,000 square foot CFS Two rail spurs along shed and two along berth Three miles from I-5, 30 miles from I-90 bound truck lanes Source: Port of Tacoma Page 27 Marshall Ave Auto Facility acres Auto Storage Capacity: 19,000 units, with overflow up to 24,000 units One mile from I-5 Cargill Grain Terminal 11 Acres (4.5 hectares) 3 million bushel elevator capacity Three shipping belts, two legs Dolphin pier 73 feet of depth


28 Tacoma Intermodal Facilities Four yards North South Hyundai Pierce County Combined space of 83 acres Approximately 72,000 feet of track 72 carriers Four lift trucks 5 top-pick pick machines Source: Port of Tacoma Page 28
29 Congestion and Capacity Issues Page 29


30 Volumes Threatened by Canal Expansions Expansion will double the TEU capacity of Panamax vessels A deeper channel will eventually allow even large tankers through Source: Panama Canal Authority Source: Suez Canal Authority Page 30


31 Seattle s Green Initiatives Currently optional to particulate and sulfur oxide emissions restrictions require carriers to use different auxiliary fuels while in port Implementing early before it becomes mandatory Cost of replacing or converting existing equipment may increase service costs and operating costs for shipping lines Page 31
32 Congestion is Beginning to Cause Problems One runway closed at Sea-Tac 44% of the time due to poor weather conditions I-5 to I-95 Interchange is the 18th worst bottleneck in the US Freight Mobility challenges include: Old street infrastructure Limited street space Growing traffic demand Increased truck and rail volumes and conflicts Larger trucks Construction detours Sources: Sea-Tac, NHTSA, PSRC Page 32


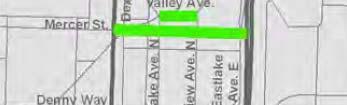
33 Seattle Mobility Projects Mercer Street Widening Lander Street improvements Spokane Street Viaduct $323m Page 33
34 Boston Strategies International David Jacoby: Erik Halbert: Tel: +1 (781) Boston Strategies International is a global management consulting firm that helps market leaders achieve competitive advantage through supply chain management through: Supply Market Analysis that helps identify emerging issues that affect their supply chains Supplier Enablement that facilitates global growth and local content requirements Supply S l Chain Ch i O Optimization ti i ti that th t reduces d project j t and d lif life cycle l costs t Al Khobar Boston Doha Dubai Manama Page 34