The Global Railway Industry: Development, Current Market and CAPEX Forecasts to 2020
|
|
|
- Leslie Thompson
- 5 years ago
- Views:
Transcription
1 StatPlan Energy Research The Global Railway Industry: Development, Current Market and CAPEX Forecasts to 2020 Sample Pages
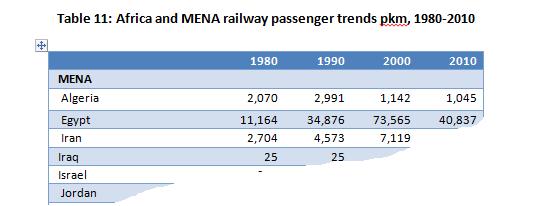
2 THE GLOBAL RAILWAY INDUSTRY: DEVELOPMENT, CURRENT MARKET AND CAPEX FORECASTS TO 2020 This report enters into detail on current infrastructures and their use, focussing on the period in particular. It provides essential numbers for track length, passenger kilometres and freight tonne kilometres for every country, with more detailed reviews for the major country markets. We review key trends, such as HSR and electrification of lines. Using this base, we reach the core of our report the future for capex investment to On compiling this analysis, we have reviewed and compared numerous industry sources and examined the reports of major supply companies to the sector to arrive at our market estimates by services and product. What has been noticeable in this process is a comparatively wide range of opinions, but these we have compared and tested to arrive at our measured conclusions. A key measure of the markets themselves is the extent to which they are open to international competition. As the reader will know, major companies are increasingly looking to joint ventures to gain access to markets, and in this respect accessibility is not entirely black and white. Nevertheless, when we remove the inaccessible from the accessible markets, we arrive at very different global market estimates. Part of the issue has to be the impact that China has had on the global industry. Investment in China has caused spikes in global figures, and when this element is removed we see much steadier growth to Line Length The world had x.x million route km of railway track in 2010, excluding a few local networks. To put this in perspective, there are xx million km of paved roads in the world and xx million km of electrical transmission and distribution lines in use. Five countries are overwhelmingly dominant in terms of route km, accounting for 49% of all the track in the world. The largest of all is the United States with xx route km of track in 2010, followed by China with xx km and Russia with xx km, India with xx km, Canada with xx km. Passenger Trends In the last thirty years the total number of passenger km has more than doubled globally, from 1.5 trillion pkm in 1980 to 3.1 trillion pkm in But the growth has been limited to the Asian region, and in turn this has primarily been due to India and China. While other major countries have stagnated, growth in these countries has been rapid, roughly six-fold over thirty years to Freight Trends Global rail freight transport grew slowly between 1980 and 1990, with a cagr of 1.3%, from 6,690 billion tkm in 1980 to 7,582 billion tkm in In the decade from 1990 to 2000 it declined at an annual rate of 1.1% to 6,768 billion tkm. In the last ten years it has risen at a fast annual rate of 4.0% to reach 10,013 billion tkm in 2010 despite recession in the later years. Three regions have contributed 90.6% of the global total of rail freight. These are Asia, North America and the CIS. Europe has only accounted for 4.0%. Rail in Russia has by far the highest intermodal share of freight transport in the world, with 85% of total tkm, with the United States in second place at 48%, although the volume is 25% higher, at 2,525 billion tkm in 2010 versus Russia s 2,011 billion tkm. China equalled the United Sates in volume but the share of 2
3 rail was only 21%. The EU was much lower in volume and at 390 billion tkm, amounting to 11% of all freight. Rail transport for freight has an insignificant share of only 4% in Japan, such is the dominance of road and sea transport. Current total capex market The market is estimated at $xxx billion in It grew at a high annual rate from 2004 to 2009, with a cagr over that period of 7.8% at current values. This slowed to 2.4% cagr over a 5 year period in 2012 and is estimated at x.x% in 2013 and cagr of x.x% in The total market is composed of $168 billion of plant and $106 billion in services. Our global analysis examines the global market on three levels: Total market, including China and all markets accessible and inaccessible Total market, excluding the variances of China, accessible and inaccessible Total market, only that element that is readily accessible to international players. 3

4 4

5 Further information from this report may be obtained from StatPlan Energy Research. Euan Blauvelt Or by via our website 5