Helping Operators Make Better Decisions and Improve Multi- Agency Cooperation
|
|
|
- Earl Harrison
- 5 years ago
- Views:
Transcription


1 Rapid After Action Reviews in RITIS August 9, 2017 I-95 Corridor Coalition HOGs Meeting Michael Pack, Director, Center for Advanced Transportation Technology Laboratory at the University of Maryland Helping Operators Make Better Decisions and Improve Multi- Agency Cooperation

2 RITIS overview 1 Consolidate lots of data 2 then fuse & disseminate RITIS Fusion & DSS 3 to multiple apps for your use Regional Integrated Transportation Information System process November 8,


3 Radio/Scanners 2013 Michael L. Pack, UMD CATT Laboratory


4 Many Look Back Tools Available Congestion Analysis Safety Analysis Weather Analysis Trend Analysis & MAP-21 Reporting


5 We get a LOT of data from agencies, but Data is only useful when it is easily accessible, usable, and understandable To managers, planners, operations, and ITS applications 5


6 I-70 fatality incident Background Occurred on October 29, 2016 at around 4:30 AM Located on I-70 West, past Exit 80 - MD 32 Sykesville Rd A car hit a deer, then a tractor trailer hit the car, and jack-knifed, resulting in one fatality All lanes were closed in the WB direction for over 7 hrs It took about 11 hrs to fully clear the incident and reopen all lanes 6

7 I-70 fatality incident Several RITIS / PDA tools were used to conduct impact analysis and provide visual content as part of an After Action Review EQT/ Incident Timeline Region Explorer Trend Map Congestion Scan User Delay Cost 7
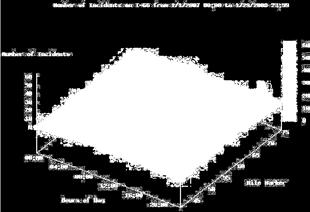
8 I-70 fatality incident Incident Timeline EQT Event Query Tool Used to review responder response times, lane & event clearance times, and Operator notes. Timeline graphics are inserted in to AARs Heat Map is used to see trends in incident activity EQT analyzes your ATMS event data for insight into event impacts on your roadway system, through auto-created tables, charts and maps. Timeline displays how an incident is being managed by showing the relationships between responder notifications & arrival times, lane status, traffic queues, clearance times, communication logs, CCTV, and DMS. 8

9 Integrated Event Management TOC Communications Notifications & Responders Lane Status Overhead Sign Messages Speed Readings 9
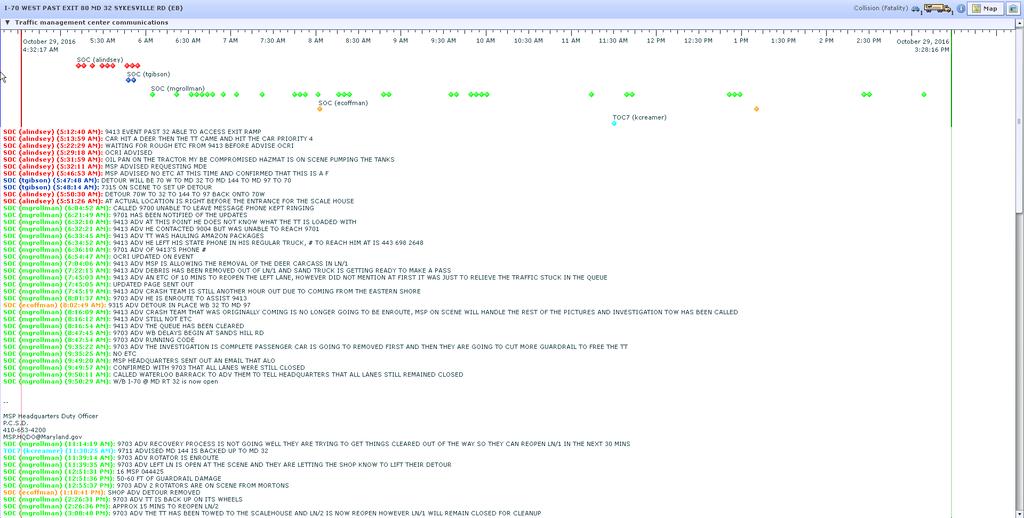
10 TOC Communications 10

11 Notifications & Responders 11

12 Lane Status, Sign Messages, Speeds 12


13 Event Query Tool Heat Map Events from MDOT CHART that started between September 1, 2016 and October 31,

14 I-70 fatality incident Region Explorer Used to determine the choke points of traffic during the incident, and future detour points Helps improve Quick Clearance practices by honing in on the effects on tertiary roadways An interactive traffic conditions app that can be used to explore the impacts of bottlenecks and incidents along a road, in real-time, or previous point in time. 14

15 Bottleneck Locations at 12:00 PM on Bottlenecks 15
16 I-70 fatality incident Trend Map Used it to determine the significance of the delay over the time of the incident s duration Using it as a case to promote Quick Clearance practices An animated congestion and event conditions map that dynamically displays changes over time. 16

17 Congested Locations at 12:15 PM on
18 I-70 fatality incident Congestion Scan Used to view historical extent of the queue Queue graphics are inserted into AARs for emphasis Analyze temporal and spatial conditions on one or more stretches for road, selecting from several mobility and reliability performance metrics. 18

19 Comparing Oct. 29 th to the prior Saturday October 22, 2016 October 29,
20 I-70 fatality incident User Delay Cost The tool we use more heavily Helps put things into dollars and cents, to prove the value of our TSM&O program Crucial to our program s funding is to prove the benefit of Quick Clearance practices By analyzing the cost of a long-duration incident, we can better make the case for additional or improved resources Example: for this incident, we were able to make the case that the State Police need an adjustment to how it manages it s tow list ( i.e.; a company should be able to prove that it has the necessary equipment for heavy duty operations) Combine speed data with volume data to estimate the cost of delay (and other measures) due to congestion. 20
 $86.")
21 What s the User Delay Cost on the following roads Assuming an Average Value of time of: $16.79 per hour (Passenger Vehicles) $86.81 per hour (Commercial Vehicles) (NOTE: User Delay is calculated any time speeds fall below free-flow) 21


22 User delay on I-70 and nearby arterials Normal Saturday = $6k - $7k Oct. 29th Saturday = ~$77k Worse than Friday the day before! 22
23 I-70 fatality incident Takeaways Now I get it Tools provide quick access to data and show the benefits of quick clearance practices and the value of TSM&O Programs It is all about justification Gives ammunition for requests for funding, positions, and equipment It is not a perception, it s a reality Tools provide data-backed conclusions for After-Action Reports Assists with making cases to external (and internal) partners about improving current practices Over time, we can analyze trends along individual corridors 23


24 I-85 Bridge Collapse Context I-85 is a major Interstate Highway that travels northeast-to-southwest in Georgia Atlanta It carries approximately 250,000 vehicles per day June 8,


25 I-85 Bridge Collapse The Event On Thursday, March 30, 2017, a fire started underneath a viaduct about six miles north of downtown Source: usatoday.com The bridge collapsed at about 7 p.m. that evening All five lanes of the highway in each direction were subsequently blocked and closed Source: 11alive.com AP Photo June 8,

26 I-85 Bridge Collapse Showing event impact The Probe Data Analytics Suite was used to produce tables and visualizations showing the impact of the bridge collapse: Trend Map User Delay Cost Analysis June 8,

27 I-85 Bridge Collapse Wednesday 8PM Thursday - 8PM Day of Collapse Friday 8PM June 8,

28 I-85 Bridge Collapse June 8,


29 I-85 Bridge Collapse User Delay Cost Analysis (depicting overall delay, and user cost increases) User delay increased by 20% on Thursday & Friday Typical Thurs. UDC = ~$5M Bridge Collapse Thurs. UDC = $7.2M Fri. UDC = $7.8M (with PM rush starting 2-3 hr. sooner than normal) June 8,
30 Live Demonstration
31 Steps to Develop AAR Materials 1. Find the incident in RITIS 2. Create Incident Timeline (if available) 3. Is this a high incident location? 4. Evaluate Congestion (during the event & before) a. Look for bottlenecks b. Develop maps c. Congestion Scans d. Measure & Compare User Delay 5. Summarize the findings 6. Put all of the materials together in a document (powerpoint or other)
32 July 3, 0723 hours, I-695 IL prior to Chesaco Road Secondary hours July 3, hours, 1759 hours.
33 Links for I-495 Incident Congestion Scans Comparative: Single: 614cfbd25435 Trend Map: ca7-be7a-68f1f45b33f4 UDC Charts:
34 For Additional Information, contact: Michael Pack UMD CATT Lab June 8,