2008 INTERIM RESULTS PRESENTATION
|
|
|
- Luke Henderson
- 5 years ago
- Views:
Transcription
1 2008 INTERIM RESULTS PRESENTATION
2 AGENDA Financial highlights 2008 Interim results Shipping Trading Freight Services Financial Services Conclusion 2
3 FINANCIAL HIGHLIGHTS 3
4 FINANCIAL HIGHLIGHTS Financial highlights Interim results 08 Shipping Trading Freight Services Financial Services Conclusion 4
5 FINANCIAL HIGHLIGHTS A positive environment... Buoyant demand for commodities Strong shipping markets High ship prices Weaker Rand/ US Dollar exchange rate 5
6 FINANCIAL HIGHLIGHTS...combined with the strategic positioning of the business... Substantial contracted earnings at high margins Modern shipping fleet contracted at low cost Shipping, Trading and Freight Services positioned to take advantage of continued demand for commodities Continued investment in growth areas 6
7 FINANCIAL HIGHLIGHTS generated pleasing results Profit attributable to ordinary shareholders of R1,1 billion Headline earnings per share of 242,8 cents Interim ordinary dividend of 68 cents per share Return on shareholders funds of 68% Market value of shipping assets up 43% to R17,1 billion 7
8 2008 INTERIM RESULTS 8
9 INCOME STATEMENT 6 MONTHS TO JUNE 2008 Divisional earnings H H Comments (US$ million) Shipping Profit from owned and long-term chartered ships Strong shipping markets: good contracts Profit/(loss) from ship operating activities 10.6 (7.1) Improved Parcel Service performance Profit from ship sales Overheads/forex/other interest/tax/preference dividends (29.2) (13.9) Increased taxation and interest charge (R million) Total group Shipping Trading Strikes in Argentina Freight Services Financial Services % sold to BEE/management Attributable earnings
10 BALANCE SHEET AS AT 30 JUNE 2008 Balance sheet (adjusted for capitalisedchartered fleet and ship revaluations) H Rm H Rm Comments Ships(owned and chartered at market value) Higher ship values Other fixed assets/investments Increased terminal infrastructure and shareholding in MPDC Bank loans, advances and liquid assets Current assets Increased volumes and prices in Trading and Freight Services Total assets Equity Higher ship values/retained earnings Net book debt Capitalised charter obligations Bank deposits Other liabilities Increased volumes and prices in Trading and Freight Services Total equity and liabilities Adjusted debt/equity Note: This excludes any revaluation of other businesses 10
11 MARKET VALUE OF FLEET Market value of fleet Rm Comments Bookvalueofownedfleet Excess of market value of owned fleet over book value Indicative ship values obtained in consultation with reputable ship brokers Book value of charters with purchase options Book value = 6% of capital element (i.e. excluding running costs) of charter commitments and purchase option price. Yen options valued at closing rate Excess of market value over book value of charters with purchase options Market value of other long-term charters and contracts Indicative ship values obtained in consultation with reputable ship brokers 317 Differential between market rates and Grindrod charter/ contractrates. PV@6% Notes: - Based on June 2008 closing Rand/US Dollar exchange rate of R The above excludes the value in respect of the Parcel Service 11
12 KEY FINANCIAL RATIOS RETURN ON ORDINARY SHAREHOLDERS FUNDS Percentage June
13 KEY FINANCIAL RATIOS INTEREST COVER Times cover June
14 SHIPPING 14
15 SHIPPING BUSINESS FOCUS Owner/operator - drybulk Handysize Panamax Capesize Owner/operator - tankers Mid-range Small Chemical Non vessel owning operating business Drybulk Total fleet in excess of 70 ships 62% revenue growth, 107% earnings growth Strong drybulk markets and firm tanker markets High level of contract cover during the period Island View Shipping Parcel Service restructured market linked contracts 3 ships delivered 3 ships sold profit of R201 million OVERVIEW OF ACTIVITIES (H1 2007: R142 million). Reasons for sale: profit share on termination of charter of handysize bulk carrier non-strategic tankers Island View Shipping profit share re-purchased Forex profit of R81 million due to weaker Rand/US Dollar closing rate (H1 2007: R4 million) 15
16 PROFIT BY CATEGORY 6 MONTHS TO JUNE 2008 Bulk carriers Tankers H Total Handysize Panamax Capesize Mid-range Small Chemical H Total Average number of owned/longterm chartered ships Average daily revenue (US$) Average daily cost (US$) Profit (US$ million)
17 FLEET OVERVIEW (owned and long-term chartered ships) 2008 (2 nd half) Contracted in at Number(average) Cost(US$/day) Number(average) Cost(US$/day) Number(average) Cost(US$/day) Bulk carriers Tankers Handysize Panamax Capesize Mid-range Small Chemical Total Number(average) Cost(US$/day) Number(average) Cost(US$/day) owned Current fleet * 30 chartered Net number of ships to deliver 2008 (2 nd half) (1) (1) Fleet at end of ** * owned fleet 8; chartered fleet 29 (of which 25 have purchase options) ** owned fleet 21; chartered fleet 30 (of which 28 have purchase options) 17
18 CONTRACTED PROFITS Contracted out at (2 nd half) Number (average) Revenue(US$/day) Number(average) Revenue(US$/day) Number(average) Revenue(US$/day) Bulk carriers Tankers Handysize Panamax Capesize Mid-range Small Chemical Total Number(average) Revenue(US$/day) Number(average) Revenue(US$/day) Contract profits % of fleet fixed Charters (US$m) Ship sales (US$m) Total (US$m) 2008 (2 nd half) In addition, ±9% of fleet is fixed from 2013 to
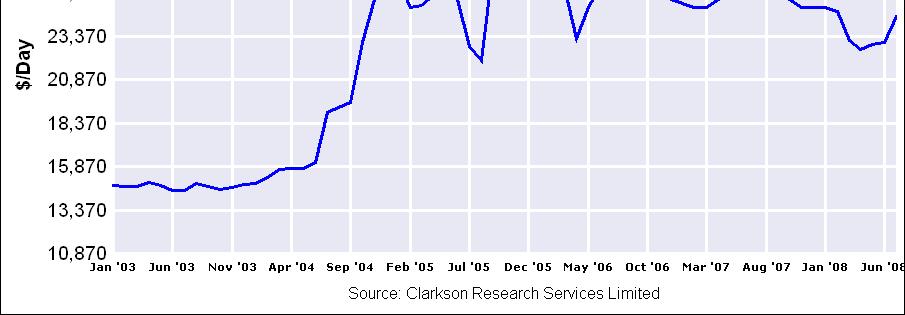
19 SHIPPING MARKETS BULK CARRIER 1 YEAR TIME CHARTER RATES 180, , , , ,000 80,000 60,000 40,000 20, US$ per day 2000-Q Q Q Q Q Q Q Q Q Q Q Q Q Q Q Q Q Q Q Q Q Q Q Q Q Q Q Q Q Q Q Q Q Q2 4-Jul Jul Jul Jul-08 1-Aug-08 8-Aug Aug-08 1 Year Bulkcarrier Timecharter Rates 150,000 dwt 1 Year Bulkcarrier Timecharter Rates 170,000 dwt 1 Year Bulkcarrier Timecharter Rates 65,000 dwt 1 Year Bulkcarrier Timecharter Rates 70/72,000 dwt 1 Year Bulkcarrier Timecharter Rates 30,000 dwt
20 SHIPPING MARKETS HANDYSIZE FLEET PROFILE - DECLINING FLEET Existing fleet profile 300 Handysize on order Existing fleet Handysize Age profile according to 5 year intervals No of ships <= Year of build No of ships End 08 End 09 End 10 End 11 End 12 No of ships Dwt Existing fleet 2, Newbuildings Percentage of fleet 28% 33% Source: Clarkson Research Percentage over 30 years 23% 21% 20
21 SHIPPING MARKETS CAPESIZE FLEET PROFILE - EXPANDING FLEET Existing fleet profile 350 Age profile according to 5 year intervals Capes on order Existing fleet Capes No of ships No of ships <= Year of build End 08 End 09 End 10 End 11 End No of ships Dwt Existing fleet Newbuildings total Source: Clarkson Research Percentage of fleet 97% 105% Percentage over 30 years 1% 1% 21
22 SHIPPING OUTLOOK AND STRATEGY Drybulk Fundamentals remain strong, but market currently showing some seasonal softness Continued growth in cargo movement China still a big driver with India adding momentum to increased demand Medium-term outlook is positive Newbuilding deliveries in 2010 and beyond will impact on market Impact should be cushioned by: shipyard delays/finance issues/scrapping substantial anticipated growth in demand Will continue to add to contract cover, but will maintain some open position on handysize fleet due to good fundamentals Financial Highlights Interim Results 08 Shipping Trading Freight Services Financial Services Conclusion 22

23 SHIPPING MARKETS 23
24 SHIPPING OUTLOOK AND STRATEGY Tankers Market is relatively stable and at firm levels Continued growth in demand: slowdown of growth in the West offset by increased demand in the East (China/India) refining capacity to be built at source, resulting in increased tonne miles Legislative/environmental restraints will force scrapping of older vessels A large portion of the group s tanker fleet has been contracted out until
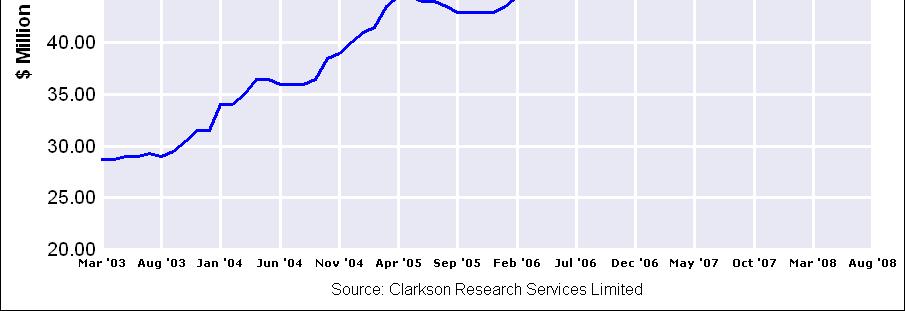
25 SHIPPING MARKETS BULK CARRIER NEWBUILDING PRICES Q Q Q Q Q Q Q Q Q Q Q Q Q Q Q Q Q Q Q Q Q Q Q Q Q Q Q Q Q Q Q Q Q Q /07 170K DWT Capesize Bulkcarrier Newbuilding Prices 120K DWT Capesize Bulkcarrier Newbuilding Prices 75K DWT Panamax Bulkcarrier Newbuilding Prices 23/30K DWT Handysize Bulkcarrier Newbuilding Prices 32/35K DWT Handysize Bulkcarrier Newbuilding Prices 25 US$ million
26 SHIPPING MARKETS BULK CARRIER SECOND HAND PRICES (5YR) Q Q Q Q Q Q Q Q Q Q Q Q Q Q Q Q Q Q Q Q Q Q Q Q Q Q Q Q Q Q Q Q Q Q Capesize 170K 5 Year Old Secondhand Prices Panamax 73K Bulkcarrier 5 Year Old Secondhand Prices Handysize 25K-30K 5 Year Old Secondhand Prices 26 US$ million

27 SHIPPING MARKETS 27
28 SHIPPING OUTLOOK AND STRATEGY Ship values Prices remain firm Decline in newbuilding orders from 2011 onwards Vessel acquisition: Limited opportunities in short-term due to high pricing Strong equity base to take advantage of acquisition/fleet expansion opportunities in medium-term 28
29 TRADING 29
30 TRADING OVERVIEW OF ACTIVITIES BUSINESS FOCUS Agricultural commodities Maize Wheat Soya Mineral commodities Chrome Coal Stainless steel Manganese Bunkers 111% revenue growth, 31% earnings decline Significantly impacted by strikes in Argentina High commodity prices increased working capital requirement Strong demand for commodities Increased shareholding in Cockett and Oreport Holdings to 100% Marine fuel 30
31 TRADING OUTLOOK AND STRATEGY Strong second half of year expected from new projects and continued commodity demand Focus: improving margins opportunities to grow through investment in supply chain 31
32 FREIGHT SERVICES 32
33 FREIGHT SERVICES BUSINESS FOCUS Ports and Terminals Intermodal Logistics Rail Seafreight Ships Agency OVERVIEW OF ACTIVITIES 64% revenue growth, 65% earnings growth Terminals, Intermodal, Seafreight and Ships Agency performed well Logistics affected by slowdown in motor vehicle and consumer retail sales Expansion of Richards Bay and Maputo terminal facilities Completed Maputo Car Terminal phase one Development of bulk liquid facility in Maputo Walvis Bay Terminal facility upgraded Expanded bulk logistics transport fleet Development of a port master plan for Maputo 33
34 FREIGHT SERVICES OUTLOOK AND STRATEGY Capital commitments/expansion opportunities: Expanding Richards Bay terminal export capacity to 4 million tonnes per annum Expansion of Matola Coal Terminal export capacity to 6 million tonnes per annum Further expansion of bulk transport fleet Construction of Autoport vehicle facilities Acquisition of a petrochemical transport business Acquisition of a freight and material handling business Port and terminal investments starting to impact positively 34
35 FINANCIAL SERVICES 35
36 FINANCIAL SERVICES OVERVIEW OF ACTIVITIES BUSINESS FOCUS Corporate Banking Corporate Finance Structured Products Retail Smart Card Private Clients 23% revenue growth 21% earnings decline, as a result of: shareholding reduced to 81% relative to last year unfavourable mark to market on equity investments Stable deposit base Healthy liquidity position Launched Grindrod Diversified Preference Share Fund Lower level of structured finance activity Net 1 progressing Mastercard affiliation 36
37 FINANCIAL SERVICES OUTLOOK AND STRATEGY Maintain conservative approach to credit extension Positive second half contribution expected from property transactions Growth in assets under management from new product roll out Initiation of trade finance offering 37


38 CONCLUSION 38
39 CONCLUSION Shipping: Long-term charter rates/ship prices indicate expectation of a firm shipping market in the medium-term Contracted growth in fleet of 38% Contract cover (H = 64% of fleet fixed, 2009 = 51%, 2010 = 35%) Impact of weakening of Rand (10 cent move = estimated +/- R25 million income statement impact) Trading, Freight Services and Financial Services: Well positioned for growth: capacity to invest in expansion new projects coming on stream 39
40 CONCLUSION Group Structure Future unbundling/international listing of Shipping still under consideration Decision to be triggered by need for capital/market conditions Freight Services BEE transaction in progress Trading update Earnings for full year 2008 expected to be 80% 100% up on
41 Reference: graphical data and information sourced from Clarksons Research Services Limited is subject to the disclaimer below Disclaimer The information supplied herewith is believed to be correct but the accuracy thereof is not guaranteed and the Company and its employees cannot accept liability for loss suffered in consequence of reliance on the information provided. Provision of this data does not obviate the need to make further appropriate enquiries and inspections. The information is for the use of the recipient only and is not to be used in any document for the purposes of raising finance without the written permission of Clarkson Research Services Limited. 41