Wa d e An d e r s o n Pr o d u c t Sp e c ia lis t Ma n a g e r
|
|
|
- Eustace Curtis
- 5 years ago
- Views:
Transcription
1 Wa d e An d e r s o n Pr o d u c t Sp e c ia lis t Ma n a g e r Okuma America Corporation Greg Feix Vice President & General Manager Gosiger Automation
2 Introduction Industry Pressures Industry Growth Types of Automation: OEM Application Driven Considerations for Automation Justification example

3 Increased global competition Continuous price reduction Shortage of qualified labor Increasing material and energy costs Increasing health care costs High quality expectations Reliable production and deliveries Currencies Globalization Skilled labor Doing MORE with Less
4 People Equipment / Tooling Materials Financial Resources The opportunities for differentiation are Your Processes business, engineering, quality and manufacturing
5 Based on a survey done of manufacturing plants in the U.S. of over 100 plants both small and large: 34% Manned Machines typically run 3000 hours/year out of 8000 hours available


6 Q Q Q Q Q Q Q Q Q Q Q Q Q Q Q Q Q Q Q Q Q Q Q Q Q Q Q RIA vs. AMT USMTO 8% 7% % of Automated Machines 6% 5% 4% 3% 2% 1% 0% Customers who were buying automation are buying even more. Customers who weren t previously buying automation now are!


7 From Partner/ Distributor: Bar Feeder Simplest methods of automation. Shaft work up to 4 typically Minimum build-up area Affordable Increase productivity, throughput Minimize scrap Machine multiple part types from one piece of bar stock FMS Pallet Systems Increase spindle utilization Less manpower per spindle Less dependency on skilled labor Zero Setup time Control system will prioritize and optimize the correct pallet order Unmanned production during off shift and weekends Less work in process


8 Pallet Pools Maximize utilization & flexibility without the cost and complexity Short run, high mix Fully integrated into the OSP control Available in 2, 6, 8, 10 and 12 pallets Can be retrofitted to existing machines Gantry Loading Ideal for small batch runs of common part families Easy to install and operate Boost efficiency through unsupervised loading and unloading workpieces Continuous operation


9 Application Driven Ability to service one or more machines Peripheral equipment, ie gaging, washing, part marking, etc. Palletizing / De-palletizing parts Custom engineering Sophisticated controls system Standard Packages Single machine only Intuitive user interface Affordable Versatile Simple Machine tending Parts washers In-process gauging Palletizing of parts Vision integration

10 Reliable Machine(s) Strategy for production Small Runs or Large Volumes Fixtures Repeatable, Safe Pressure Sensing Seating Confirmation Chip Blow-off Cutting Process predictable, redundant tools Coolant & Fluids Concentration, Filtration, Chip Control Quality Inspection, Collection, & Feedback Scheduling & Tracking Decision making to prioritize and optimize the workflow. Communication Alerting pending issues that could hinder production

11 Op 10 Lathe Op 20 Lathe Op 30 Mill Op 40 Other Conventional Process Setup L machining WIP Setup L machining WIP Setup M machining WIP Setup B machining Multi-Function Process Decreased set-up times Greater part accuracy Reduced fixturing/tooling Shortened lead times Reduced WIP Setup L machining L machining M machining B machining Best for multi-product, small to mid-lot production
12 Setup Takt Time Each Conventional: 4 Machines 9 hrs. 0.9 hr. Multi-Function Machine 0.75 hr. 1.1 hrs. Break Even Point = Setup Time Difference Run Time Difference = = 8.25 hrs..20 hr units Multi-function machine = faster through-put below 41 units Less WIP Lower Fixed Cost (Overhead)


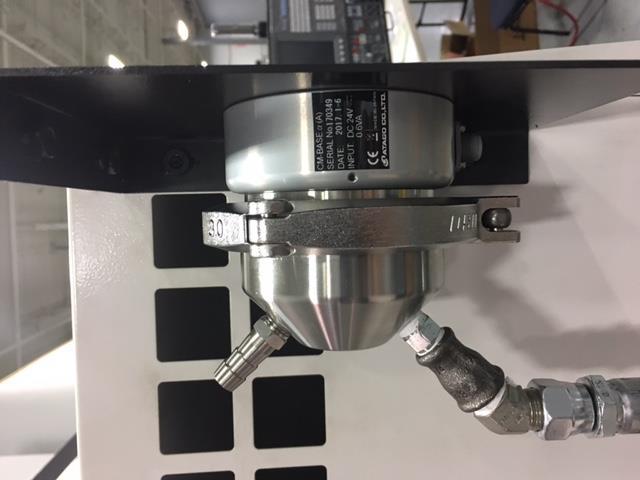
13 End of Arm Tooling Base Plate Receiver Flexible mounting platform Highly accurate and repeatable Go with large lead-in features Rotary Coupling


14 Self Contained Hydraulics No Maintenance, Tanks, Hoses Compact Great for Zero Point Clamping Force Ranges: 5000 LBS Hydraulic Vise Benefits Consistent Clamping Force Reduce Operator Fatigue Actuate Multiple Vises Compact Hydraulics Input Pressure Range: 500-4,000 PSI Clamping Force Range: 595-4,760 LBS


15 Typical OP10 Air Seat Typical OP20/30 Air Seat


16 Air/Coolant Blow-Off Air / Coolant Chip Blow-off


17 Hydraulic Connections Rotary -Union Manual Decoupler Robotic Charge Pressure Indicating


18 Part Retention Spring Loaded devices for part retention Manual or robotic loading friendly


19 1 Turret 2 Turret 3 Turret Y Axis and Multi-function Offers More Opportunity


20 Coolant Concentration


21 Coolant Concentration Coolant Pressure Coolant Flow Coolant Temperature Coolant Level Way Lube Level Chip Conveyor Speed Spindle Vibration Turret Flow

22 In-machine inspection


23 Regardless of the type of inspection, offsets should be made automatically Caron AutoComp

24 Get Connected Monitor Real Time Alerts Measurements & Reports


25 Periodic maintenance approaching Maintenance period exceeded * With OSP suite onboard
26


27


28
29


30

31
32
33 Have you ever compared: 100% production vs actual net production? Why do you produce less? Lunch, breaks and personal relief 10-15% (more?) Change-over & set up Parts inspection Material handling Tool changes Tool offsetting Other?

34 Manual Labor versus Robotic Automation
35 Machine Tools 2 Operators per shift 1 Hours per shift 8 Work shifts per day 2 Days per year 250 Scheduled labor hours annually 4,000 hrs. 100% Production rate (pph) % Production annually 40,000 pcs. Hourly rate ($15.50/hr + 50% fringe) $25.25 NOTE: Changeover and set up are not considered 100% production of one part
36 INTERRUPTIONS TO PRODUCTION MANUAL AUTOMATED Personal Relief 10% 0% Tool Changes 5% 5% Tool Offsets 5% 5% Material Handling 5% 0% Part Inspection 5% 0% TOTAL EFFICIENCY LOSSES 30% 10% NET EFFICIENCY 129% 70% 90% 100% Annual Production (pieces) 40,000 40,000 Net Annual Production (pieces) 28,000 36,000
37 Hourly Rate $15.50 Fringe Rate 50% $7.25 Total Labor and Fringe $23.25 Scheduled Labor Hours 4,000 MANUAL AUTOMATED Total Annual Direct Labor Costs $93, $93, Direct Labor Content Percent 100% 10% Actual Labor Content Cost $75, $9, Net Annual Production (pieces) 28,000 36,000 Labor Cost per Piece Produced $3.32 $0.26
38 MANUAL AUTOMATED Machine Tools $250,000 $500,000 $500,000 Inspection Equipment $25,000 $25,000 $25,000 Automation $200,000 $0 $200,000 Total Capital Investment $525,000 $725,000 Amortization Period, in years 5 Annual Capital Investment Amortized $105,000 $145,000 Net Annual Production (pieces) 28,000 36,000 Capital Cost Per Piece Produced $3.75 $4.03


39 MANUAL AUTOMATED Labor Cost per Piece Produced $3.32 $0.26 Capital Cost per Piece Produced $3.75 $4.03 Total Labor and Capital Per Piece 35.7% $7.07 $4.29 Total Parts Produced 28,000 36,000 Total Savings $100, Additional Savings: Overhead Cost per Piece $X / 28,000 $X / 36,000 Additional profit on incremental 8,000 pcs $??,???.??
40 MANUAL AUTOMATED Labor Cost per Piece Produced $3.32 $0.26 Capital Cost per Piece Produced $2.50 $2.69 Total Labor and Capital Per Piece 49.4% $5.82 $2.95 Total Parts Produced 42,000 54,000 Total Savings $155, Additional Savings: Overhead Cost per Piece $X / 42,000 $X / 54,000 Additional profit on incremental 12,000 pcs $??,???.??

41 Proven Technology Amortized direct labor cost Improve spindle utilization Consistent process Repeatable quality Unattended run-time Reduce product cost Manned Machines typically run 3000 hours/year Automated systems can be in the 7500 hours/year range
42 If you haven t take a look! If you have look again!