Urban Freight Transport Policies in Rome: Lessons Learned and the Road Ahead
|
|
|
- Bruno Williamson
- 5 years ago
- Views:
Transcription
1 Corso di LOGISTICA TERRITORIALE marzo 2015 DOCENTE prof. ing. Agostino Nuzzolo Urban Freight Transport Policies in Rome: Lessons Learned and the Road Ahead
2 Overview Introduction City Logistics Policies Framework City Logistics Policies in Rome The surveys Policy Assessment Methodology Modeling Framework to Assess City Logistics Scenarios Conclusions 2
3 Overview Introduction City Logistics Policies Framework City Logistics Policies in Rome The surveys Policy Assessment Methodology Modeling Framework to Assess City Logistics Scenarios Conclusions 3

4 Introduction Municipality of Rome Population density [inh./km 2 ] Northern Italy Inhabitants: Employees: Economic activities: Main road network Southern Italy 4
5 Introduction Municipality of Rome Retail employees respect to population Northern Italy Southern Italy 5
6 Introduction Municipality of Rome Warehouse employees respect to population Northern Italy Southern Italy 6


7 Introduction Municipality of Rome Inner zone Historic and the most famous zone in the city 1/2 Inner area (freight LTZ) 6 km 2 51,413 inhabitants 130,000 employees 24,401 trade employees 7
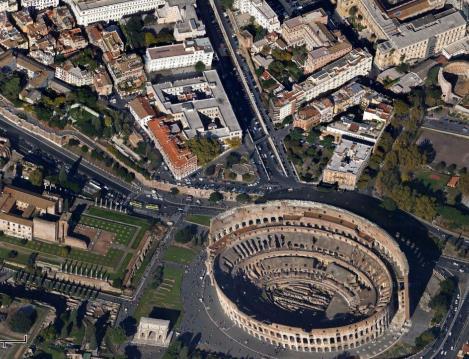
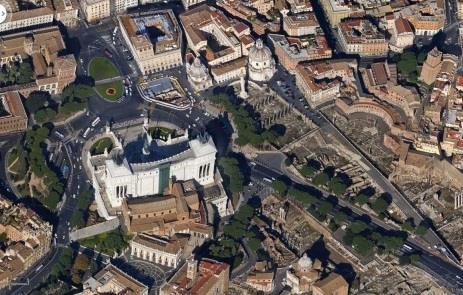

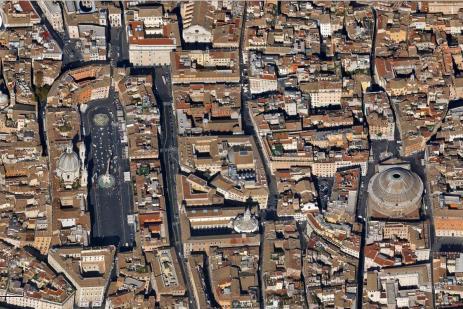

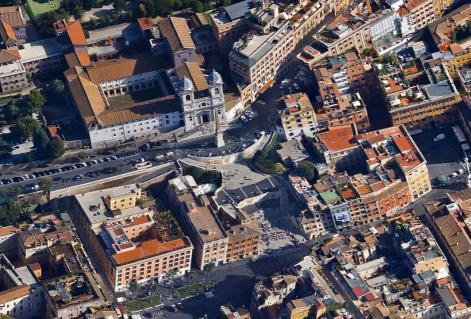

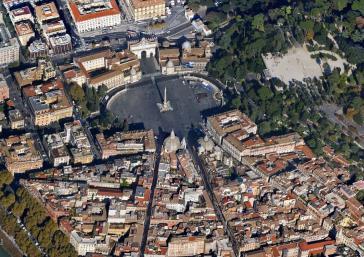
8 Introduction Municipality of Rome Inner zone The Trevi Fountain Piazza del Popolo 2/2 Piazza di Spagna Pantheon and Piazza Navona The Capitoline Hill The Forums Mouth of Truth The Colosseum 8
9 Introduction The freight distribution in the inner zone contributes: to congestion, air pollution, noise (environmental impacts) to have a combination of different types of vehicles on the road that increases the risk of accidents (social impacts) to raise logistic costs, and hence the price of products (economic impacts) 9
10 Overview Introduction City Logistics Policies Framework City Logistics Policies in Rome The surveys Policy Assessment Methodology Modeling Framework to Assess City Logistics Scenarios Conclusions 10
11 City logistics policies framework Strategies In order to assure an efficient urban freight distribution system, able to meet the requests of several involved stakeholders and to minimize the externalities, the city administration has been implementing some strategies: reduction of number of commercial vehicles and increasing of commercial speed (economic/financial sustainability), use of light and environmental-friendly vehicles (environmental sustainability), reduction of interferences with other components of city mobility (social sustainability). 11
12 City logistics policies framework Policies/ Measures Strategies Planning horizons Receiver /Sender Relevant impacts (+/-) 3P Own Acc. Transp. costs Safety Congestion Envir. Weight and dimension constraints Time windows Emmision constraints Electronic Access Control Use of light vehicles Reduction of interference Use of envirnomentalfriendly vehcles Reduction of number of vehicles Tactical/ Operative X Operative X X Tactical/ Operative Tactical/ Operative X - + X Area-pricing Incentives Nearby Delivery Area Reduction of number of vehicles Use of environmentalfriendly vehicles Reduction of number of vehicles Strategic/ Tactical Strategic/ Tactical Tactical/ Operative X X X + + X X Urban Distribution Center/ Transit point Use of light and environmentalfriendly vehicles Strategic X
13 Overview Introduction City Logistics Policies Framework City Logistics Policies in Rome The surveys Policy Assessment Methodology Modeling Framework to Assess City Logistics Scenarios Conclusions 13
14 City logistics policies in Rome Regulation over the last 10 years Measures/ Policies Time windows Less than 3.5 t Access: 9.30am 11am 2.30pm 4pm before after 2011 More than 3.5 t Access: Specific path and time permissions Exemptions for valuables, pharmaceuticals, newspapers, and vehicles carrying out maintenance activities Less than 3.5 t Access: 8pm 10am 2pm 4pm More than 3.5 t Access: 8pm 7am and subject to specific path and time permissions Exemptions for third account vehicles, valuables, pharmaceuticals, newspapers, and vehicles carrying out maintenance activities Less than 3.5 t Access (Euro 2 and 3): 8pm 7am 10am 4pm Access (Euro 4, 5 and 6): 8pm 5.30pm More than 3.5 t Access: 8pm 7am and subject to specific path and time permissions Exemptions for electric, LPG, CNG, hybrid vehicles less than 6.5 t complying the gauge of light goods vehicles (less than 3.5 t). Electronic Access Control Emission constraints none none no access to Euro 0 and 1 freight vehicles Road-pricing none none 570 /year discounts for Low Emission Vehicles (- 20% CNG, LPG hybrid, -50% electric) Electronic Access Control Max loading and unloading time: 30 minutes no access to Euro 0, 1, 2 (from 2012), 3 (from 2013) freight vehicles Depends on vehicle emission standards 14
15 City logistics policies in Rome Regulation before 2001 Measures/ Policies Time windows Emission constraints Roadpricing Less than 3.5 t Access: 9.30am 11am 2.30pm 4pm before 2001 More than 3.5 t Access: Specific path and time permissions Exemptions for valuables, pharmaceuticals, newspapers, and vehicles carrying out maintenance activities none none none none 1/2 Due to the high number of exemptions and the low enforcement, this regulation had little effects in terms of reducing freight traffic in the inner area and of improving its environmental sustainability. In 1999, the municipality carried out some surveys aiming at identifying the problems of freight transport supporting the decisions on the actions to be implemented 15
16 City logistics policies in Rome Regulation before 2001 Main 1999 survey results 2/2 presence of through freight traffic representing the 34% of all freight trips the high share of transport in own account (54%) and of commercial vehicles more than 1.5 tons (74%) problems of loading and unloading, especially because of insufficient parking space (34% of retailers evidenced this problem, and only the 5% of interviewed truck drivers have declared to use the legal space for loading and unloading operations) 16
17 City logistics policies in Rome Regulation between 2001 and 2011 In 2001, a new regulation for freight traffic with restrictions on access to and parking in the inner area was in place. In addition, for a large portion of the inner area an electronic system of access control has been implemented for both passenger and freight vehicles. Main objectives: Increasing of 3P to reduce the share of most pollutant vehicles to reduce the share of heavy vehicles Measures/ Policies Time windows Emission constraints Less than 3.5 t Access: 8pm 10am 2pm 4pm Electronic Access Control Roadpricing More than 3.5 t Access: 8pm 7am and subject to specific path and time permissions Exemptions for third account vehicles, and specific freight types no access to Euro 0 and 1 freight vehicles 1/3 570 /year discounts for Low Emission Vehicles (- 20% CNG, LPG hybrid, -50% electric) 17
18 City logistics policies in Rome Regulation between 2001 and 2011 Main 2008 survey results to create incentives for 3P: Time windows and charging scheme allowed to reduce the transport in own account from 54% to 21% to reduce the share of most pollutant vehicles: New regulation pushed to use more environment-friendly vehicles (83% were at least Euro 3 or 4) to reduce the share of heavy vehicles: New regulation pushed to use light vehicles (from 44% to 65%) 2/3 18
19 City logistics policies in Rome Regulation between 2001 and 2011 Persisting problems from 2008 surveys 3/3 the frequency of restocking has increased and there are more retailers receiving goods one or more times a day the number of freight vehicles in the area has increased from 1999 to 2008 by about 24% pollutant level in the inner area is still too high and often the standard environmental limits are exceeded the share of retailer considering very important problems related to the space for loading and unloading operations has increased (69%) 19
20 City logistics policies in Rome Regulation after 2011 In 2008, the evaluations highlighted that good but not too satisfactory results have been obtained New actions have been planned from 2012 for reaching higher levels of sustainability Measures/ Policies Time windows Emission constraints Road-pricing after /4 Less than 3.5 t More than 3.5 t Access (Euro 2 Access: and 3): 8pm 7am 8pm 7am and subject to specific 10am 4pm path and time Access (Euro 4, 5 permissions and 6): 8pm 5.30pm Exemptions for electric, LPG, CNG, hybrid vehicles less than 6.5 t complying the gauge of light goods vehicles (less than 3.5 t) Electronic Access Control Max loading and unloading time: 30 minutes no access to Euro 0, 1, 2 (from 2012), 3 (from 2013) freight vehicles Depends on vehicle emission standards 20
21 City logistics policies in Rome Regulation after 2011 Phase I (implemented from November 2011) 2/4 New access limits for commercial vehicles (both vehicles for freight distribution and services) have been introduced no access to vehicles do not comply the Euro 2 standards; environmental-friendly vehicles (i.e. CNG, LPG, hybrid and electric) have a reduced charge for accessing within study area. 21
22 City logistics policies in Rome Regulation after 2011 Fase I design and preliminary ex-ante assessment 3/4 to adjust the fees in order to obtain revenues which could support the new integrative measures (e.g. control of loading and unloading zones) good results can be obtained in terms of pollutant reductions, e.g. the matter particulate could be reduced of 6% in 2012, and 33% from
23 City logistics policies in Rome Regulation after 2011 Phase II (to be implemented in 2013) 4/4 from 2013 no access to vehicles do not comply the Euro 3 standards; incentives to buy new environmental-friendly vehicles, enforcing for verifying the correct use of loading and unloading zones. 23
 Implementation of Nearby Delivery Area for commercial activities of the inner area Nearby Delivery Areas")
24 City logistics policies in Rome Regulation after /3 Measures to be verified Ban access to all vehicles (both private and commercial) Implementation of Nearby Delivery Area for commercial activities of the inner area Nearby Delivery Areas 24

25 City logistics policies in Rome Regulation after 2011: Nearby Delivery Area 2/3 Measures to be verified 25
26 City logistics policies in Rome Regulation after 2011: Public Urban Distribution Centres for improve the two-tier distribution system Measures to be verified Northern Italy 3/3 MainRoad Network Public Urban Distribution Centres Southern Italy 26
27 Overview Introduction City Logistics Policies Framework City Logistics Policies in Rome The surveys Policy Assessment Methodology Modeling Framework to Assess City Logistics Scenarios Conclusions 27
28 The surveys Structure traffic counts of commercial and private vehicles telephone interviews to retailers interviews to truck drivers Traffic counts Telephone interviews Retailers Truck-drivers (12%) sections (38%) 502 (-) response rate 28
 9% (2008)")
29 The surveys commercial vehicles Traffic counts 7am 6pm Cars Commercial vehicles ,190 25, ,922 25, Daily incidence of freight vehicles: 12% (1999) 9% (2008) 29
30 The surveys Traffic counts Considering that in 2008 through freight traffic can be assumed zero The freight traffic attracted by the zone has grown of about 24% Vehicle type Gross laden weight less than 1.5 tons 57% 26% Gross laden weight within 1.5 and 3.5 tons 33% 50% Gross laden weight within 3.5 and 8.5 tons 10% 22% Other vehicles 2% Total 100% 100% 30
31 The surveys Retailer interviews Sale surface Less than 100 m 2 68% 82% Between 100 and 200 m 2 27% 15% More than 200 m 2 4% 3% Total 100% 100% Average number of employees Activity type Retailers and public concerns Craftsmen


32 The surveys Retailer interviews Transport in own account In 1999, 54% of businesses transported in own account, in 2008 only 21%
33 The surveys Truck driver interviews Fuel Less than More than Less than More than Total 1.5 t 1.5 t 1.5 t 1.5 t Total Gasoline 8% 1% 8% 10% 3% 13% Diesel 56% 34% 90% 33% 53% 86% LPG 1% 0% 1% 1% 1% CNG 0% 1% 1% 0% Total 65% 35% 100% 44% 56% 100% Truck owners 61% (1999) 39% (2008) 33

34 The surveys Truck driver interviews Delivery frequency 34


35 The surveys Truck driver interviews Trip origin and destination 2008 Trip origin Trip destination
36 The surveys Truck driver interviews Delivery time and number of deliveries Delivery time and number of deliveries Freight type Delivery time Delivery time Number of deliveries [minutes] [minutes] Number of deliveries Books and musical products Building materials Clothing Flower Foodstuffs Home accessories Household or electrical appliance Hygiene products Laundry Pharmaceutical Stationery Other goods Average
37 The surveys Truck driver interview Quantity flows (2008) Emitted Attracted [tons/day] [tons/day] Building Materials Clothing ,075.0 Foodstuff s ,234.2 Home accessories ,863.8 Household and personal hygiene Stationery ,475.9 Other goods 3.2 2,175.2 Total , % of freight quantity is destined to satisfy end-consumer demand 37
38 The surveys Truck driver Distribution process (distributive logistics) Rome (2008) Producer Distribution Center 57% 58% 64% Retailer/ Public concern End- Consumer (final, intermediate) Wholesaler Percentage respect to the freight outcoming from node Large-scale retail trade
39 Overview Introduction City Logistics Policies Framework City Logistics Policies in Rome The surveys Policy Assessment Methodology Modeling Framework to Assess City Logistics Scenarios Conclusions 39
40 Policy assessment methodology The urban goods movements are the results of a set of choices made by: Inhabitants/customers Retailers Wholesalers, logistics operators and distributors City administrations analysis and selection of implementable policies/measures has to consider such actors and find an optimal compromise between all interests of the involved actors 40
41 Policy assessment methodology Current Scenario Data collecting Models Ex-ante Assessment New Scenario Critical Issues Consultation New Current Scenario 41
42 Overview Introduction City Logistics Policies Framework City Logistics Policies in Rome The surveys Policy Assessment Methodology Modeling Framework to Assess City Logistics Scenarios Conclusions 42
43 Modeling Framework to Assess City Logistics Scenarios Choice dimensions, decision-makers and measures/policies Demand Supply Choice dimension Distribution Shop Which Acquisition Service What Which centre location and restocking zone? type? time? vehicle? location? dimension? tour? Decision-maker Retailer x x x x x x x Wholesaler x x x x Carrier x x x Measures/Policies Urban Distribution Centre/transit point x x x x x Time windows x x x Weight constraints x x x Road/parking pricing x x x Incentives x x x Specific permits x x ITS x 43
44 Modeling framework to assess city logistics scenarios Main requirements To point out the decision-makers choices To take into account the effects on choices due to measures/policies implementations 44
45 Modeling framework to assess city logistics scenarios Structure Quantity allows to capture the mechanisms underlying the freight demand generation Attraction Attracted quantities Shipment size Delivery time Departure time Trip chain order Delivery allows to follow the decisional and logistic process of restocking Acquisition Transport service Vehicle type Delivery location Vehicle Input for assignment and performance models quantity O-D matrices delivery O-D matrices vehicle O-D matrices model data 45
46 Overview Introduction City Logistics Policies Framework City Logistics Policies in Rome The surveys Policy Assessment Methodology Modeling Framework to Assess City Logistics Scenarios Conclusions 46
47 Conclusions 1/4 The 2001 implemented measures (mainly access restrictions and charging scheme with electronic access control) have caused some important changes in freight transport patterns within the inner area of Rome, e.g.: reduction of own account increasing of light and less pollutant vehicles 47
48 Conclusions 2/4 The 2008 survey shows that some critical aspects of urban freight transport still persist: the frequency of restocking with a higher number of retailers receiving goods one or more times a day is increased the absolute number of freight vehicles accessing the inner area is increased the goods movements are still concentrated in the morning hours the lack of loading and unloading zones 48
49 Conclusions 3/4 Even though other measures have been implemented after 2011, further measures to improve the efficiency of goods distribution process are in progress: Two-tier distribution system Nearby Delivery Area within the inner area Four Peripheral Public Distribution Centers 49
50 Conclusions 4/4 Further analysis in order to improve the calibrated models for the ex-ante assessment Extension of data analysis and modeling in order to consider land-use/transport interaction: Shopping mobility (e.g. user s behavior) Retailing, public concern and large-scale retail trade locations 50