Transportation Economics: The Role of Transport Statistics in National Development
|
|
|
- Georgia Ferguson
- 5 years ago
- Views:
Transcription

1 Transportation Economics: The Role of Transport Statistics in National Development
2 Presentation Outline Introduction Major Stakeholders in Statistical Production and Management Statistics and national development Transport Statistics and National Transport in Uganda Effects of Planning without Statistics Recent Initiatives in the Nigerian Statistical System (NSS) Challenges Going Forward Conclusion

3 Introduction Why Statistics? All governments need good statistics because good statistics are part of enabling environment for development Relevant Quotations Sound data represent the key weapon in the battle against poverty President, Asian Development Bank If you can t measure it, you can t manage it Robert Kaplan Statistics are the eyes of policy makers Director of Economic Affairs Uganda Ministry of Finance 3
4 Introduction. Statistics can be defined as facts or data of a numeric kind, assembled, classified and tabulated so as to present significant information about a given subject Informed Decisions Knowledge Discovery of Facts 4 Sustainable national development
5 Introduction. Why Statistics?... Statistics, Policy and Decision-making Statistics NDP SDGs African Agenda 2063 Statistics ETC.. 5


6 Introduction. Why Statistics?... Role of Statistical Information In general, Statistics are a powerful tool used for Planning Administration Monitoring/Evaluation Governance/Accountability Public Debate and Informed Choices 6
7 Introduction. Why Statistics?... In all the Stages of Policy Design and Decision-Making 7
8 Major Stakeholders in statistical production and management. NSS Producers Users Suppliers NBS Govt Bus Indivi duals HH Ind.Bu s. Admin. Sources LGIS SSS FASS Others
 National")
 All Federal & State MDAs")
9 Major Stakeholders in Data Production and Management. Major Data Producers National Bureau of Statistics (NBS) National Population Commission (NPopC) Central Bank of Nigeria (CBN) Nigerian National Petroleum Corporation (NNPC) All Federal & State MDAs Statistical Units in all LGAs

10 Major Stakeholders in Data Production and Management. Major Data Suppliers
11 Major Stakeholders in Data Production and Management Data Users Policy Makers at both the Legislative and Executive arms of Governments, Public Sector Managers, Academics/Researchers Private Organisations Consultants International Organisations, The Media General Public

12 Statistics and national development Types of Plans for national development


13 Statistics and national development. Key Areas. Natural Resource Development Land Water- Rivers, Stream Forest Agriculture Mineral Resources Environmental Stability {Ecosystem balance} Air Erosion & Desertification Urbanization Refuse Mgt. Etc.

14 Statistics and national development Key Areas in national development Human Development Population/Quality Labour Force Education Health Poverty/Prosperity Infrastructure Development Capital Formation Transportation Buildings Communication etc. Government need statistics in all these area in National Development
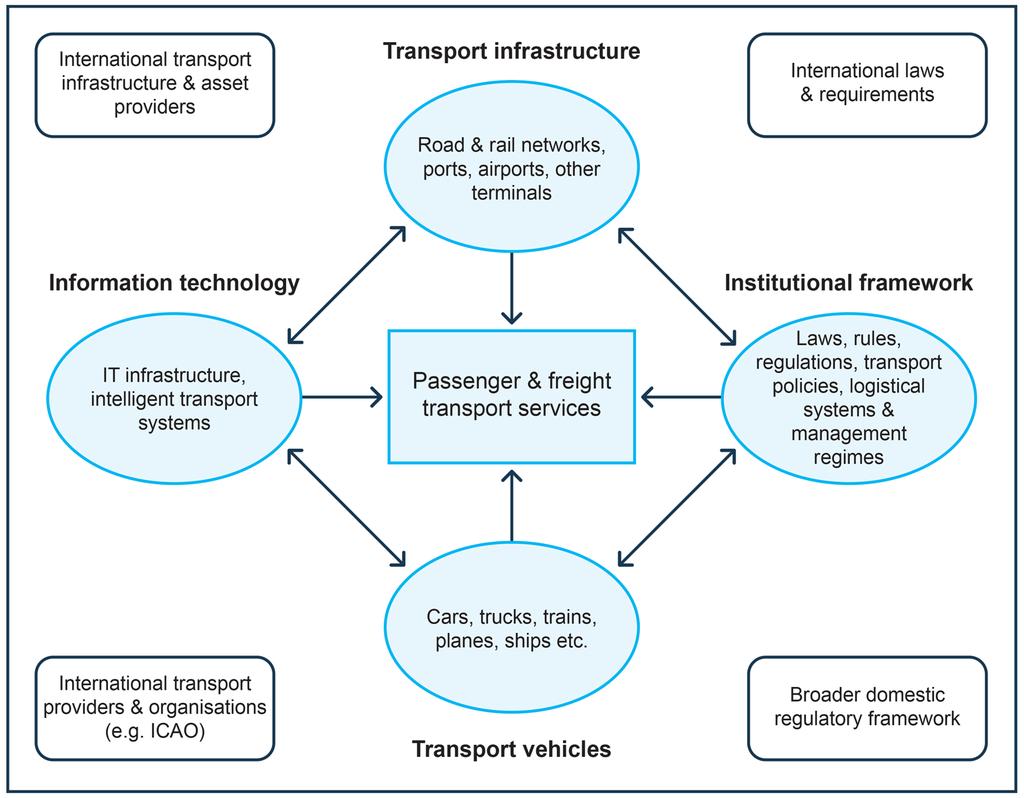
15 Transportation and National Development Transportation contributes to the economic, social and cultural development of any country. Every commodity produced needs transport at all stages from production to distribution. However, inadequate transportation facilities retard the process of socio-economic development of the country
16 Transportation and National Development. School Business Industry Access Community Access Transport Access Recreation Access Market Workplace Hospital
17 Transportation and National Development. The principal role of transport is to provide or improve access to different locations for businesses and individuals, for both freight and personal movements. For the business sector, this involves connections between businesses and their suppliers, between businesses and other businesses, and between businesses and their markets
18 Transportation and National Development. For the household sector, transport provides people with access to workplaces, schools and shops It connects them to social, recreational, community and medical facilities, for personal and leisure activities.
19 Transport in Uganda Uganda is experiencing high levels of rural-urban migration, making mobility in Kampala challenging GKMA (Greater Kampala Metropolitan Area) contains 2.3 million inhabitants Transport facilities in the city take care of less than 10% of the urban people
20 Transport in Uganda This put a strain on the central business district (CBD) as the sole centre of economic activity Because, Transportation Networks for the different modes have not been able to develop properly, Thus, the narrow streets of the city are unable to meet the increasing demand in transport, which results in severe congestion with many negative impacts
21 Problem Associated with Inadequate provision of Transport The Societal problems associated with inadequate provision of transport facilities include; Wastage of time: Result to lost of man-hours which is a major factors of production Non-regulation of Price- lead to arbitrary increase in price Un-coordinated transport system- where a bus driver operates in an un-coordinated route Lack of an integrated and affordable public Transport system

22 Problem Associated with Inadequate provision of Transport Wastage of time

23 Problem Associated with Inadequate provision of Transport Un-coordinated transport system
24 Problem Associated with Inadequate provision of Transport Congestion over stressing of the available facilities; it has its effects: it causes chaos, Recklessness unsustainable urban transport system It can lead to conflict btw commuters, btw operators and law enforcement agencies Lead to disorderliness in the park
25 Problem Associated with Inadequate provision of Transport Kampala during Rush hours
26 Problem Associated with Inadequate provision of Transport CONGESTION Kampala during Rush hours KAMPALA S traffic jams delays people to arrive at their destinations, and costs the economy shs. 500m (150,000 euro) every day. According to the State of Environment Report for Uganda 2008, the city experiences jams because of the huge rise in motorization which is not been accompanied by infrastructure facilities. For instance, during peak hours given that half of the 375,324 vehicles registered in 2008 are in Kampala, and each uses a minimum of one ltr of petrol in traffic jam every day, at shs 3500 (1.2 Euro) per ltr, this translates into losses of more than sh500m ( euro) per day. (National road safety report 2010)
27 Problem Associated with Inadequate provision of Transport SAFETY Kampala ISSUES during Rush hours In the year ,000 road accidents were reported. 39% of the fatalities are pedestrians 32% Passengers 29% others which include motor cyclists, pedal cyclist and drivers. This is one of the highest in the world (National road safety report 2010)

28 Problem Associated with Inadequate provision of Transport Reckless driving by motor cyclists, pedal cyclist and drivers

29 Problem Associated with Inadequate provision of Transport Kampala is moving towards this
30 Transportation Investment Transport investments have multiple overlapping economic impacts, which can be assessed from several perspectives. The initial impacts of investments in transport can manifested in the following: changes in residential and industrial location, property prices, changes in the supply and demand for labour, and differential effects on the economy.
31 Transport Investment Socio-Economic Benefits of Transportation: Transport improvements usually increase the scale and scope of economic and social interactions (both for freights and passengers Passengers Freight Direct Effect and efficiency Indirect Effect and Economies of Scale Induced Multipliers and Opportunity Users Time and cost savings (e.g. commuting). Income from transport operations Employers/Retail Wider access to labor or customers. Rent Income. Goods and services to users Society Improved mobility. Increased social opportunities. Operators Time and cost savings (e.g. deliverables). Income from transport operations Customers Productivity gains (time and cost savings). Rent income. Goods and services to operators. Wider range of suppliers and markets. Economy Formation of distribution networks. Attraction of economic activities. Increased competiveness.

32 Transport Investment.
33 Transport Investment
34 Importance of Transport Statistics: Good Governance For Good Governance, Government Need Good Statistical information in the following areas Passenger rail transport Freight rail transport Urban and suburban passenger land transport Freight transport by road Transport via pipeline Sea and coastal passenger water transport Sea and coastal freight water transport Inland passenger transport Inland freight water Passenger air transport Freight air transport Warehousing and support activities for transportation
35 Importance of Transport Statistics: Good Governance To do this, Government has to identify the resources available to it, identify Programmes/Projects, formulate Policies and targets map out strategies for attaining set goals, monitor the implementation of programmes and policies, and evaluate the end results to see how far the objectives/goals are met The only effective instrument for doing this is Statistics!

36 Importance of Transport: Business efficiency Government use these statistics to plan and invest in transportation which have direct impact in businesses
 Design programmes to eradicate problems Select appropriate actions to eradicate problems Forecast future situations based on chosen policy actions Provide bases for monitoring programme")
37 Importance of Transport Statistics: Democratic Debate Democratic debates that are based on good statistics will help to Identify societal problems that need attention---- (congestion, Man-hour lost, cost etc) Design programmes to eradicate problems Select appropriate actions to eradicate problems Forecast future situations based on chosen policy actions Provide bases for monitoring programme implementation Provide bases for evaluating programme outcome and impacts on society
38 Effects of Planning without Statistics Issues Accountability Transparency Openness Corruption Informed debate, etc Cost Wastages Inadequacies Poverty Instability, etc
39 Recent Initiative in the Nigerian Statistical System (NSS) Statistics Strategies & new Legal Instrument National Statistical Master Plan (NSMP) National Strategy for the Development of Statistics (NSDS) MDAs Sector Statistics Strategy (Transport sector) State Statistical Master Plan (SSMP) New Statistics Act State Government Statistics Edicts


40 Recent Initiative in the Nigerian Statistical System (NSS). Federal level State level Statistics Act Statistics Edict 20 states have Statistics Edict in Place Abia Anambra Cross River Delta Edo Ekiti Enugu Gombe Imo Kaduna Kano Kogi Kwara Niger Ogun Ondo Oyo Rivers Sokoto Zamfara
41 Recent Initiative in the Nigerian Statistical System (NSS). Improved Statistical Coordination NPopC CBN DPRS eg Transport sector NBS SBS Federal level State level NPopC NBS DPRS
42 Recent Initiative in the Nigerian Statistical System (NSS). Establishment of Bureaus of Statistics Federal level State level NBS SBS 22 states only: Abia Anambra Cross River Delta Ekiti Enugu Gombe Imo Kwara Kaduna Kano Kogi Lagos Niger Ondo Oyo Plateau Sokoto Zamfara
43 Recent Initiatives in the Nigerian Statistical System (NSS) Clearing of backlog of data Filling of gaps in data production Conduct of mass Surveys and Censuses Emphasis on Administrative Statistics (The Compendium of Statistical Terms) Rebasing of the nation s GDP from 1990 base year to 2010, thereby bringing in new sectors such as Arts, Entertainment & Recreation Information & communication Professional, Scientific & Etc. Technical Activities
44 Recent Initiatives in the Nigerian Statistical System (NSS) Improved data production process & tool for data Management Digitalized EA Maps Scannable Questionnaires Modern tools for data collection (GIS, GPS Technology) Scanners for data processing Powerful tools and Advance software application for data analysis. National Data Centre & NBS website for world wide dissemination and Archiving

45

46 NBS Corporate HQ


47 Recent Initiatives in the Nigerian Statistical System (NSS) Enhance quality data Enhance access to data Communication Room MDAs Server, UPS & Stabilizer Room
48 Challenges Inadequate funding for statistical operations Apathy towards statistics by key stakeholders and decision makers Inadequate professionals in both statistical and Research fields Lack of application of Statistical findings in policy formulation and execution 48


49 Going Forward Improved Funding through Government and Donors Increase in statistical awareness through intensive advocacy Embracing the culture of evidence High political will to support statistical development and Research work Increased training and re-training of professionals in the fields of Statistics and Research 1/3/2018
50 Conclusion Transport Statistics is critical in the design and implementation of national development framework Reliable and timely transport statistics needed for measuring the sector performance It is important that all stakeholders are carried along in the production of Statistics and inparticular Transport Statistics 1/3/2018
51 T H A N K Y O U