TDL Industry Trends from a National Viewpoint
|
|
|
- Violet Green
- 5 years ago
- Views:
Transcription

1 TDL Industry Trends from a National Viewpoint


2 TDL-Freight Means What Globalization Corridor Connectivity Matters Future and Regionalization SC Response
3 TDL-Freight Means What


4 What Drink Can t You Live Without? When do you expect to get this? Where do you expect to get this? How much are you willing to pay in time or money to get it? What are your expectations?

5 How Does One Look at Freight Activity? Inventory Functions Engineering Operational Reliability Economical and Financial Safety and Security Markets Jobs Big F or little f
6 100% U.S. is Largest Freight Transportation User in World (Source OECD) 80% 60% 40% 20% 0% Rail Road Waterway Pipeline Total US ROW
7 Logistics Matters to US Economy U.S. spent $1.2 trillion on logistics 8.3% of GDP (CSCMP) U.S. spent $289 billion on public infrastructure (Governmentspending.com) 5% of all government spending 2% of US GDP
8 What Industries Drive the South Carolina Economy, 2010 Agriculture, forestry, fishing, and hunting 1% Mining 0% Utilities 3% Construction 4% Government 18% Manufacturing 16% Services 43% Retail trade 8% Wholesale trade 5% Transportation and warehousing 2%
9 Share Based on Estimated Industry Clusters, NIACS Code 2010 Comparison of Freight Dependency US, Southeast, South Carolina US Average Southeast Average South Carolina Producing Consuming
10 Where Does SC Freight Go? 2010 FAF Value (outer) From 37% From 32% Tonnage (inner) Within 47% Within 26% To 21% To 37%
 100% 90% 80%")

")
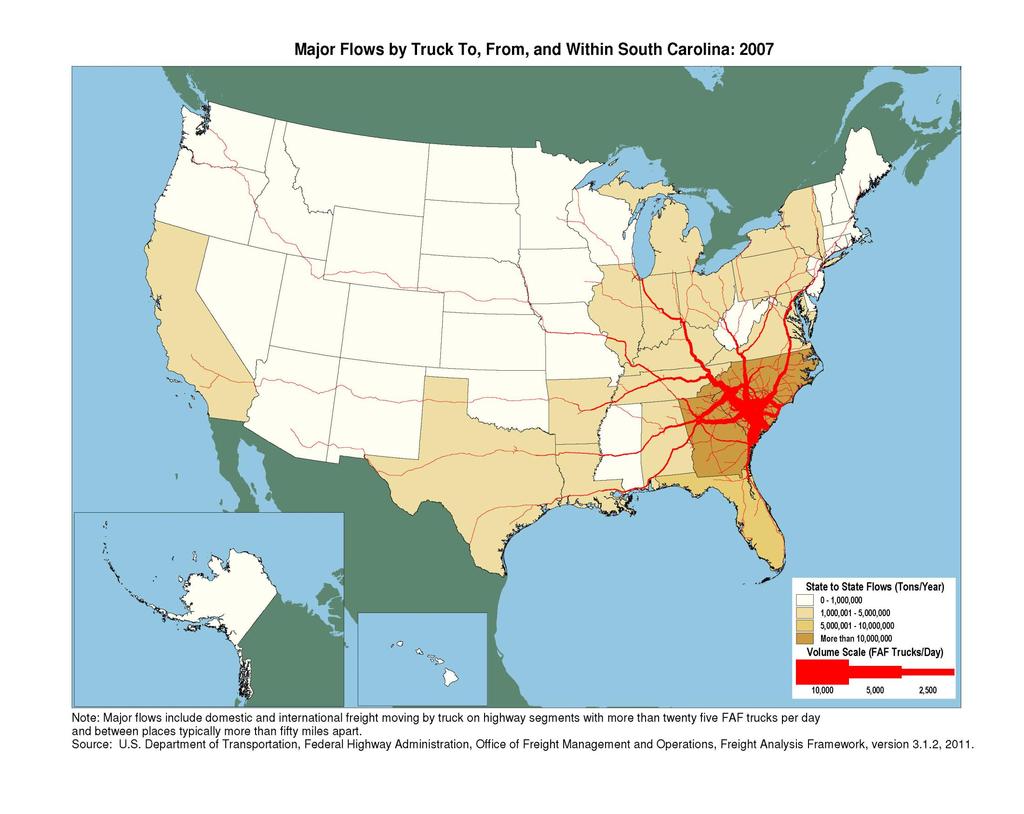
11 How Will SC Freight Get There (2010 FAF, Value) 100% 90% 80% 70% 60% 50% 40% 30% 20% 10% 0% Within Inbound Outbound Pipeline/Other Multiple modes & mail Air (include truck-air) Water Rail Truck
12 Ton Miles of Truck Shipments by Regional Average Alabama Arkansas Florida Georgia Kentucky Louisiana Mississippi North Carolina South Carolina Tennessee Virginia West Virginia State for 2002 Within/Local To/From Through 0% 25% 50% 75% 100%
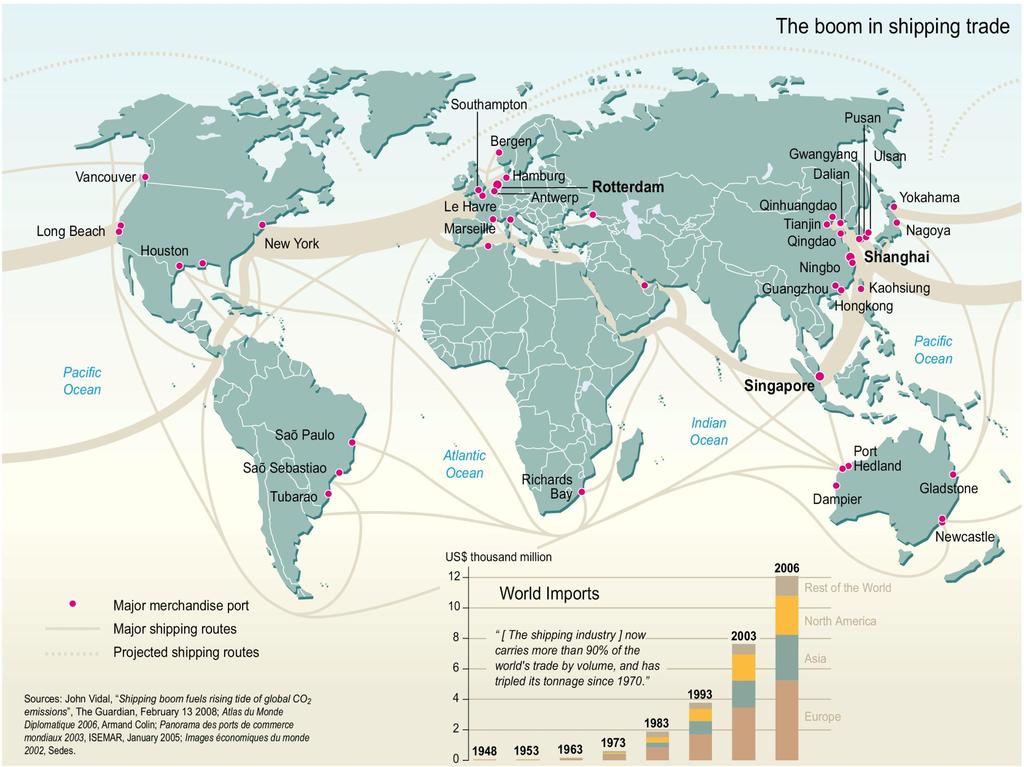
13 Globalization

14 Export Related Jobs as Share of Employment, P e r c e n t a g e % of Manufactoring % Private Sector Employeement
15

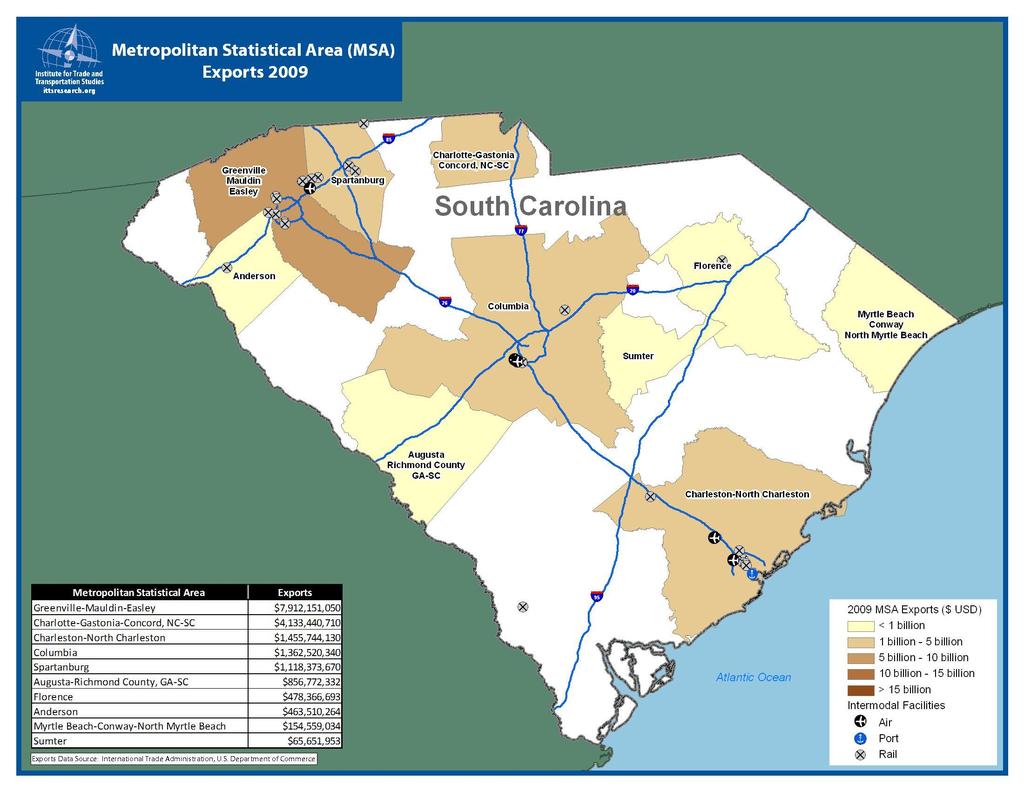
16 South Carolina Shipments by Origin, Trade by Mode, By Value

17 South Carolina Shipments of Origin, top Commodities 2010 (All modes - $20.3 Billion)

18 South Carolina Shipments of Origin, Top Destinations 2010 (All modes - $20.3 Billion)
19
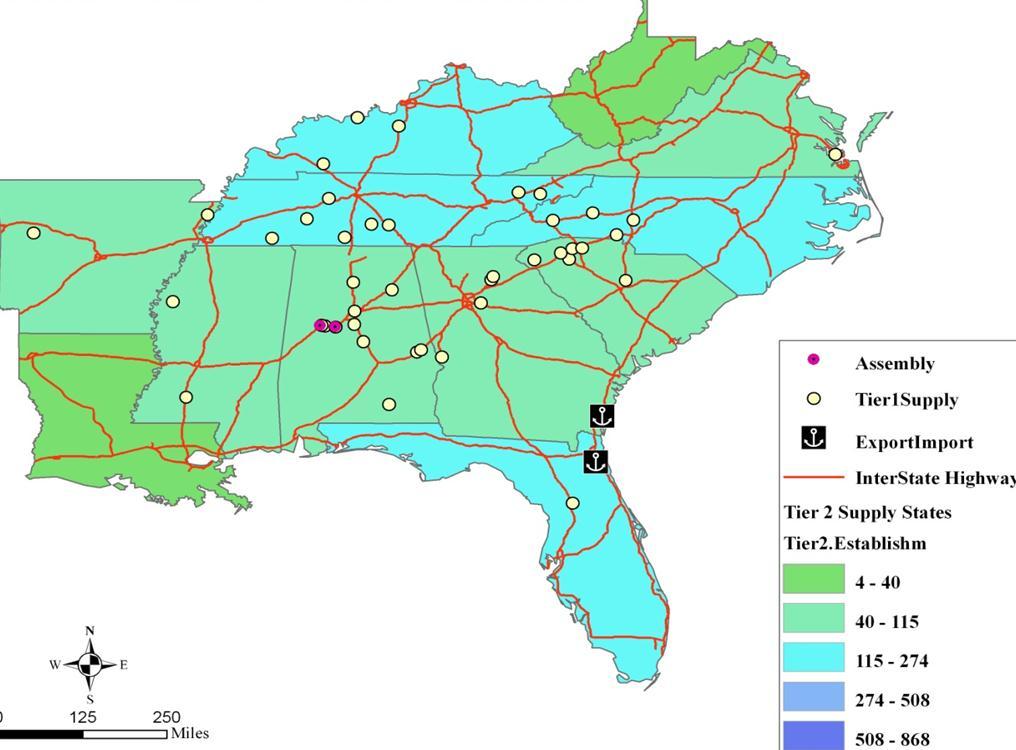
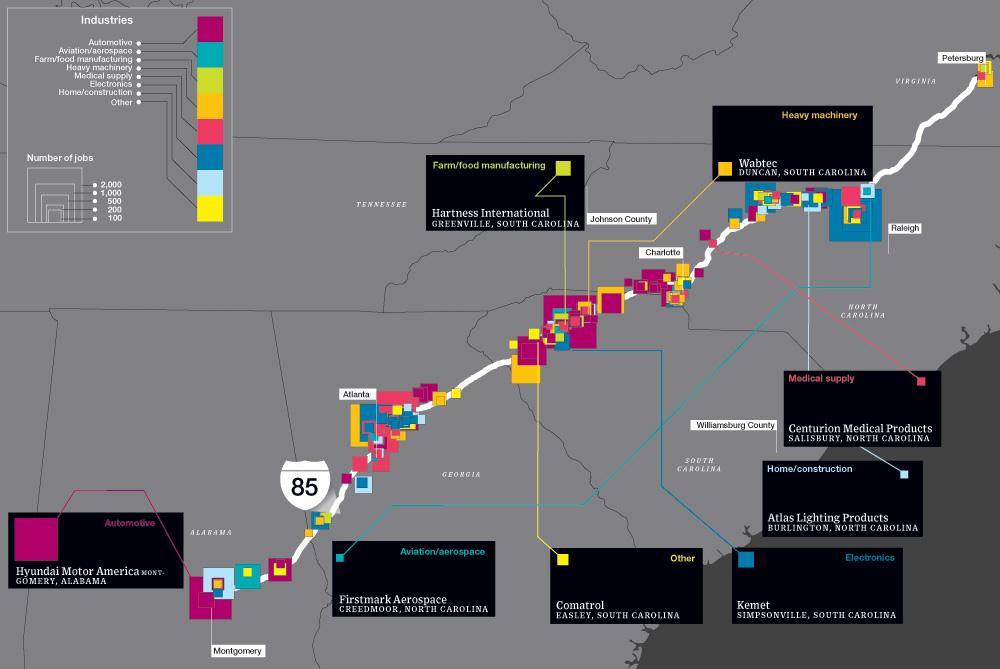
20 Corridor Connectivity Matters
21 What is a Corridor? Different terms: Trade or traffic lane or route May have few or many access points Can be multimodal Will be multijurisdictional Mixed users on corridor Connectivity and access are critical

22 The Job Creation /Logistics Message
23
24

25 Trends in Economic Development Greenfield-Brownfield development Global-nested hierarchies Operational considerations Integrated Logistic Supply Chain Centers Rail Access
26 Corridors will be more important in the future Panama Canal Expansion Intermodal/ inland ports developments Emphasis on Economic Growth Poles/Clusters Emergence of National Logistics Hubs Carbon footprint and Sustainability Transparency and Security
27 Future and Regionalization
28 Changes in Global Markets - Other Trends China Insourcing Near Sourcing to Latin America Future of dollar for exports Port development issues Panama Canal expansion Free Trade negotiations Security risks and asymmetric disruptions Price of fuel Greening
29 Changes in Domestic Market New Energy Plays Price of Fuel Housing Stocks and Consumer Credit Automobiles Workforce Issues Skills, Availability Changing 3PL/4PL Integration Transportation Operations/Regulations
30 The Southern Advantage (2003) Joe Hollingsworth, Jr. 1. The South becomes even more competitive in the world economy 2. South shifts from manufacturing to service sector which improves manufacturing 3. Migration continues as the South becomes land of opportunity 4. South develops knowledge based economy 5. South leads way in education reform 6. Contiguous counties around major metropolitan areas will be the action in the south 7. South becomes practically the only location for automotive plants
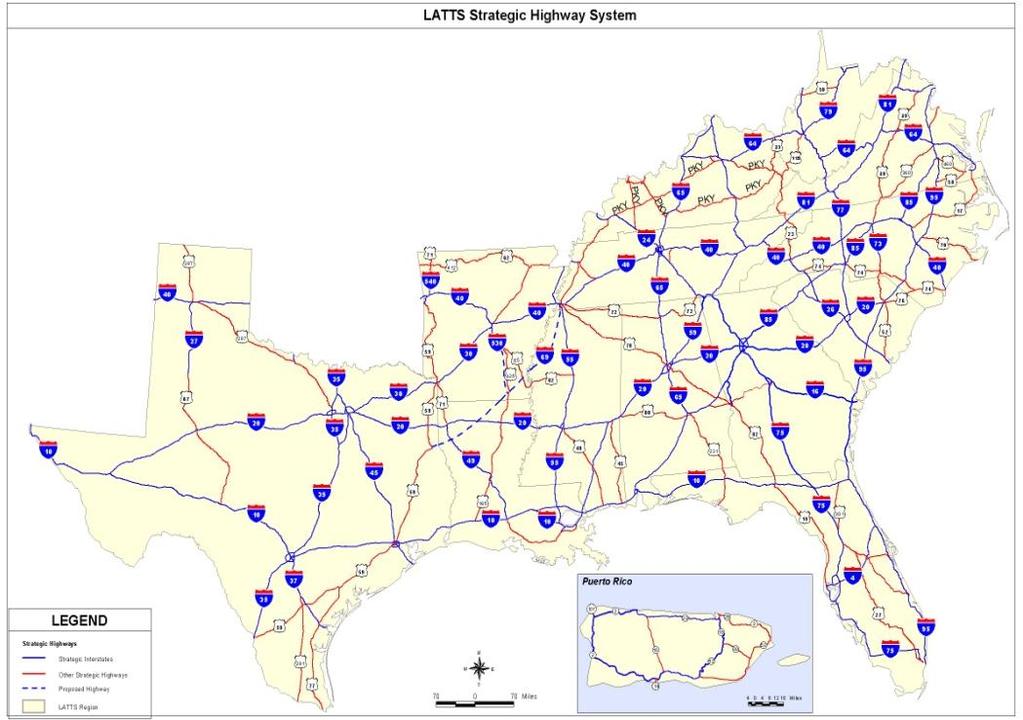
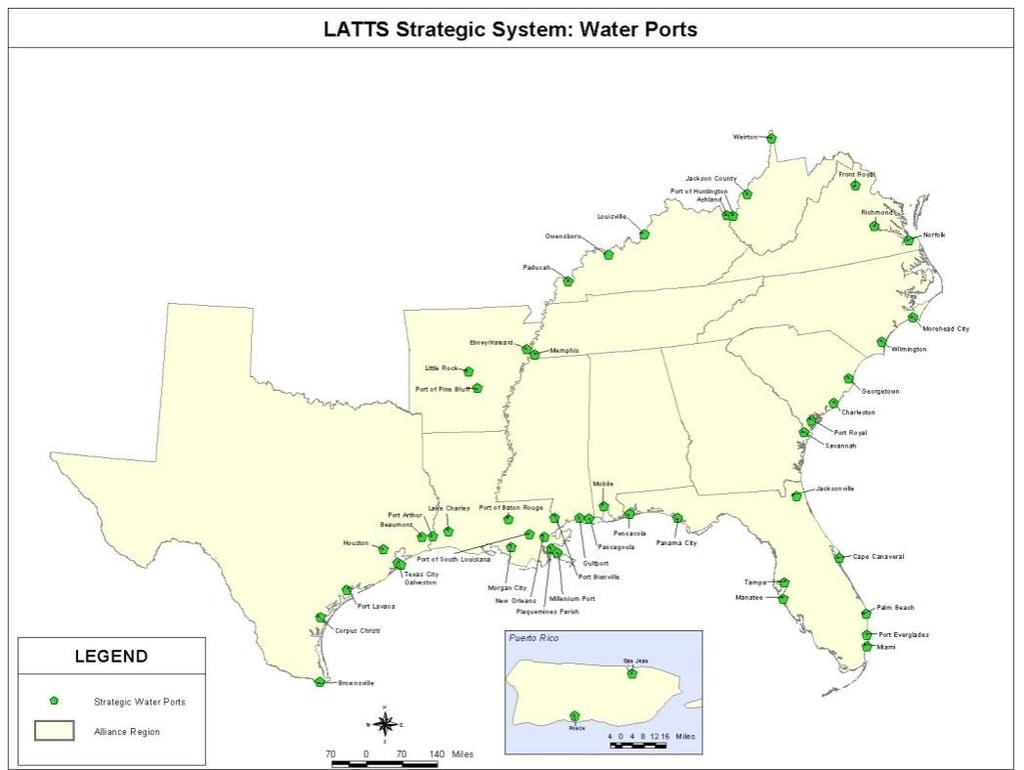
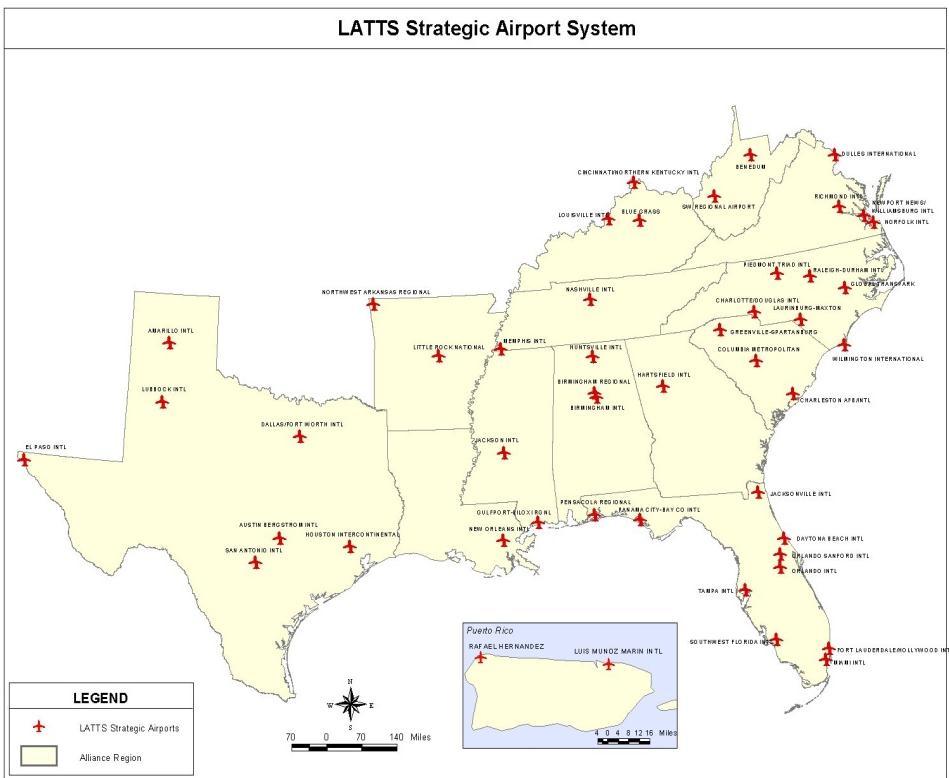
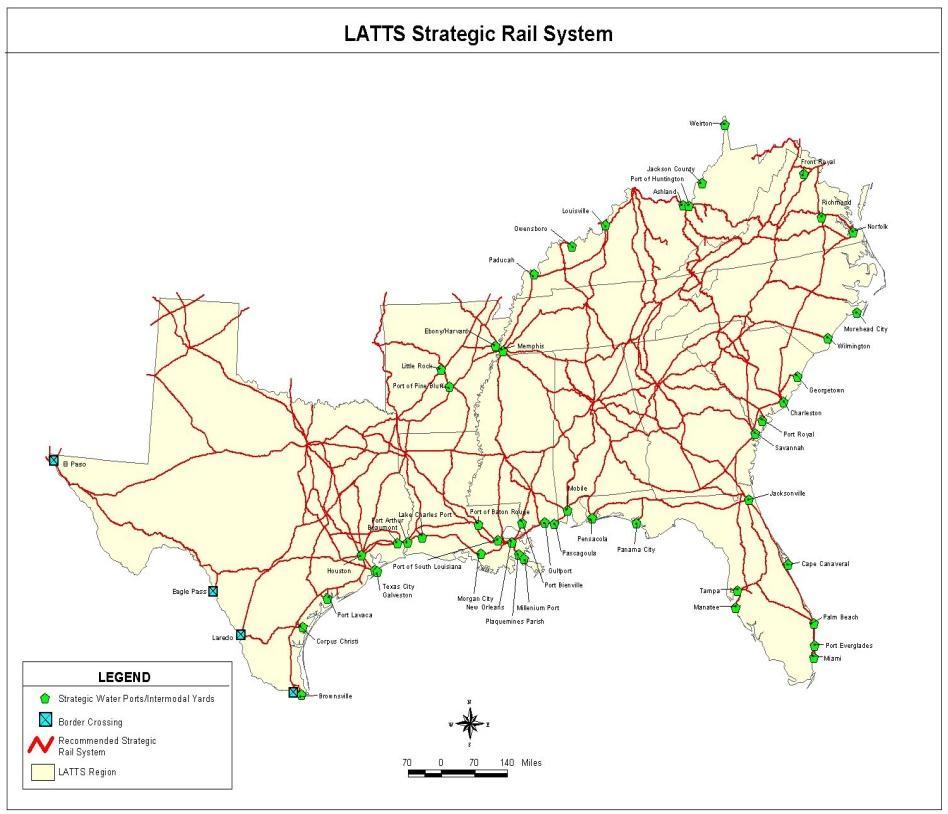
31 Southeast-Leader in Regional I-10 Corridor LATTS I+II I-95 I-81 Thinking Heartland Intermodal Corridor ARC, DRA, Related Regional Groups doing freight studies
32

33 Identified Needs Related to Changing Demand


34 Where is the National Priority?

35 Where do we go from here
36 South Carolina s Response
37 How Do We Shape the Future Business Needs Operations Infrastructure Sustainable New Plants Policy Goals Education Business Climate Today 10 years 20 Years Out


38 Who Are the Players? Private Shippers Carriers Economic Developers Public State Local Federal

39 Public Sector Private Sector Who is Responsible for What? Terminal Operations Cargo Density Business Clusters Transportation services Intermediaries Transportation Utilities Workforce Development Business Climate Incentives

40 What Will We Build/Operate? What is your market? What type of facility/services are needed? Develop densities and services Service Requirements Drayage and equipment issues Domestic and international Shippers bear what costs?

41 If I gave South Carolina one dollar What would the State buy?
42 The Problem- Linking Transportation to Actions Funding has not kept pace with need Flexibility to develop and maintain freight Corridors Conflicting national policies may limit State s economic competiveness Congestion costs South Carolina $$
 Corridors Federal, State Finding partners But who is")
43 The Discussion is Important Connecting with global markets Regional transportation needs Economic Development (land use/access) Corridors Federal, State Finding partners But who is listening?


44 Can Freight Compete Against Complete Streets? See any trucks, railcars, barges or planes?

45 Freight Access and Mobility May Create Transformative Opportunities
46 Some Considerations What do WE want Relinking Transportation to industrial development Perception of value of capital stock Economic development = jobs What must WE balance Everyone more engaged in parts of the debate System s use not fully understood Others Have It syndrome Scale and Densities Aging Infrastructure vs. Capacity Manage Expectations

47 Help With the Engagement
48