Key Issues and Consideration in Market Design, Operational and Oversight
|
|
|
- Ernest Hunt
- 5 years ago
- Views:
Transcription


1 Key Issues and Consideration in Market Design, Operational and Oversight Patrick Donlon Amanda Gordon Kathryn Sophy Kenneth Villwock Public Utilities Commission of Ohio & Pennsylvania Public Utilities Commission December 10, 2014
2 PJM RTO Functions Grid Operation Non-discriminatory treatment Monitoring transmission system Reliability of the system Generation and load balance responsibilities Market Operation Capacity Energy Ancillary Services Regional Transmission Expansion Planning Reliability Economic 2

3 The PJM RTO Footprint 3


4 Transmission Owner Zones
5 PJM Data 185,600 MW - Generating Capacity 158,448 MW - Peak Load Over 65,000 Miles of Transmission Lines PJM Footprint 13 States & the District of Columbia Over 60 million People in its Footprint One Balancing Authority for Dispatch

6 PJM Dispatching Center
7 RTO vs. Local Utility Regional Transmission Organization Local Utility Operation of transmission assets Maintenance scheduling and coordination Match load and generation Non-profit Owns assets Performs maintenance Directly serves end use customers Publicly traded company 7
8 PJM RTO ADMINISTERED MARKET CONSTRUCTS Capacity & Energy
9 Capacity vs. Energy Capacity A resource commitment (in MW) to provide energy in the day-ahead market, and at anytime the resource is called by PJM. Capacity revenues paid to a committed resource whether or not energy is produced by that resource Participation in Reliability Pricing Model (RPM) Base Residual Auction Daily product, but committed for an entire delivery year (June 1 to May 31 of the following year) Energy Generation of electrical power (in MW-hour) Energy revenues paid to resource based on how much clears in Day-Ahead & Real-Time (balancing) markets Hourly product 9
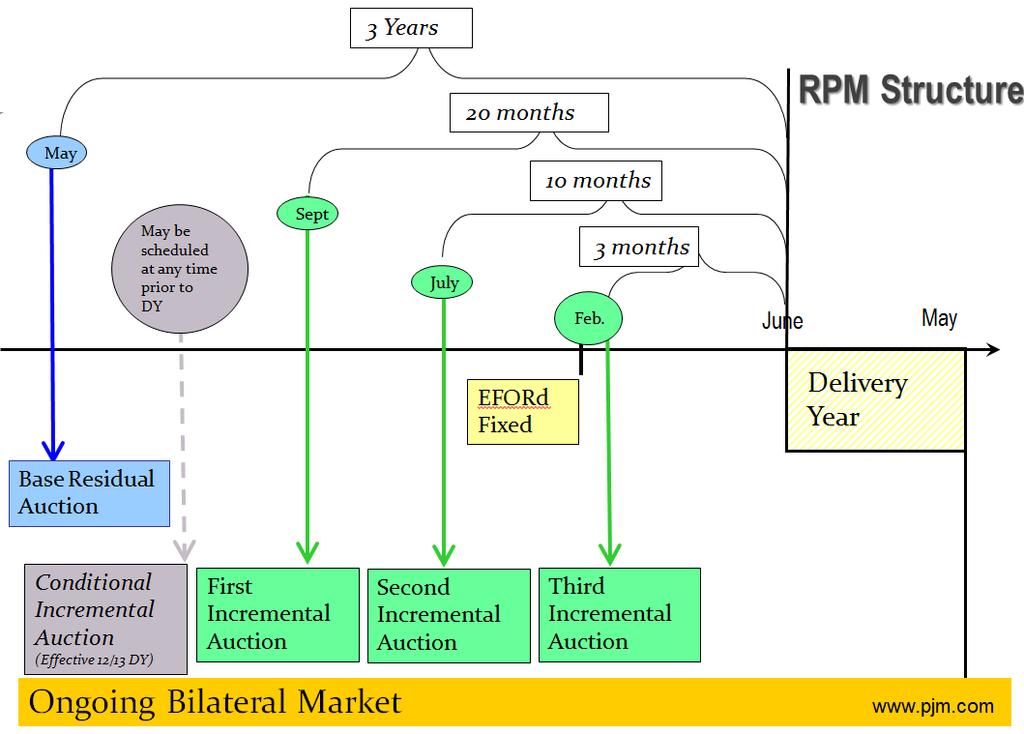
10 Wholesale Capacity Market Reliability Pricing Model (RPM) Bid-Based Auction Process Annually procured product A three-year ahead resource commitment Capacity bids include Generation Resource Demand Response Energy Efficiency Transparency of information 10
11

12 RPM Auctions
13 Resource Adequacy Requirement The amount of capacity resources required to serve the three-year forward forecasted peak load is determined given a specified reliability objective The reliability objective is determined using a Loss of Load Expectation (LOLE) probability event of one day in ten years The Installed Reserve Margin (IRM) associated with this reliability objective is in the range of 15.2% to 15.9% Resource Adequacy Requirement = Forecast Peak Load * (1+ IRM) 13
14 Illustrative Example of a VRR Curve Price = UCAP Price ($/MW-day) 1.5 Net Cone Net Cone 0.2 Net Cone (a) Quantity = UCAP MW Effective 12/13 DY: Target Level = Reliability Requirement Short Term Resource Procurement Target (b) (c) (IRM 3%) (IRM + 1%) (IRM + 5%) IRM A VRR Curve is defined for the PJM Region. Individual VRR Curves are defined for each Constrained LDA.
15 Clearing 2012/2013 Base Residual Auction Clearing determined by the intersection of the supply and the demand curves.
16 Forward Capacity Clearing Prices /2008 to 2016/2017 Delivery Years
17 Wholesale Energy Market Day Ahead Hour Ahead Bid-Based Security Constrained Dispatch of all Generating Plants in the Footprint 17
18 Security Constrained Economic Dispatch Ensure sufficient generation is available to satisfy the demand at any hour of the day Monitor, operate and control the high voltage transmission system in a reliable manner 18
19 Locational Marginal Pricing (LMP) Cost of dispatching the next MW of load at a given location Lowest production cost of generation available Recognizes physical transmission limitations Physical flow, not contract path Generation Marginal Cost for the system + Transmission Congestion Cost + Cost of Marginal Losses = LMP 19
20 Generation Cost System-wide price Optimal dispatch Curve (no congestion or losses taken into account) Intersection of the Supply and Demand Curves Day ahead and real time calculations 20
21 PJM Dispatch Curve by Fuel Type: 10/06/11 21
22 Transmission Congestion Price Price of congestion (transmission constraint) taken into account, calculated using the cost of the marginal unit in the congested region No constraints => $0.00 cost assigned to congestion Day ahead and real time calculations 22
23 Transmission Losses Price of marginal losses taken into account Location by location basis, calculated using penalty factors Distance Voltage Thermal rating Day-ahead and real-time calculations 23
24 Two Settlement Markets Forward markets for electric energy in PJM Day-ahead Market Financial market using Bid-In Load Prices calculated hourly Settlements made hourly Real-time Market Physical Market based on actual system conditions Prices calculated every 5 minutes Hourly settlements based on deviations from Day-Ahead position 24

25 PJM Load Forecast 11/26/14 at 1:43PM 25

26 PJM LMP Pricing 11/26/14 at 1:43PM 26

27 PJM LMP Pricing Day Ahead 11/26/14 at 1:43PM 27

28 PJM LMP Pricing Real Time 11/26/14 at 1:43PM 28
29 Ancillary Services Regulation Market: balancing load and generation Synchronized and non-synchronized Reserve Market: bringing balance back between load and generation after loss of generation Black Start Service: providing generation resources to energize the grid from a complete blackout Reactive Supply: providing voltage stability Scheduling, System Control & Dispatch: PJM s operating expenses per Schedule 9 of the tariff Regulation and reserve markets are market-based and are co-optimized Black start, reactive supply, and scheduling are all cost-based and approved by FERC 29
30 Regulation Market Resources must be respond to an automated signal from PJM Resources must respond within 5 minutes to correct for small load changes to get power system back in balance (Area Control Error ACE) Resources compensated based on their performance (marketbased compensation) Generators, Demand Response, or Energy Storage Regulation Requirement in PJM - 0.7% of peak All load serving entities have an hourly obligation based on a load ratio share; a load can use its own resources, contract with a resource, or buy in the market. 30
31 Reserve Market Reserves are an additional capacity required above the anticipated peak load Sync (already on-line)or non-sync (off-line) To maintain reliability in case of a loss of a generating unit or to correct for a forecast error Primary (respond within 10 minutes) and secondary (within 30 minutes) Reserve Requirement in PJM 150% of the largest contingency All load serving entities have an obligation based on a load ratio share; a load can use its own resources, contract with a resource, or buy in the market. 31
32 Reactive Supply Maintain voltage within reliability limits Cost-based approved by FERC PJM bills for reactive supply by transmission zone Revenues are allocated to generation resources and transmission owners. All transmission customers pay for that service 32
33 Blackstart A generation unit that can independently start and synchronize to the grid w/o any source of electricity following a complete blackout in the Eastern Interconnection These units are distributed across all PJM transmission zones These units would provide power to the non-blackstart units Cost-based approved by FERC PJM and the transmission owners select the critical blackstart units All transmission customers pay for that service 33
34 Scheduling, System Control, and Dispatch PJM s operating budget for generation dispatching, overseeing the reliability of the grid, and administering the energy, capacity and ancillary services markets Cost-based and is billed to all transmission customers (about $0.36 to $0.38/mwh) 34
35 THANK YOU!