Quadra Commodities. Anthony Diamante Director and Chartering Manager
|
|
|
- Poppy Margery Park
- 5 years ago
- Views:
Transcription
1 Quadra Commodities Anthony Diamante Director and Chartering Manager Trends in the Dry Bulk Ocean freight market and freight market outlook IAOM Capetown December
2 2014 in review weaker than expected vessel earnings despite record rises in iron ore, grain and steel products trade plus slower fleet supply growth but reduced coal imports by China and Europe limited offset for lost Indonesian mineral ores lower port congestion in key coal, grain and iron ore ports lifts dry bulk fleet efficiency 4-year low for bunker prices blunts impact of higher TC earnings on voyage rates declining market expectations for 2015
3 $/day Baltic exchange index average timecharter rates Jan-10 Mar-10 May-10 Jul-10 Sep-10 Nov-10 Jan-11 Mar-11 May-11 Jul-11 Sep-11 Nov-11 Jan-12 Mar-12 May-12 Jul-12 Sep-12 Nov-12 Jan-13 Mar-13 May-13 Jul-13 Sep-13 Nov-13 Jan-14 Mar-14 May-14 Jul-14 Sep-14 Nov-14 65,000 60,000 55,000 50,000 45,000 Cape 172kdwt Panamax 74kdwt Supramax 52kdwt Handysize 28kdwt 40,000 35,000 30,000 25,000 20,000 15,000 10,000 5,
4 1q10 2q10 3q10 4q10 1q11 2q11 3q11 4q11 1q12 2q12 3q12 4q12 1q13 2q13 3q13 4q13 1q14 2q14 3q14 4q14 Million tonnes Major dry bulk exports by quarter: new records achieved in 2H
5 Jan 09 Apr 09 Jul 09 Oct 09 Jan 10 Apr 10 Jul 10 Oct 10 Jan 11 Apr 11 Jul 11 Oct 11 Jan 12 Apr 12 Jul 12 Oct 12 Jan 13 Apr 13 Jul 13 Oct 13 Jan 14 Apr 14 Jul 14 Oct 14 '000 tonnes but rate of growth restricted by lower Chinese coal imports 40,000 35,000 includes lignite 30,000 25,000 20,000 15,000 10,000 5,
6 1q08 2q08 3q08 4q08 1q09 2q09 3q09 4q09 1q10 2q10 3q10 4q10 1q11 2q11 3q11 4q11 1q12 2q12 3q12 4q12 1q13 2q13 3q13 4q13 1q14 2q14 3q14 4q14f Mdwt Quarterly dry bulk carrier deliveries by size Capesize Panamax Handymax Handy

7 2014 ytd net fleet change 7
8 $/day Panamax spot earnings and FFA prices 35,000 30,000 25,000 Actual 4 TCs FFA (March 2014) Actual 4 TCs FFA (17 Nov 2014) 1 Year Period (Pacific) 20,000 15,000 10,000 5,000 0 Jul-16 Jan-16 Jul-15 Jan-15 Jul-14 Jan-14 Jul-13 Jan-13 Jul-12 Jan-12 Jul-11 Jan-11 Jul-10 Jan-10 8

9 Avg dry bulk carrier spot market earnings and FFA prices 9
10 Freight market outlook panamax newbuilding deliveries set to moderate in 2015/16 and further demolition potential but increased competition for grain cargoes from rising fleet of ultramaxes likely to make panamaxes even more dependent on coal where India appears set for further strong growth in imports, but anti-pollution measures (and import taxes) expected to restrict upside for Chinese import demand minor bulk trade growth reliant on increased cargo availability, as well as end-user demand 10
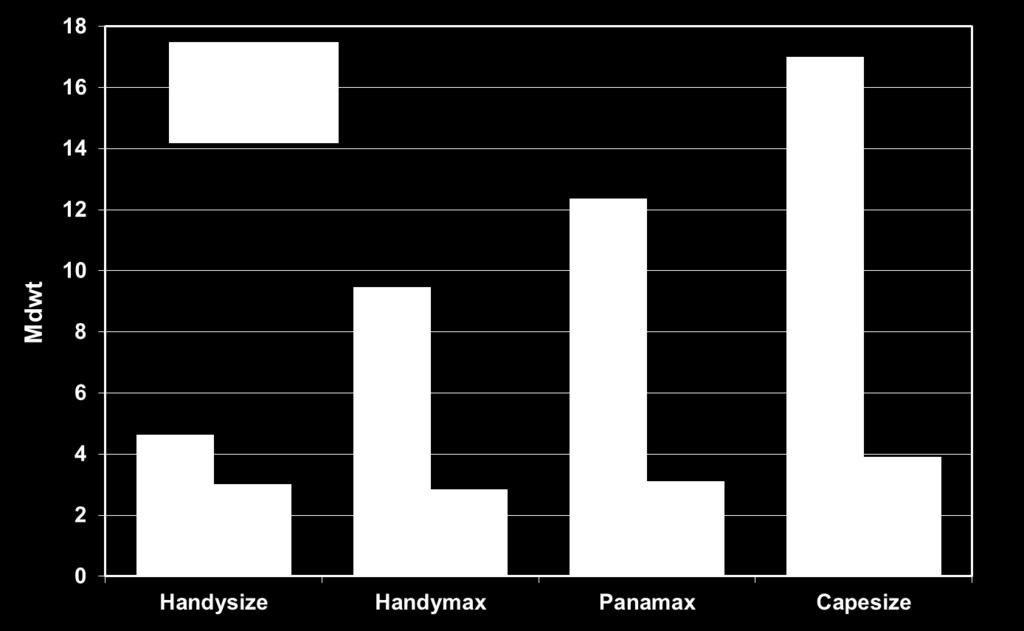
11 pre Mdwt Panamax fleet , , , , , ,999 11
12 Mdwt Handymax and supramax fleet , , , , ,

13 Projected net fleet change in
14 (f) Annual chg million tonnes % annual chg (GDP) World gdp and dry bulk trade growth Annual Chg Total Seaborne Dry Bulk Trade GDP growth Sources:SSY, IMF


15 Conclusions 15
16 Thank You Data kindly supplied by SSY Research 16
17 Dry cargo bulk demand (Mt) DRY BULK SEABORNE TRADE - Major commodities Grain (incl Soyabeans) (Average growth f: + 7.2%) Thermal Coal Coking Coal Iron Ore (Average growth %) (* - Forecast - BRS) 17

 Cement & Clinker Raw Sugar Phos.")
18 Minor Commodities (Mt) DRY BULK SEABORNE TRADE - Minor commodities Grain Soya Beans Steel Products & Scrap Forest Products Baux./Alum. Fertilizer (excl. Phos Rock) Cement & Clinker Raw Sugar Phos. Rock (* - Forecast - BRS) 18
19 Ocean freight dry bulk market US$/day 100,000 90,000 80,000 70,000 60,000 DRY BULK CARRIERS - SHORT T/C AVERAGE (Average Baltic Exchange T/C routes) Capesize T/C Average Panamax T/C Average Supramax T/C Average Handysize T/C Average 50,000 40,000 30,000 20,000 10,000-19

20 Ship ordering frenzy... Million dwt HANDYSIZE New Orders For Bulk Carriers since SUPRAMAX PANAMAX CAPESIZE * (* at 17 Nov 2014) 20
21 2008 correction the missed opportunity. US$/day DRY BULK CARRIERS - SHORT T/C AVERAGE (Average Baltic Exchange T/C routes) 100,000 90,000 80,000 70,000 60,000 Capesize T/C Average Panamax T/C Average Supramax T/C Average Handysize T/C Average 50,000 40,000 30,000 20,000 10,000-21
22 New vessel supply in numbers 22