FHWA Pavement Surface Characteristics Program And Research Update
|
|
|
- Esther Ramsey
- 5 years ago
- Views:
Transcription
1 Focus Area Leadership and Coordination (FALCON) FHWA FHWA Pavement Surface Characteristics Program And Research Update Southeastern States Pavement Management and Design Conference May 11, 2009 Robert Orthmeyer
2 Focus Area Leadership and Coordination (FALCON) FHWA Focus Area Leadership and Coordination (FALCON) Teams 1. Pavement Design & Analysis 2. Materials & Construction Technology 3. Pavement Management & Preservation 4. Pavement Surface Characteristics 5. Construction Quality Assurance 6. Environmental Stewardship


3 Focus Area Leadership and Coordination (FALCON) FHWA FALCON Team 4 Pavement Surface Characteristics Where the public meets the road Co-Chairs: Larry Wiser Bob Orthmeyer Secretary: Joe Gregory
4 Focus Area Purpose/Scope Strategic Plan Vision: Safe, smooth, and quiet pavements. Mission To provide insight and applications that assist FHWA leadership in assuring that pavement surfaces meet and/or exceed our client s expectations. Scope The SC FALCON Team will provide a multi-year strategic plan that coordinates the activities within FHWA that are concentrated in delivering an effective pavement surface characteristics program.
5 FHWA Strategic Plan National Performance Objectives 4.1 Smoothness Pavements are designed, constructed and maintained to meet users expectations relative to ride quality. 4.2 Friction Pavements are designed, constructed and maintained to reduce friction-related crashes. 4.3 Noise Highway agencies use quiet pavement systems in noise-sensitive areas. 4.4 Splash and Spray Pavements are designed, constructed and maintained to reduce the potential for splash and spray.
6 Performance Measures Strategic Plan 4.1 Smoothness Good Ride Quality Percent of VMT on NHS with IRI less than 95 in/mi. - From HPMS Acceptable Ride Quality Percent of VMT on NHS with IRI less than 170 in/mi. - From HPMS
7 2007 Pavement Condition on the National Highway System (NHS) National Average = 56.7%, Target 57% in 2009 Good/Very Good (IRI of <95 /mile) > National Average > 1-10% below National Average > 10% below National Average 37.4% CA 70.5% OR 59.6% WA 65.9% NV 64.7% ID 53.5% UT 80.8% MT 66.8% WY 81.9% AZ 83.7% NM 45.5% CO 65.5% ND 62.0% SD 50.1% NE 79.6% KS 59.4% OK 57.0% MN 48.2% IA 73.2% MO 61.9% AR 48.6% WI 33.4% IL 62.5% IN 45.0% MI 84.1% TN 68.5% KY 76.5% OH 52.0% PA 69.4% WV 56.7% VA 67.8% SC 74.5% VT 57.7% NC 35.0% NY 69.1% NH 69.9% MD 66.2% ME 20.6% NJ 0.0% DC 74.2% MA 55.2% DE 51.0% RI 46.9% CT 43.6% TX 46.2% LA 59.9% MS 82.1% AL 94.2% GA 92.0% FL 53.1% AK 14.3% HI 3.1% PR Source: HPMS Compiled By: Office of Pavement Technology Federal Highway Administration March 2008

8 Performance Measures Strategic Plan 4.2 Friction Friction Improvement Consideration Factor Extent to which highway agencies consider friction in the pavement design, construction, management, and maintenance processes. - Rating by agency (self assessment) - Number of Agencies Friction Related Crash Rate Friction-related crash rate (related to wet-weather and pavement). - Number of agencies - Extent of National Highway Network

9 Performance Measures Strategic Plan 4.3 Noise Quiet Pavement System Consideration Factor Extent to which highway agencies consider quiet pavement systems in the pavement design, construction, management, and maintenance processes for noise-sensitive areas. Quiet pavement systems (initially defined by states in the self-assessments) Noise-sensitive areas (defined by states in the self-assessments)

10 Performance Measures Strategic Plan 4.4 Splash and Spray Splash/Spray Consideration Factor Extent to which highway agencies consider splash and spray in the pavement design, construction, management, and maintenance processes. - Rating by agency (self assessment) - Number of Agencies Rutting Condition Average rutting depth per sample unit. - From HPMS
11 National Strategies Strategic Plan Develop, promote, and deploy assessment capabilities and technologies to improve highway systems. Demonstrate the benefits of using pavement surface characteristics as a highway system performance indicator. Develop and implement policy guidance to align with quality assurance, environmental policy, and safety policy. Develop a national management program.
12 FY 2009 Program Funded FY09 Activities AASHTO Smoothness Standards Refinement/Deployment Advanced Texture/High Friction Demonstration Project Friction/Texture Test Equipment Loan Program Sound Intensity Test Method Refinement/Validation
13 FY 2009 Program FY09 Activities (continued) Integrated Texture-Noise Model Development Traffic Noise Model (TNM) Pavement Effects Project ProVAL Deployment and Enhancement Splash/Spray Potential Assessment Tool Development
14 FY 2009 Program FY09 Activities (continued) Relationship between Pavement Surface Characteristics & Vehicle Crash Rates on US Highways Pavement Surface Characteristics Relationship to Crashes Overview Relating Ride Quality And Structural Adequacy For Pavements
15 FY 2009 Program FY09 Activities (continued) Profiler calibration, regional verification testing and operator certification Development of Investigatory & Intervention Threshold Values for Friction & Macrotexture
16 FALCON Coordination TPF 5(063) Improving the Quality of Pavement Profiler Measurement TPF 5(135) Tire/Pavement Noise Research Consortium TPF 5(139) PCC Surface Characteristics: Tire -Pavement Noise Program Part 3 - Innovative Solutions /Current Practices TPF 5(141) Pavement Surface Properties Consortium: A Research Program
17 TPF 5(063) Pooled Fund Study Improving the Quality of Pavement Profiler Measurement 21 State Highway Agencies $1.4 Million Study Extended through September 2011 Priorities include develop reference device Benchmark testing of device in June 2009
18 TPF 5(063) Priorities Build a reference device Define requirements for reference Profile Viewer and Analysis Software Regional certification sites Limits of a single accelerometer Emerging technologies

19 TPF 5(063) Pooled Fund Participating Agencies

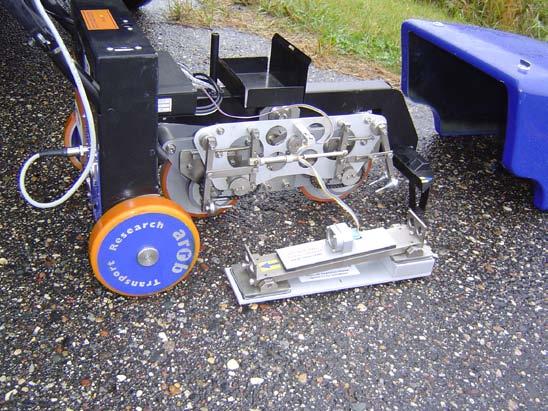
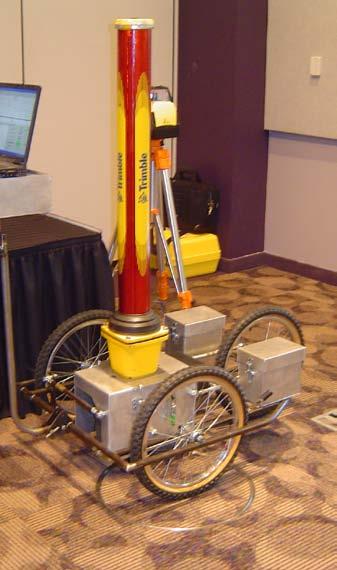
20 Potential Reference Devices
21 FHWA Toolkit Smoothness ProVAL software & workshops ( NHI Pavement Smoothness Contract to implement AASHTO Provisional Standard PP49 & MP17 ASTM E : Standard Specification for Data Format for Pavement Profile
22 ProVAL 3.0 The Graphical User Interface (GUI) of ProVAL 3.0 is completely redesigned ProVAL 3.0 is very intuitive and easy-touse ProVAL 3.0 includes a lot of powerful new features It takes the profile viewing and analysis experiences to the next level

23 Files import and profiles selection Powerful viewing options Manage profile data using thumb nails Easy access of analyses

24 Powerful chart controls Better Input settings management Grinding strategy management Better reports and charting
25 Features ProVAL 2.7 ProVAL File and Project Management Separated project analysis file (*.pv2) and imported data files (*.ppf) are used to store analysis settings and profile data, respectively. An all-in-one single compressed file (*.pv3) is used to combine all imported profile data and analysis settings while imported data can be exported. 2 Sections Handling The features of point reset and/or cropping tools facilities are used to define and handle a single section of interest. Can only use lead-in and lead-out to define one section of interest. Sections facility in the Editor can be used to define multiple sections of various categories (e.g. generic, exclusions). Therefore, lead-in and lead-outs can be handled more gracefully. 3 Ride Statistics Separated modules are used for Ride Stats, Ride Stats at Interval, and Ride Stats Continuous analyses. A limit of one file to be analyzed is imposed in the latter two analysis modules. A single Ride Quality module is used to provide all three types of ride quality analyses. Also, multiple files are allowed to be analyzed for all three analysis types. 4 Input Settings Input set is used to handle input settings. An improved analysis template is used to manage input settings. 5 File selection Users need to manually select files for analysis. Only limited numbers of files are allowed. A file selector facility is used to speed up files and profiles selection. No limitation on number of file selections! 6 Milepost Display Mileposts can only be in increasing manner. Allow display of profile charts in terms of mileposts and in proper increasing or decreasing manner. 7 Charts Limited functions for chart controls. No charts for fixed interval reports and histograms. Now all charts come with zooming, scrolling, panning, and zoom history support. Charts also are added for fixed interval reports and histograms. Grinding charts are added to highlight grinding locations. 8 Report Save reports in HTML format. Generate reports in secured PDF format.

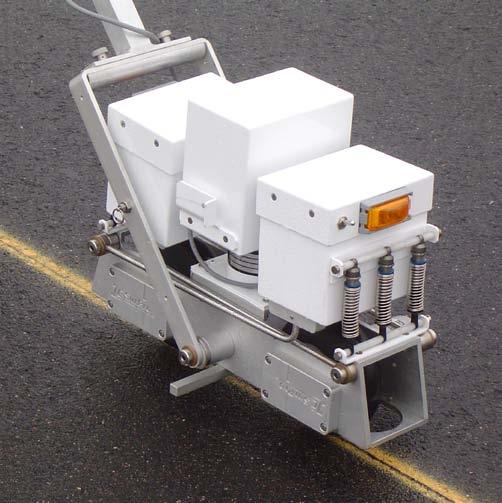
26 Inertial Profiler Changes

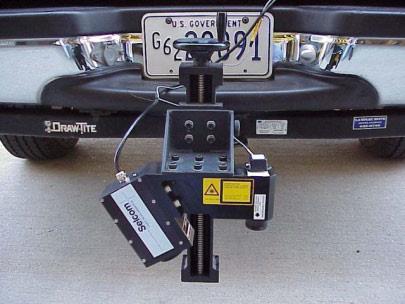
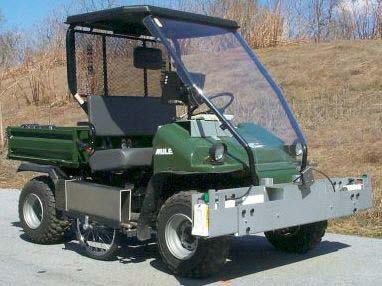
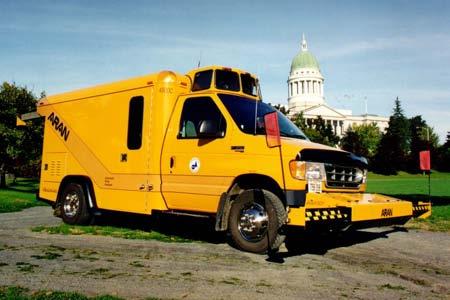
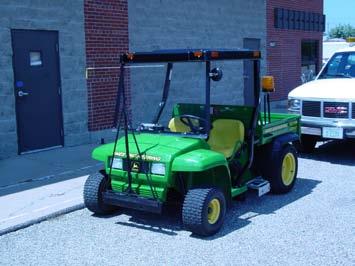
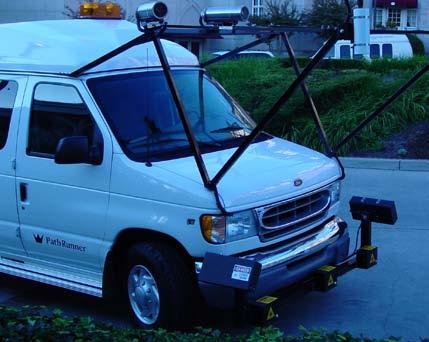
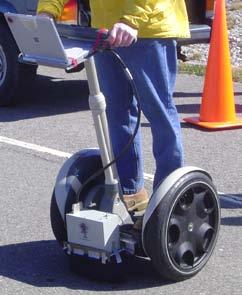
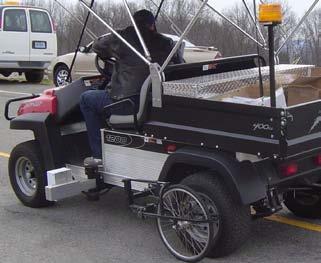
27 Inertial Profiler


")
28 Questions? Robert Orthmeyer FHWA Office of Technical Services Resource Center, P&M TST (708)