ASSET MANAGEMENT PLAN
|
|
|
- Simon Bell
- 5 years ago
- Views:
Transcription

1 ASSET MANAGEMENT PLAN
2 Contents 1 EXECUTIVE SUMMARY OVERVIEW AND PLAN PURPOSE CORPORATE OBJECTIVES AND ASSET MANAGEMENT DRIVERS STATUS OF PROGRAMMES AND PROJECTS ASSET MANAGEMENT SYSTEMS AND INFORMATION NETWORK CONFIGURATION AND ASSET DESCRIPTION SERVICE LEVEL OBJECTIVES ASSET MAINTENANCE AND RENEWALS PLAN NETWORK DEVELOPMENT PLANS RISK MANAGEMENT PERFORMANCE GAP ANALYSIS AND IMPROVEMENT PLANS BACKGROUND AND OBJECTIVES ASSET MANAGEMENT PLAN PURPOSE CORPORATE OBJECTIVES ASSET MANAGEMENT PLANNING DRIVERS PLANNING PERIOD AND REVIEW PERIODS STAKEHOLDERS ACCOUNTABILITIES AND RESPONSIBILITIES AMP INTERACTION WITH CORPORATE GOALS AND BUSINESS PLANNING ASSET MANAGEMENT INFORMATION SYSTEMS INFORMATION SYSTEMS GAP ANALYSIS: ASSET MANAGEMENT PLAN FORMULATION AND STRATEGIC REVIEW PROCESS NETWORK CONFIGURATION AND ASSET DESCRIPTION NETWORK CONFIGURATION ASSET JUSTIFICATION AND NETWORK OPTIMISATION ASSET DESCRIPTION NETWORK VALUATION NETWORK PERFORMANCE ASSET PERFORMANCE ASSET EFFECTIVENESS ASSET EFFICIENCY PERFORMANCE OBJECTIVES JUSTIFICATION FOR SERVICE LEVEL TARGETS Network Tasman Asset Management Plan Page 2
3 5 NETWORK DEVELOPMENT PLAN INTRODUCTION NETWORK DEVELOPMENT POLICIES NON ASSET SOLUTION POLICY DISTRIBUTED GENERATION POLICY PLANNING CRITERIA NETWORK SECURITY POLICY SECURITY DESIGN STANDARD DEMAND FORECAST DEVELOPMENT PLAN - DETAIL MAJOR NETWORK DEVELOPMENT PROJECTS 2018/ MAJOR NETWORK DEVELOPMENT PROJECTS 2019/ / ASSET RENEWAL AND MAINTENANCE PLAN PLANNING CRITERIA AND ASSUMPTIONS ASSET RENEWAL AND REFURBISHMENT POLICY ASSET CLASSES ASSET MAINTENANCE AND RENEWAL CATEGORIES ASSET INSPECTION AND CONDITION MONITORING LIFECYCLE ASSET MAINTENANCE AND RENEWAL POLICIES BY ASSET CLASS VEGETATION NON NETWORK ASSETS NON NETWORK ASSET DESCRIPTION NON NETWORK ASSET DEVELOPMENT, MAINTENANCE AND RENEWAL POLICIES NON NETWORK ASSET CAPITAL, MAINTENANCE AND RENEWAL PROJECTS RISK MANAGEMENT OVERVIEW RISK MANAGEMENT STRATEGY RISK MANAGEMENT BACKGROUND NETWORK RISKS CONTEXT RISK BENCHMARKING NETWORK RISK ANALYSIS EARTHQUAKE PERFORMANCE AND RISK RISK MANAGEMENT CONCLUSIONS PERFORMANCE MEASUREMENT, EVALUATION AND IMPROVEMENT FINANCIAL AND PHYSICAL PERFORMANCE SERVICE LEVEL AND ASSET PERFORMANCE Network Tasman Asset Management Plan Page 3
4 9.3 GAP ANALYSIS AND IMPROVEMENT PLANS PLANNING ASSUMPTIONS SIGNIFICANT ASSUMPTIONS FACTORS THAT MAY AFFECT AMP OUTCOMES LIST OF APPENDICES A. NETWORK LAYOUT B. GROWTH PROJECTION C. NETWORK PERFORMANCE STATISTICS D. CAPITAL EXPENDITURE PROJECTION NETWORK DEVELOPMENT & ASSET RENEWAL E. SPECIFIC NETWORK DEVELOPMENT & ASSET RENEWAL PROJECTS F. NETWORK MAINTENANCE AND OPERATIONS EXPENDITURE PROJECTION G. TYPICAL ASSET MAINTENANCE AND RENEWALS ACTIVITIES H. DESIGN NETWORK VOLTAGE REGULATION I. ZONE SUBSTATION RISK ASSESSMENT MATRICES J. FEEDER RELIABILITY ANALYSIS K. CONSUMER SURVEY L. DISASTER READINESS AND RESPONSE PLAN M. PROCEDURES FOR RECORDING OUTAGE INFORMATION FOR REGULATORY DISCLOSURE N. INFORMATION DISCLOSURE SCHEDULES Network Tasman Asset Management Plan Page 4
5 1 EXECUTIVE SUMMARY 1.1 OVERVIEW AND PLAN PURPOSE The Network Tasman Limited (NTL) electricity network distributes power to approx. 40,000 end use consumers in an area of 10,800 sq. km in the northwestern corner of the South Island of New Zealand. The coverage area is shown in the map of Appendix A. The Asset Management Plan (AMP) documents the current asset management practices used by NTL as part of developing an optimised management strategy for its electricity network assets. It outlines the present state of the electrical distribution system and presents a plan for the future maintenance and development of the network. This document is updated annually and will be continually refined. This plan incorporates regulatory reporting requirements in tabular form. The tables provide a standardised presentation of AMP information. These tables are appended to the document in Appendix N. The primary objective of the plan is to provide a systematic approach to the planning of programmes, the implementation of which will ensure that the network assets are being effectively and efficiently maintained, enhanced and developed to satisfy stakeholder requirements. The plan provides information on the implementation of programmes including how the company will organise and resource itself to ensure that the programmes are implemented in a timely and effective manner. The period covered by this plan is for ten years beginning on 1 April 2019 and extending to 31 March The date of this revision of the plan is 31 March This document was approved by the NTL board of directors on 29 March The next review of this plan will be issued on 31 March CORPORATE OBJECTIVES AND ASSET MANAGEMENT DRIVERS NTL is owned by the Network Tasman Trust on behalf of consumers as defined in the Network Tasman Trust Deed. The drivers for the asset management process are derived from the statement of corporate intent of the company. This includes the vision and mission statements of NTL and the key objectives of the company. The key business objectives arising from the vision and mission statements are as follows: To deliver reliable and high quality network services to consumers that are in broad alignment with consumer and/or consumer group expectations of reliability and price as revealed by the consumer consultation process. To improve operational efficiency and effectiveness. To ensure regulatory compliance of the network and operations. To increase consumer value Six asset drivers have been identified which define the scope and need for all asset management work. The drivers are: Safety (of workers, contractors and the general public) Consumer service (provision for adequate capacity and reliability), based on both direct consultations with large customers and use of suitable proxies for estimating the requirements of the mass market. Economic efficiency. Environmental responsibility Regulatory Compliance Network Tasman Asset Management Plan Page 5
6 Risk management The drivers will be both internally and externally set. Development of the network will be condition and performance based. 1.3 STATUS OF PROGRAMMES AND PROJECTS This plan provides a long term indication of asset management requirements. Specific work programmes and projects will be drawn from this plan for inclusion in future annual business plans. Specific projects greater than $100,000 in value are subject to board approval on an individual business case basis. The inclusion of a particular project in this plan does not imply that the project will proceed. The implementation timing of capital projects in this plan is influenced by outturns of growth in particular areas. The advent and development of new technologies such as distributed generation and battery storage may have a significant effect on the implementation and timing of the capital expenditure projects in this plan. Growth in new loads such electric vehicle charging may also have an impact. In this environment, the company is looking to apply new technologies to defer large capital projects where it is practicable and economical to do so. To adjust for the likelihood that only a proportion of projects will proceed, a downwards adjustment has been made to forecast capital expenditure in Appendix D. 1.4 ASSET MANAGEMENT SYSTEMS AND INFORMATION A number of information sub-systems are operated by NTL providing data inputs to the asset management process. These are as follows: Geographic Information System (GIS) Central asset datastore for asset location Substation database Consumer connection database Asset condition survey database Load survey database Outages and Faults databases Outage information and statistics Component failure records Trend analysis Network Loadflow model Network voltage profiles Network configuration and load modelling Fault analysis Customer consultation exercises Direct consultation with large customers Mass market surveys Network Tasman Asset Management Plan Page 6
7 1.5 NETWORK CONFIGURATION AND ASSET DESCRIPTION The plan covers the network assets of NTL which comprise: Subtransmission lines and cables Distribution lines and cables Substations including all plant and equipment within the substation such as transformers, switchgear and SCADA Protection relays and voltage regulators Control centre SCADA master station and associated communications systems Load control facilities The network is divided into five bulk supply regions as indicated in Appendix A. On December , Network Tasman acquired the 66kV subtransmission assets in the northwest of the South Island. These assets include two 66kV overhead lines between Stoke and Golden Bay and three substations at Motueka, Upper Takaka and at Cobb Power Station. These were previously owned and operated as part of the national grid by Transpower NZ Ltd. The basic asset statistics of the Network Tasman network are summarised in the following table: Network Tasman Distribution System No Subtransmission Substations 2 Zone Substations 13 Ripple Injection Transmitters 5 66kV + 33kV Networks (km) kV + 11kV + 6.6kV Networks (km) 2, V Networks (km) 1,144 Distribution Substations 4,537 Overall Peak Load (System Demand for supply to consumer ICPs) 125 Annual Energy Delivered (MWh for supply to consumer ICPs) 674,000 Annual System Load Factor 62.0% The location of the assets is broadly indicated in the network layout maps of Appendix A. These maps show the location of the HV distribution throughout the area. The asset management plan does not cover non-network assets such as non-network related land and buildings, motor vehicles or furniture. 1.6 SERVICE LEVEL OBJECTIVES Reliability targets have been reviewed following analysis of historical fault data, network studies and visits to other similar networks. The resulting targets represent achievable outcomes for networks of the nature of the NTL network. In the 2019 review, cognisance of the ten year copper conductor replacement programme has been made and this has led to an increase in the planned SAIDI and SAIFI targets of 25 and 0.16 respectively. This takes the planned SAIDI target to 100 points and the SAIFI target to 0.7 for the next ten years. Service level targets are in line with and justified by consumer consultation. Recent consumer consultation undertaken consisted of: Direct and detailed consultation with the approx. 30 largest consumers. Assessment of mass market satisfaction via mass market survey and consultation with consumer groups. Network Tasman Asset Management Plan Page 7
8 Asset performance targets in terms of SAIDI and SAIFI for the period of the plan are as follows: SAIDI Transpower Planned Transpower Unplanned Total Transpower NTL Planned NTL Unplanned NTL Total Overall SAIDI Actual 2000/ / / / / / / / / / / / / / / / / / Forecast 2018/ Target 2018/ / / / / / / / / / SAIFI Transpower Planned Transpower Unplanned Total Transpower NTL Planned NTL Unplanned NTL Total Overall SAIFI Actual 2000/ / / / / / / / / / / / / / / / / / Forecast 2018/ Target 2018/ / / / / / / / / / Network Tasman Asset Management Plan Page 8
9 CAIDI Transpower Planned Transpower Unplanned Total Transpower NTL Planned NTL Unplanned NTL Total Overall CAIDI Actual 2000/ / / / / / / / / / / / / / / / / / Forecast 2018/ Target 2018/ / / / / / / / / / Asset effectiveness targets are as follows: Service Criterion Key Performance Indicator Annual Target 2019/20 to 2028/29 Actual 2017/18 Forecast 2018/19 Supply Quality Number of proven voltage complaints Contractual Breaches of UOSA Performance Environmental Incidents of non-compliant emission from Effectiveness network. Safety Staff and Contractor serious harm incidents Safety Public Injury incidents Safety Public Property damage incidents Safety Incidents with potential for Public Injury Safety Incidents with potential for Public Property damage Network Tasman Asset Management Plan Page 9
10 Asset efficiency targets are as follows: Service Criterion Thermal Efficiency Transformer Utilisation Operating Efficiency Key Performance Indicator Annual Target 2019/20 to 2028/29 Actual 2017/18 Forecast 2018/19 Network Losses 6% 5.8% 6.0% KVA peak demand/distribution transformers 30% 29% 25% Cash operating costs per consumer $301 $291 $ ASSET MAINTENANCE AND RENEWALS PLAN NTL has the view that overhead distribution lines can be operated and maintained on an ongoing basis in perpetuity so that the lines never become unserviceable and they remain in such an overall condition that the probability of failure of any line is held constant. Over the years the network has been maintained to a high standard. When this is combined with the significant renewal that has also taken place in many areas as a result of capital works and new line extensions, the result is that the NTL system is in good overall condition at present. This conclusion is supported by the low rates of faults per line km experienced over the network (long term average approx. 6 per 100km pa). During 2017, Network Tasman commissioned external consultants Mitton-Electronet to undertake an independent review of the condition of the distribution network and of the systems in place at Network Tasman to manage the condition of the network. This review confirmed that the network is generally in good condition. Any deficiencies in the network asset noted by the consultants were already identified and discussed within the current AMP. Some recommendations for further improvement were made by Mitton- Electronet however and these have been considered and incorporated into the AMP. NTL has categorised its asset maintenance activities into two categories for the purposes of reporting and budgetary control. These are: Routine Maintenance ongoing work aimed at maintaining individual component asset function and serviceability rather than enhancing life. Typical activities being - replacing blown fuses, cleaning components, tightening hardware, restraining conductors, etc. Renewals component replacements at or near end of life. The distribution network is 75% overhead by circuit length. The overhead distribution is 95% based on concrete poles that are well manufactured to a conservative design. These poles have shown to have a life in excess of 100 years in the benign Nelson environment. Aside from a small number of poles in relatively short sections of coastal line and in estuaries, and approximately 500 poles that are known to have been poorly made and are now spalling, there are no signs to date that even the oldest poles on the network are reaching end of life. Civil engineers with the assistance of the University of Canterbury have assessed the life of most concrete poles at 150 years. Iron rail poles on the network however are reaching end of life and all will be replaced with concrete poles within the next five years. There are a small number of treated softwood poles dating back to the 1970 s. The oldest of these may be reaching end of life. Condition testing of these will commence within the timeframe of this plan. Crossarms on the network have varying life from 15 to 45 years. The condition of in-service crossarms is assessed individually as timber quality is highly variable even within individually supplied batches of crossarms. Local climatic conditions of aspect and rainfall are also life determining factors for individual crossarms. Crossarm renewal occurs through replacement and this is currently taking place at approximately 1200 replacements per year. Network Tasman Asset Management Plan Page 10
11 Line hardware is mainly of porcelain and galvanised steel that has a very long life in the Nelson environment. Some specific items have identified failure mechanisms (e.g. two-piece dropout fuses and kidney strain insulators) and replacement strategies for these are now being implemented. Overhead line conductor in service is mainly copper, steel reinforced aluminium (ACSR), or all aluminium conductor (AAC). Over recent years the incidence of conductor breakage in light copper conductors appears to have increased. This conductor is reaching the end of its life, being brought about through metallurgic ageing and annealing. A ten-year programme to replace light copper conductors on high voltage lines is included in this plan and this is underway. This programme commenced in the 2017/18 year. No major problems with the aluminium conductors exist except in the west coast section of Golden Bay where corrosive and windy conditions exist. Conductor life is significantly shorter in this area. A conductor replacement project in the area has been recently completed. Galvanised steel conductor installed in the 1940 s and 50 s is still in place on some rural spur lines. This is reaching end of life due to corrosion and is targeted for replacement with ACSR. The underground cables on the network are mainly paper insulated copper or aluminium for high voltage and PVC or XLPE insulated aluminium for low voltage. All cables have been carefully installed in bedding fines and all are operated within prudent loading limits. Testing of local cable bedding materials has revealed lower than previously assumed thermal resistivity. Partial discharge testing of the insulation of 33kV cables has been undertaken in recent years and this procedure is planned to be expanded to include critical 11kV feeder cables in the future. Some loss of mechanical protection of lower capacity HV cables has been recently identified due to corrosion of the outer steel tape armouring, however it is believed that this will not critically degrade the performance of the cables in the short term unless these cables are disturbed. This situation is being monitored, since underground reticulation was commenced in the early 1970 s the oldest cables are now 45 years old. Network Tasman has developed a ten year replacement programme for these cables and this program will commence in 2018/19. The 66kV subtransmission system is based on a combination of hardwood poles, concrete poles and lattice towers. These are all in good condition. The network contains eleven 33/11kV zone substations of capacity ranging from 3MVA to 23MVA, two 66/11kV zone substations, and one 66/33kV subtransmission substation of capacity 20MVA. All are in good condition and are well designed for normally expected electrical and seismological duty. Fire risk at the substations is managed by design. There are twenty NTL owned 33/11kV three phase power transformers, four 66/11kV three phase transformers and one 66/33kV transformer bank in service at these substations. The power transformers range in age from 1 to 61 years. All are monitored by annual dissolved gas analysis test and diagnosis. A programme of insulation testing and winding reclamping of the oldest transformers is underway. Transformers on the network have been conservatively loaded and have not experienced high numbers of through faults. To date all of the five 33/11kV transformers manufactured prior to 1978 have undergone a mid-life refurbishment and are expected to see out a 70 year life. Tapchangers on the two oldest units (cc1959) have been replaced with modern equivalents in conjunction with transformer refurbishment. One 66/33kV bank of single phase transformers is planned to be replaced with two three phase units in this plan. High voltage circuit breakers consist of nine 66kV outdoor ground mounted CB s, two indoor 33kV switchboards, twenty pole mounted 33kV CB s, seven indoor 11kV switchboards and seventy 11kV pole mounted reclosers and sectionalisers. Partial discharge testing has been carried out on the indoor 11kV and 33kV switchboards and this has verified good insulation condition. The fault duty of all equipment is within ratings. Pole mounted reclosers are now all of the vacuum interrupter type of oil, SF6 or solid insulation. There are 270 ground mounted field high voltage ring main switches in service. These are either encapsulated vacuum or oil switches. The oil switches manufactured prior to 1988 were subject to a weakness in the design Network Tasman Asset Management Plan Page 11
12 that creates intermittent operational problems. These have all been replaced. There are no high voltage oil fuse switches on the network. The network contains 4,537 distribution substations ranging in size from 5kVA to 1MVA. A small number of inservice transformer failures occur each year as a result of lightning strikes mainly. A distribution transformer renewal programme targeting the replacement of in service transformers that are older than 60 years is in place. As a public safety improvement initiative, the use of platform substations has been discontinued. A programme to remove existing platform substations based on risk of public access to platforms has been set up and this commenced in 2017/18. Budget forecast summaries for the classes of Maintenance and Renewals are given in Appendix F. Emergency repairs are included in these forecast summaries. 1.8 NETWORK DEVELOPMENT PLANS Within Network Tasman s area there are five bulk supply regions and each of these has a different growth rate. There is steady growth in the Stoke and Motueka bulk supply regions and steady but slower growth Golden Bay region. The Kikiwa and Murchison regions have shown significant growth in the past few years due to land use change to dairy farming with irrigation. A steady increase in base domestic and small commercial load annually over the whole region is expected of approximately 6GWh and 2.0MW per annum for the period of this plan. This growth excludes large consumer specific load increases. This translates to a steadily decreasing growth rate in percentage terms. The growth projection includes the effects of heat pump installations that are now replacing wood burner heating in the district. It also includes the effects of distributed generation and load management. Electric vehicle recharging is a new load that is developing. There is limited information on how this will affect network loading at present. Electric vehicles are small in number in the area at present but are expected to increase over time. Home vehicle charging is expected to impact low voltage distribution circuits initially. The effects of electric vehicle charging on the network will be investigated over the next two years and be considered in future AMP reviews. The load factor of the expected incremental growth is expected to be less than the current system load factor due to new loads such as domestic space heating and potentially electric vehicle charging appearing on peak and the effect of solar distributed generation which negates consumption but does not negate peak network load. This will very likely lead to an overall declining system load factor over time. The NTL network is generally of low consumer density (11 consumers/km line). Network constraints reached tend to be primarily end of line voltage related rather than component current capacity related. Upgrades to specific items of equipment due to projected overloading therefore tend to be the exception rather than the rule. In order to meet the load growth projected, a year by year plan of specific and non-specific network development projects has been formulated and is underway. This programme has been formulated from a step by step process of network development planning which includes the identification and elimination of network constraints as the loadings increase in line with projected growth over the planning period. The development projects include some specific upgrades to the 33kV sub-transmission system, additional zone substations and some specific reinforcements of the 11kV distribution system. Non-specific developments include expenditure items that are not cost recovered from new consumers or land developers under current policy. Distribution transformers and switchgear needed for distribution network extensions are the major items within this category. NTL relies heavily on the bulk supply of electricity from the major hydro generators in the south of the South Island. This is transmitted to the Nelson region over 220kV lines. Transmission capacity from Christchurch to Nelson was upgraded in 2006 by approximately 50% with the stringing of a third 220kV circuit on existing Network Tasman Asset Management Plan Page 12
13 double circuit towers from Islington to Kikiwa. Constraints exist however in the transmission capacity from Twizel to Islington in Christchurch. Transpower is currently implementing a series of tactical upgrades of the existing four circuits feeding power into the Islington bus. There is also a planned programme of strategic transformer upgrades and additional voltage support device installations. This development plan is expected to avoid the requirement for any major new transmission lines until at least Apart from the specifically identified network development projects, allowance has been made for network line extensions to new consumers in both urban subdivisions and in rural areas. The capital contributions policy was revised during 2011, and capital development contributions from prospective new customers in remote areas of the network are required. Current policy does not require capital contributions for transformers or items of high voltage switchgear from developers or intending consumers. Details of NTL s capital contributions policy are available on the website at A summary of projected development costs by major asset category and by year for NTL is given in Appendix D to this document. A list of specific development projects is given in Appendix E. The major capital projects for the next ten years are: Upgrade of Motueka Zone Substation. Extension of 33kV network to proposed new substations at Wakapuaka and Wakefield. Construction of new Grid exit point substation at Brightwater. Construction of new zone substation at Riwaka. Light copper conductor replacement programme. End of life distribution transformer renewal programme. The chart below shows the overall levels of expenditure on the distribution network since 2009 together with the projected expenditure to $k $20,000 $18,000 $16,000 $14,000 $12,000 $10,000 $8,000 $6,000 $4,000 $2,000 $0 Historic and Projected Network Maintenance and Capital Expenditure Vegetation Maintenance Capex Year This chart shows that capital expenditure has been steady and around $6m per year since 2006/7 when two zone substations were added to the network. Increased capital expenditure is expected for the next seven years during which time a number of upgrades to existing substations are planned and a new major GXP substation ( ) will be developed. Meanwhile, network maintenance and renewals continues at a steady rate of approx. $5m per year, mainly consisting of crossarm and pole hardware replacements. Vegetation maintenance expenditure is also shown in the chart generally averaging approx $1.0m per year. Vegetation expenditure is treated as an operational overhead but NTL views it as an important and necessary component of operating a high performing network. Network Tasman Asset Management Plan Page 13
14 1.9 RISK MANAGEMENT A risk assessment and risk management study of the distribution network was first undertaken by the company in This study has been reviewed and updated in conjunction with the AMP review. The background environment of risk of loss of electricity supply has not substantially changed since the original 1998 study. The results of this review work are included in section 5.4. Treatment of the identified risks is covered with reference to capital expenditure projects within this asset management plan and also with reference to the document Network Tasman Disaster Readiness and Response Plan (refer Appendix L) for those risk events that are treated through deployment of a specific contingency plan. Network Tasman s disaster readiness and response was reviewed by consultants Mitton Electronet during This review considered the Disaster Recovery Plan and also operational matters that would arise in the immediate and short term aftermath of a major event. A number of improvement recommendations were made and many of these are to be implemented in the next few years. The implementation of these recommendations will improve NTL s overall resilience to natural disasters such as major earthquakes. Aside from risks of non-supply due to failure of the NTL distribution network, there is risk of failure of the transmission network and in particular risk due to failure at TPNZ Stoke substation which is the major GXP from which NTL takes most of its supply. NTL is aware of this risk and has requested that Transpower undertake a risk management study to identify and document the significant risks of loss of supply from this substation, and also to detail all risk management strategies that are in place. This work is to be undertaken during The company operates a public safety management system. Incorporated in this system is a public safety risk management committee. Duties of the committee include: Establishing and maintaining a Public Safety Hazard Register Investigating all reported Public Safety incidents and near misses. Collating and reporting Public Safety Key Performance indicators to the board. Regularly reviewing Public Safety Hazards and implementing risk mitigation strategies 1.10 PERFORMANCE GAP ANALYSIS AND IMPROVEMENT PLANS SAIDI from unplanned outages is forecast to be over target for 2018/19 (102 against target 75). Unplanned SAIDI was impacted by three events on the 33kV system supplying Mapua Substation The SAIDI target for planned outages was increased in 2016, to account for additional shutdowns from a reduction in live line maintenance work. Planned outage SAIDI for 2018/19 is however also over target (forecast 109 against target 75). This is mainly due to the HV Light conductor replacement programme that is currently underway. This programme will run for a further 9 years. Increased planned shutdowns to complete this work are inevitable. The internal target for planned SAIDI has been increased this year from 75 to 100 for the next 9 years to account for this. The trend of network reliability performance (aside from major storm events) is generally of improvement and the operational benefits of capital investments into upgraded network capacity made over the past ten years are now being realised. Such investments have included the provision of additional backup circuits in the 33kV network and the shortening of 11kV feeders through the provision of additional feeder circuits and zone substations. Strategies to further address network reliability are to continue with the proposed developments in this plan, and to bring forward some of the cost effective reliability improvement measures such as installing fault indicators, trefoiling lines etc. Network Tasman Asset Management Plan Page 14
15 Consultation with consumers undertaken during 2018 indicates that there are no major concerns with respect to the supply reliability delivered or with the line price paid. This survey found an overall level of satisfaction 96% across the customer base taking into account supply reliability, supply quality, outage response, communication and price paid, with 65% of customers stating that no level of price increase would be justified to improve network performance. Network development activity continues in line with the development plan, so that network capacity and security is not compromised in the face of growth in load. Ongoing network maintenance and renewal activity includes pole, crossarm and line hardware replacements, trefoiling of 11kV circuits in some areas, and renewing overhead line conductors. Network Tasman believes that the asset management planning and processes it has deployed are serving the company and its consumers well, and that in many areas they follow industry best practice. GIS based information systems support the execution of cost effective and efficient system maintenance, asset renewals and vegetation management programmes. The results have been sustained low rates of faults combined with low cash operating costs. Areas for AMP process improvement are based around filling some holes in datasets and improving the overall accuracy of some datasets DEPLOYMENT OF NEW TECHNOLOGIES Photovoltaic Distributed Generation Distributed generation in the form of Solar PV has high uptake in Nelson when compared with other areas of NZ, but the current overall penetration level is not high enough to effect network operations at present. Solar PV growth in the area is ongoing however. The company has undertaken considerable study in conjunction with industry groups to model the effects of future high levels of PV in the network and identify strategies now that will maximise the hosting capacity available whilst maintaining equity and fairness to all users of the network. NTL has introduced standard operating settings for all PV inverters connected to its network. These settings avoid overvoltage conditions arising from high levels of distributed generation into the network and maximise the generation that can be accommodated. Battery Storage The potential for consumer grid connected battery storage is also being investigated with the aim of developing operating systems that benefit both the consumer and the network. There are approx. 30 battery storage systems currently in place on the network. One of these is owned and operated by Network Tasman. The operation of all of these is set up to optimise associated solar generation for the consumer. Investigative work is underway at present to establish an Energy Arbitrage mode of operation of battery storage system that also incorporates signals from the lines company to charge and discharge the battery to the benefit of both the consumer and the distribution network. Larger scale network connected battery storage systems have recently been installed in other distribution networks in NZ. Network Tasman is keeping a watching brief on the operation and economics of these systems as a means of voltage support or as alternative option for traditional network reinforcement. Future network development project business cases will fully analyse the opportunity for solving network development or renewal issues using this technology. Advanced Electronic Meters Network Tasman Asset Management Plan Page 15
16 Network Tasman has completed a rollout of advanced electronic meters (smart meters) throughout its network supply area. In this rollout older technology electronic and electromechanical meters were replaced with smart meters on consumer s switchboards. The smart meters incorporate remote two way communications capability. This rollout was undertaken primarily for electricity retailers. The rollout will however also provide Network Tasman with enhanced capability to monitor conditions on its network in real time and offer opportunities for NTL to improve the performance of its network and its service to consumers. These opportunities include but are not limited to: Pro-active voltage correction through analysis of voltage information available from smart meters. Reduction in consumer fault callouts through manual polling of voltage at the consumer s meter. Advance detection of network defects such as poor electrical connections through voltage exception reporting from smart meters. Improved back feed management following network outage. Attainment of these benefits will be a key priority for the company over the next few years. Network Tasman Asset Management Plan Page 16
17 2 BACKGROUND AND OBJECTIVES 2.1 ASSET MANAGEMENT PLAN PURPOSE The purpose of this asset management plan (AMP) is to document the asset management practices employed by NTL in order to define and carry out an optimised lifecycle management strategy for the electricity distribution assets managed by the company in the interests of its stakeholders. The AMP was first produced in 1994 and has been continuously and progressively developed. It is the company s key network planning document. The AMP is intended to meet the requirements of the Electricity Information Disclosure Requirements and to provide a technical document that communicates the asset management practices of NTL to its stakeholders. The AMP is based on currently available information and the experience and skills of NTL staff. It is reviewed annually to incorporate improved asset information and improved knowledge of stakeholder expectations and interests. The document includes an indication of the likely development path of the network based on current information, however it is not intended that any external parties place any reliance on the implementation or timing of specific projects. 2.2 CORPORATE OBJECTIVES NTL is owned by the Network Tasman Trust on behalf of consumers as defined in the Network Tasman Trust Deed. The business focus and direction of NTL is guided by its vision and mission as set out below. Vision To be a successful network services company for the benefit of our consumers. Mission To own and operate efficient, reliable and safe electricity networks and other complementary businesses while increasing consumer value. Key business objectives are therefore to: deliver reliable and high quality network services to consumers that are in broad alignment with customer and/or customer group expectations of reliability and price as revealed by the customer consultation process improve operational efficiency and effectiveness ensure regulatory compliance of the network and operations increase consumer value Network Tasman Asset Management Plan Page 17
18 2.3 ASSET MANAGEMENT PLANNING DRIVERS To achieve the key business objectives, a rigorous approach to managing the distribution network assets is required. The business objectives therefore set the drivers for the AMP. These drivers are identified as follows: 1. Safety Safety of workers, contractors and the general public is paramount in all operations of the company. In order to ensure ongoing safety, the asset management process will: specify works to maintain assets in a safe condition design and construct new assets to appropriate safety standards operate and work using appropriate safety procedures in compliance with health and safety in employment legislation and electricity industry safety standards. develop and operate appropriate risk management practices. 2. Consumer Service Consumers require an electricity supply that is safe, reliable, efficient and cost effective. The asset management approach incorporates a means to identify and satisfy consumer requirements. It also develops an understanding of available service level options and associated costs. 3. Economic Efficiency Investments in the network assets are made with the long term aim of maintaining or increasing consumer owner value. Asset management processes will: Provide economic cost benefit analysis for major projects. Tender major project work to competent contractors to achieve competitive prices. Optimise the trade-off between maintenance and renewal expenditure provide a means of planning and prioritising maintenance and renewal expenditure. Optimise network operation in order to minimise network losses and maximise network utilisation. 4. Environmental Sustainability NTL is committed to managing its business in an environmentally sustainable manner for the benefits of its consumers, community, shareholders and staff. NTL s commitment is set out in its environmental sustainability policy. Our Environmental Sustainability Policy provides for: Stakeholder consultation in our decision making where material trade-offs exist between environmental, social and financial issues; Sustainable use of natural resources to protect the biosphere by the use natural resources in a sustainable way; Reduction and disposal of waste by minimising waste, especially hazardous waste, and wherever practicable reuse or recycle materials in our operations; Wise use of energy; Risk reduction by understanding the risks to the environment that our operations pose and, based on those risks, prioritise our efforts to eliminate or minimise potential environmental hazards caused by our operations; Restoration of the environment; and Commitment of management resources Particular environmental objectives identified include: Avoiding discharge of contaminants into the environment. Avoiding noise. Avoiding, remedying or mitigating any adverse effects on the environment. Network Tasman Asset Management Plan Page 18
19 5. Regulatory Compliance The AMP document and process is part of NTL s drive to operate in a manner compliant with all relevant legislation. The key legislation relating to electricity distribution network management in NZ is: Electricity Act 1992 and amendments 1993, 1997, 2000, 2001, 2001(1), 2001(2) Electricity Reform Act 1998 and amendments. Electricity (Hazards from Trees) Regulations 2003 Electricity (Safety) Regulations Electricity Information Disclosure Requirements 2004 and amendments. NZ Electrical Codes of Practice Resource Management Act 1991 Electricity Governance Rules. Health and Safety at Work Act Risk Management In order to deliver the key business objectives in a sustainable manner, it is necessary that the asset management process incorporates a full understanding of the risks of adverse events impacting on achievement of the key business objectives. A risk approach to asset management will incorporate Establishment of risk context Identification of risks Assessment and treatment Process to monitor and review 2.4 PLANNING PERIOD AND REVIEW PERIODS The planning period of this AMP is 1 April 2019 to 31 March This document was approved by the board of NTL on 29 March The AMP will be reviewed on an annual basis based on the financial year to incorporate up to date information and plan improvements. The next review of the plan is expected to be issued on 31 March STAKEHOLDERS The needs and interests of the stakeholders of NTL are identified through direct and indirect consultation. Direct consultation with stakeholders takes place via meetings with individuals and groups such as retailers, major customers and organisations such as Federated Farmers etc. Indirect consultation occurs via feedback from meetings of the Network Tasman Trust and from mass market customer surveys. The major stakeholder interest conflict that forms a driver for the asset management function is the supply price/quality trade-off. Trust beneficiaries require an adequate return on assets employed whilst consumers require a safe, reliable and sustainable network operation. Balancing this trade-off is the primary function of the asset management process. Feedback from consumer/stakeholders is formally sought through direct consultation. The consultation process was last undertaken during The report from this consultation is given in Appendix K. Other less formal but equally important indirect means of consultation with company stakeholder consumers comes through interface with staff during day to day operations of the company. Both field and office based staff liaise with consumers, landowners, retailers, electrical contractors, developers and suppliers on an almost daily basis. Any issues arising from such operations are considered and reviewed by management and this consideration forms a major input into policy development. Conflicts between stakeholder interests inevitably Network Tasman Asset Management Plan Page 19
20 arise from time to time, and these are managed through company policy development. Company policy is signed off at CEO and Board level. An example is the conflict that exists between developers wishing to subdivide land and complete residential or commercial developments and existing consumers. A level of contribution from developers is required to cover the utilisation of upper network capacity that has previously been made available by existing consumers or other developers. In order to manage and resolve these conflicting interests a Capital Contributions Policy has been introduced. This and other important company policy documents affecting stakeholders are publicly available on the company website. Key stakeholders and their interest in NTL are generally summarised below. Customers Stakeholder Retailers Direct supplied consumers End use consumers Developers Electrical Contractors Interest Reliability of Supply Quality of Supply Price of services Company Operational Efficiency Capital Contributions Policy Safety Suppliers Other Company TPNZ Electrical Contractors Service Providers Local Authorities Community Groups Government Trust Beneficiaries Network Tasman Trust Directors Management Staff Utilisation of provided services NTL Financial viability Underground conversion policy Environmental performance Regulatory Compliance Corporate Citizenship Financial Performance Operational Performance Quality of Employment Network Tasman Asset Management Plan Page 20
21 2.6 ACCOUNTABILITIES AND RESPONSIBILITIES Accountabilities and responsibilities in respect of network operations and management are summarised in the chart below. FIGURE 1 ACCOUNTABILITIES AND RESPONSIBILITIES OF PARTIES Network Tasman Trust Statement of Corporate Intent NTL Directors Company Performance Plan Employment and Performance Contracts Chief Executive Commercial Manager Customer Consultation Use of Systems Agreements Corporate Services Manager Output Connection Contract Network Manager Works Programme Works Auditing Load Forecasting Network Modelling AMP GIS Capital Project Management New Connections Public Safety Management System Operations Manager System Control Asset Condition Assessment Outage Planning Control Room Operations Compliance HASIE Network Maintenance Faults Response Vegetation Management Retailers Line Function Services TransPower Transmission Services Tender Works Contract External Service Providers Note - all maintenance and capex is contracted out Fault Phone Line Faults Response Maintenance Renewals Minor Capex Vegetation Works The Network Tasman Trust holds shares in the company on behalf of the consumers who are the trust beneficiaries. The Trust is made up of six trustees, five of whom are elected by the consumers and one who is appointed by the 3 largest consumers. The Trust has the role of appointing the directors of the company, and approving the Statement of Corporate Intent (SCI), which is the guiding document of the company. The Trust, as representatives of the consumers, also have a role of feeding back views of consumers to the company on such matters as price and performance. This is an indirect means of consumer consultation that has a significant influence over the asset management planning process. Network Tasman Asset Management Plan Page 21
22 NTL has six directors, who have an overall governance role of the company, and who are legally accountable for the company. The AMP, annual business plan and budgets are approved by the board of directors. Company performance is managed through a performance plan agreed between the board and company management. Asset management outcomes are reported to the board through monthly management reports and through the process of the annual AMP reviews. Monthly information to board members includes analysis of all network outages for the month and a running summary of overall network performance for the year. Updates on AMP projects underway are also included in the monthly information to directors. As a part of the AMP review process, a study and analysis on network reliability by feeder against that expected following AMP project implementation is updated in a report to directors each year. Also as part of the review process, any policy developments through the year affecting the AMP, or any recommendations from external reviews or audits are discussed and incorporated into the AMP as appropriate. Such plan developments are highlighted in the final presented draft. The AMP review is presented to the board and discussed for final approval annually in time for regulatory disclosure. The management team of NTL has responsibility for the day to day management of the company and its assets and for implementing company policy. The Network Manager is responsible for the annual production of the AMP. The plan is also reviewed by company management before finalisation. The asset management functions and processes are undertaken and overseen within the company by a number of staff under the oversight of the Network Manager. Asset management functions within NTL are shown in Figure 2. FIGURE 2 ASSET MANAGEMENT FUNCTIONS WITHIN NETWORK TASMAN OPERATIONS MANAGER Maintenance Works Contract Management Network Control Outage Management NETWORK MANAGER Load Forecasting Network Modelling Network Standards GIS AM Policy and Processes AM Plan Public Safety Management System (PSMS) Network Extension Design Approvals Consumer Connections Management NETWORK SURVEYOR Network Survey Works Audit VEGETATION OFFICERS Vegetation Compliance Tree Works Management Corridors and Access Tracks Tree owner Notification CAPITAL PROJECTS MANAGERS Project Design and Tender Contract Management Network planning, system analysis and design for projects are all completed by NTL staff. Consultants are deployed in specialist areas such as risk management studies, network security policy formulation, and in projects involving major civil and structural engineering. All major capital expenditure projects are put out to tender for construction. Once contracts are awarded, most construction projects are managed by NTL staff. Network Tasman Asset Management Plan Page 22
23 A contract for provision of a faults response service, all asset maintenance works and minor capital works exists between NTL and Delta Utility Services Ltd. This five year term contract commenced on 1 April During 2015 the contract was renewed and extended for a further five year term commencing on 1 April A contract for provision of maintenance and faults services covering the 66kV network assets is held by Electronet Transmission Ltd. The Network Manager is responsible for the outcomes of these contracts, and for the cost performance of the network operation against budget. Contractor performance is monitored through regular meetings with the contractors at an operational level and at a management level. An alliance partnership regime is in place where both principal and contractor work together to achieve the most effective and efficient outcomes within the terms of the contract. Document approvals and levels of expenditure delegation are given in the following table: DOCUMENT/EXPENDITURE LEVEL Statement of Corporate Intent Asset Management Plan Annual Business Plan and Budget Expenditure >$100,000 Expenditure >$50,000 and <$100,000 Expenditure >$10,000 and <$50,000 Expenditure <$10,000 APPROVAL AUTHORITY NTL Trust Board Board Board Chairman CEO Managers 2.7 AMP INTERACTION WITH CORPORATE GOALS AND BUSINESS PLANNING The management of the electricity distribution network in the Nelson/Tasman area (excluding the inner Nelson City serviced by Nelson Electricity Ltd) for the consumer owners of the company, is the major business activity of NTL. Although NTL also operates a number of other business activities outside of the electricity network management business, the greater part of the company s expenditures and revenue streams are based on the electricity network business. As a result of this, the primary strategic focus of the company is on the management and performance of the electricity distribution network. FIGURE 3 AMP INTERACTION WITH OTHER CORPORATE DOCUMENTS CUSTOMER CONSULTATION NTL Trust Retailer Feedback Consumer Surveys STATEMENT OF CORPORATE INTENT Vision and Mission Objectives Performance Targets STRATEGIC FRAMEWORK NETWORK PERFORMANCE TARGETS ASSET MANAGEMENT PLAN Background Strategic Overview Network Development Plan Asset Maintenance & Renewals Plan ANNUAL BUSINESS PLAN & BUDGET Overview AMP Expenditure Plans Non AMP Expenditure Plans Revenue Plans Consolidated Budgets Network Tasman Asset Management Plan Page 23
24 The vision and mission of the company (ref section 2.1), are translated into corporate goals that are network performance focussed. The goals specified in the company s Statement of Corporate Intent (SCI) are the performance goals of the AMP. The relationships of stakeholders and accountabilities and responsibilities for this process are represented in Figure 1. and described in section 2.6. The capital expenditure projects and network operations and maintenance activities as outlined in this plan form the major part of the annual business plans of the company. 2.8 ASSET MANAGEMENT INFORMATION SYSTEMS The following information systems are employed by NTL for use as input to the asset management process. 1. Geographic Information System (GIS) A computer-based Geographic Information System contains records for all distribution network assets, including attribute data on the location, age and type of all equipment employed on the network. The GIS comprises the main datastore for all network management activity. It is used for most operational functions of the company. The GIS system incorporates information from sub-system databases that are maintained on an ongoing basis. These sub-systems are: a. The Substation/Transformer database this database records the parameters of all distribution substation sites (approx 4,300) and holds earth test and loading records for the sites. The database also tracks the location, specifications and test records of all transformers. b. The Consumer Network Connection Points (NCP) database this database records the capacity parameters and start dates of all end use consumer connections to the distribution network. The database is maintained at NTL and is used for the reconciliation of line charge revenue. c. The Network Maintenance database this database records all network survey condition assessments against each pole, service box, distribution substation or ground mounted switchgear. Information collected on proforma sheets during the continuous line surveys is entered. Maintenance contracts are later generated using GIS tools in conjunction with the survey information. Maintenance works within the database are signed off when completed in the field by the entry of date of completion information. The database is also used for statistical reporting and identification of trends in component failures, and in the determination of component life cycles. d. The Network load survey database this database records all network loading data from maximum demand recording devices that are positioned at strategic points on the network. This information is used in network development planning. 2. Outages and Faults Databases A database of all planned and unplanned outages on the high voltage network is kept and updated at the time of restoration of supply by network operations staff in the control room. Detailed information is stored against each outage including the time, area, number of consumers affected and the reason for the outage - whether it was planned or unplanned. Fields are set up to allow easy summary information extraction and determination of network performance statistics. Network reliability information is required to be disclosed annually under the Electricity Information Disclosure regulations. Process and procedures are in place to ensure that records for this purpose are complete and accurate. Full details of these procedures and process are given in Appendix M. These processes and procedures utilise the consumer and network information within the GIS system to identify the consumers affected by any outage. The sections of network affected in any outage are identified from switching records. Faults on the low voltage network are recorded in a second database. This information is kept to allow for contractor performance monitoring, summary statistics, the identification of recurring faults and trend analysis. Network Tasman Asset Management Plan Page 24
25 3. Network Load Flow Model A network loadflow model is kept and this is used for performance analysis of the network under various loading conditions. The results of this modelling are used in the formulation of the network development plan. 4. SCADA System The SCADA system (Supervisory Control and Data Acquisition) has remote stations at the major zone substations, subtransmission substations, GXP substations, ripple injection plants and field autoreclosers/sectionalisers. The system allows for the remote monitoring and control of loads at substation and feeder level with data stored at the master station computer in the control room at our head office. Historical trend information on substation and feeder loadings is used in the network load survey process and in the formulation of the demand forecast. 5. Vegetation Database During 2005/6, a vegetation notification database system was instigated. This records vegetation notification activities meeting the requirements of the Electricity (Hazards from Trees) Regulations This database will continue to form the basis of vegetation management activity into the future. This database may be linked to the Geographic Information System in the future. 6. Customer consultation database Two key means of customer consultation occurs: Direct, detailed consultation with the 30 or so largest customers Mass market surveys of consumer satisfaction with supply reliability as assessed by several proxies. The most recent customer consultation outcomes are given in Appendix K. 2.9 INFORMATION SYSTEMS GAP ANALYSIS: The datasets described above have a high degree of accuracy and completeness. All datasets have a level of accuracy and completeness that is adequate and appropriate for their purposes. Data accuracy limitations exist in the year of manufacture of some specific assets. In particular, many poles have no recorded date of manufacture, and in these cases, a year of manufacture has been derived from other records such as the year of line construction, on the assumption that the poles used in the line construction were manufactured in the same year. As the asset renewal and maintenance regime is condition based down to a high level of asset disaggregation, this limitation does not affect the effectiveness and performance of the maintenance systems. Also, the assumptions made do not significantly affect long term renewals expenditure projections as any errors brought about by these assumptions are very small with respect to the overall error within the expenditure projections. Although spatial positioning accuracy is sufficient for operational purposes, positioning information is improved on an ongoing basis as information comes to hand from land surveys etc ASSET MANAGEMENT PLAN FORMULATION AND STRATEGIC REVIEW PROCESS Figure 3 represents the information inputs and flows into the AMP formulation and review process. Network Tasman Asset Management Plan Page 25
26 FIGURE 3. ASSET MANAGEMENT PLANNING INFORMATION SYSTEM Asset Survey Information Fault Statistics Network Inventory (GIS) Growth Projection Network Load Survey Network Loadflow Modelling Risk Management Plan ASSET MAINTENANCE AND RENEWALS PLAN Customer Consultation NETWORK DEVELOPMENT PLAN AMP Formulation ASSET MANAGEMENT PLAN Asset Condition Information The company s Network Maintenance database which holds information from ongoing field asset surveys, supplies required and prioritised asset maintenance works activities to form the annual Asset Maintenance and Renewals Plan. This forms the basis of the works programme which is forwarded to Delta Utilities Ltd who complete the works under contract. Trend information from the faults outages database is used to prioritise work activities in cases where repeat fault patterns are identified from the historical faults information. The GIS system is used in works planning to locate and geographically group works activities so that the contractor may efficiently plan the work. Network Development The Network Development plan is built up using a loadflow model of the network as a basis. Field load survey data from the Distribution substations max demand database is used to check the distribution of loads modelled across the network. The model is then enhanced with load growth projections from the Demand forecast and following this, network constraints or areas of non-compliance with voltage standards are identified. A series of development project options is generated to remove the identified network constraints or correct the projected voltage profile. This series of options is then considered collectively to form a view of the most likely overall medium to long term development path. Consideration of technical effectiveness, economic efficiency, ongoing compliance with the network security standard, and management of risk of non-supply are part of the process of formulation of the medium to long term Network Development Plan. The Asset Maintenance and Renewals plan and the Network Development plan are brought together in the AMP document. Stakeholder Interests: Specific stakeholder interests are considered during the AMP formulation and annual review. Such items include annual review of the undergrounding policy and project priorities in conjunction with the two Network Tasman Asset Management Plan Page 26
27 territorial authorities, and review of vegetation management policy. Budgets for the ten years going forward are developed from this. Wider stakeholder issues raised by the Network Tasman Trust or feedback from customer consultation will also be considered at this stage. Such issues may include review of capital development contributions policy. Stakeholder interests are accommodated within asset management practises through: Load forecasting Network planning Network security standards Network design and construction standards Environmental policy implementation Safety Management processes Fostering of local contracting marketplace Clear contracts with counterparties Use of Professional advice where required Conflicts between stakeholder interests and asset management requirements exist and must be managed. Examples of this are specific priorities of underground conversion undertaken, or the overall level of underground conversion undertaken. Conflicting stakeholder interests are managed through: Consideration of stakeholder needs as part of high level planning process Cost benefit analysis of major network investments NTL s objective to operate as a successful business (Energy Companies Act requirement) Board level policy development Strategic Review Process: The AMP and its associated budgets provide the major inputs to the company s strategic and business plans. Company strategic and business plans are reviewed annually following completion of the annual AMP review. The AMP and business plan budgets are reviewed from a company financial perspective. This involves updating the business financial models in order to form a picture of the medium and long term financial future of the organisation. At this time, the organisational capabilities and capacity to implement the company AMP and business plan projects are also reviewed. The company structure and resourcing model is considered in light of the network development, renewal and maintenance expenditure levels and time profiles. Maintenance and renewal works are contracted out to a primary service provider under the works contract. The work levels for the five years of the contract are discussed with the works contractor in order that medium term contract resource planning can take place. This includes contractor competency and training requirements. All major capital works are tendered to local or national service providers. Most projects are planned and designed using in house resources. If the planning or design requirements of the capital works plan exceeds the capabilities or capacity (due to workload) of the in house resource, then consideration is given to contracting external design and project management services for particular projects. Also during the annual strategic planning process, a review of company performance against targets is undertaken, together with a benchmarking review of the company performance against all other lines companies in NZ. The company performance review draws on data from monthly reliability reports, proven voltage complaints, review of the company s financial performance against budget targets and other performance measures in this plan. The benchmarking review utilises gazetted information disclosure data including operational and Network Tasman Asset Management Plan Page 27
28 financial performance information. The results of these reviews are fed back into company strategic targets and may trigger review of AMP performance targets and the company s SCI. Annual company performance against SCI targets are fed back to the wider company stakeholders via the company s annual report. A summary of the annual report is sent out to all consumers. Network Tasman Asset Management Plan Page 28
29 3 NETWORK CONFIGURATION AND ASSET DESCRIPTION 3.1 NETWORK CONFIGURATION The area covered by the NTL network is shown in the map of Appendix A. There are five bulk supply regions. These are supplied from four Transpower grid exit points (GXP s). Transpower GXP s exist at substations at Stoke (33kV and 66kV), Kikiwa (11kV) and Murchison (11kV). Maps showing the five bulk supply regions are also given in Appendix A. The overall maximum demand on the Network Tasman distribution system for 2018 was 122MW. The winter weather was mild. The total electricity delivered to consumer ICP s was 629GWh. The overall load factor was 60%. There are 11kV line interconnections between the Stoke, Motueka and Kikiwa area systems, however the load transfer capability between any supply region is limited to only kW due to the fact that they are end of rural overhead 11kV feeder interconnections only. Details of line and cable lengths by voltage are given in Section 3.3. The network is 26% underground by circuit length overall Stoke Bulk Supply Region This region is the major load region of the NTL network, containing approx. 27,000 consumer connections. There are two direct supply 33kV consumers being Nelson Electricity Ltd (35MW) and Nelson Pine Industries Ltd (20MW). The main suburban townships in this region are Stoke and Richmond, with other semi-rural centres at Atawhai, Brightwater, Wakefield and Mapua. The Grid Exit Point (GXP) is at Transpower s Stoke substation from which a load of 127MW is supplied at 33kV. Transpower supplies Nelson Electricity s load from this substation as well as NTL. The firm capacity of this GXP is 138MVA. NTL demand from the substation is 94MW. Nelson Electricity s coincident peak demand from Stoke is 33MW. Stoke is the only GXP in the area from which this load can be served. There is therefore a heavy reliance on this GXP. Within this bulk supply region NTL has nine 33/11kV substations at Founders Park, Annesbrook, Songer Street (Stoke), Richmond, Hope, Lower Queen Street (Richmond Industrial), Eves Valley (Brightwater Industrial), Brightwater, and Mapua. A schematic diagram and geographic layout of the Stoke bulk supply region subtransmission system is given in Appendix A. Most of the zone substations in this GXP region have n-1 subtransmission security. Details of the subtransmission security for all zone substations is given in section 7.6. The total energy delivered to NTL from this GXP is 488,200MWh, giving an annual load factor of 57%. The region contains a mainly overhead 33kV sub-transmission network, and a partially underground 11kV and 400V distribution network. The 33kV network provides open ring supply to the larger urban zone substations and a single line supply to rural and dedicated industrial zone substations. The 11kV networks in the region are run as open rings in the urban area, with significant sections underground. Rural 11kV networks are mainly single line overhead radial feeders. The load characteristic has a continuous base load resulting from the 24 hour a day operation of the Nelson Pines Industries MDF Plant. A mix of other industrial/commercial and domestic load is superimposed on this. The peak load period is driven by winter domestic space heating with a peak period occurring in June and July Motueka Bulk Supply Region The Motueka region encompasses the town of Motueka and its environs. There are approx. 7,500 consumer connections spread throughout this area. The township has four 11kV feeders supplying it from the Motueka substation. A further four overhead line feeders from Motueka substation feed out into the rural hinterland of mainly horticultural farming and lifestyle blocks. The resort centre of Kaiteriteri is included in this bulk supply Network Tasman Asset Management Plan Page 29
30 region. As with Stoke, the 11kV system is run in open rings for the township area and mainly single line overhead supplies to the rural areas with very limited backup circuits. The GXP for this bulk supply region is at Stoke substation at 66kV. Two 66kV circuits from Stoke substation supply the Motueka zone substation and the Motupipi substation in Golden Bay. Motueka bulk supply region has peak offtake of 20MW. The firm capacity of the Motueka zone substation is 23MVA. The load is a mix of domestic, horticulture and food processing. The combination results in a long peak load period running from February through to September. The total annual energy delivered is 101,600MWh, giving an annual load factor of 57% Golden Bay Bulk Supply Region In Golden Bay, Network Tasman has a subtransmission substation (66/33kV) at Motupipi. The Transpower GXP for the region is the 66kV connection at the Stoke substation. NTL also has two 33/11kV zone substations within the Golden Bay bulk supply region at Takaka (Takaka) and Collingwood (Swamp Road). Golden Bay contains approx. 3,500 consumer connections including one large industrial load at the Takaka dairy factory. The 33kV network consists of two single line feeders, one supplying each of the 33/11kV zone substations. The zone substations are simple two transformer substations with pole mounted 11kV feeder autorecloser switchgear. The 11kV systems are radial overhead lines mainly with minimal alternate routes beyond the limits of the Takaka Township. The line to the west coast from Collingwood traverses some very remote coastal terrain with very light consumer density. The harsh coastal environment of this line creates high maintenance overheads for this line and supply restoration difficulties following fault outages. The peak load in this bulk supply region is 7.5MW. As the Motupipi substation has a single line 66kV supply, this supply region has no firm capacity. The area has domestic profile characteristic with winter peak that is modified by the effect of the dairy industry and by summer holiday activity. The overall load in the region has its peak period over summer and early autumn. The total annual energy delivered is 40,020MWh, giving an annual load factor of 60% Kikiwa Bulk Supply Region The Kikiwa bulk supply region is supplied at 11kV with a peak load of 3.2MW. Firm capacity of 5MW with manual switching is available from the GXP at Transpower s Kikiwa substation. The supply area contains approx. 1,100 consumer connections including a timber processing factory. There are two small centres at Tapawera and St Arnaud which are 20km and 40km respectively from the bulk supply point. Three overhead line feeders supply the area from Kikiwa substation. The country traversed by these feeders is mountainous and remote. Pole mounted autoreclosers are utilised to limit the extent of fault events on these lines. One of the feeders is now operating at 22kV. The load characteristic for the Kikiwa bulk supply region is a mix of domestic and dairying operations including significant irrigation during dry summers. The peak period is typically February to April. The total annual energy delivered is 13,600MWh, giving an annual load factor of 49% Murchison Bulk Supply Region This region has a small township at Murchison that is surrounded by four river valleys. The GXP substation at Matiri is close to the load centre at Murchison and it has a peak load of approximately 2.9MW. The substation has a single 3 phase transformer, therefore there is no firm capacity available. In the event of a transformer failure, temporary generation would be deployed until the Transpower mobile substation could be deployed to the site. Consumers supplied from the substation number approx Three radial 11kV overhead feeder lines distribute power away from this substation in four directions. The longest 11kV spur feeder in the NTL network runs from Matiri to Springs Junction, a run of 80km. Network Tasman Asset Management Plan Page 30
31 The load characteristic for Murchison is similar to Kikiwa with a mix of domestic and dairy farming being the dominant drivers. Irrigation is less than in Kikiwa however. The peak loading occurs in late summer and early autumn. The total annual energy delivered is 12,400MWh, giving an annual load factor of 49%. 3.2 ASSET JUSTIFICATION AND NETWORK OPTIMISATION All networks are optimised for the loads that they supply. The distribution system has been developed around the main load centres initially and then extended out into the surrounding districts during the 1960 s and 1970 s. Underground conversion of the suburban main roads and commercial centres only, occurred during the period 1972 to Most suburban streets that were formed prior to 1970 however, have retained the original overhead reticulation. Underground conversion of the main suburban thoroughfares has occurred and is ongoing under current policy. Back-up capacity in most parts of the network is appropriate for the type of load serviced in line with our design security standard, however there are a small number of load sections that do not have design standard back-up capacity. Capital expenditure is planned to bring all networks up to the design security standard. Distribution substations of capacity 100kVA and greater are fitted with maximum demand indicators and transformers are regularly relocated to maximise transformer capacity utilisation. There are no areas in the network that have experienced material loss of load rendering stranded network assets, however there are a number of identifiable sections of uneconomic supply. All new urban subdivisions since 1970 have been reticulated underground, however extensions to rural lifestyle blocks have tended to be overhead line to the 11kV substation with underground cable substation to dwelling. The engineering standards of the major territorial authorities in the area now require rural 11kV extensions to be underground by default, and there is increasing public pressure to minimise additional overhead line construction. Embedded generation exists within the Golden Bay and Motueka regions. Privately owned hydro plants are at Cobb (32MW), Pupu Valley (250kW), Onekaka (900kW), Brooklyn (200kW) and Upper Takaka (400kW). The Cobb Power station is directly connected to the 66kV subtransmission network and generation from it generally exceeds the offtake load (Motueka+Golden Bay bulk supply regions). This means that powerflows at the Stoke 66kV GXP are into the grid rather than away from it at most times. A 5MW hydro scheme is now under construction at Lake Matiri near Murchison. It is being built by Pioneer Generation Ltd. The station will connect with NTL s network at the Transpower Murchison GXP. Other small hydro generation projects are planned in the area. Solar Photovoltaic generation exists in the network with approx. 740 mostly domestic scale sites. Total installed PV is approx. 2200kW. 3.3 ASSET DESCRIPTION All distribution assets employed in the NTL network are listed by category in this section. The reader s attention is drawn to the map at Appendix A showing the main 11kV distribution network overlaid on a topological map. Network Tasman Asset Management Plan Page 31
32 Distribution Lines (km) 400V Line 400V Cable 6.6kV Line 6.6kV Cable 11kV Line 11kV Cable 22kV Line 22kV Cable 33kV Line 33kV Cable TOTAL Underground % Stoke Motueka Golden Bay Kikiwa Murchison kV Subtransmission Lines (km) Circuit Length (km) Year Constructed Stoke-Upper Takaka Stoke-Cobb Upper Takaka-Cobb Upper Takaka-Motupipi Total Overhead Line Age Profile Length (km) kV Lines 11/22kV Lines 400V Lines Age (Years) Network Tasman Asset Management Plan Page 32
33 Underground Cables Age Profile Length (km) kV Cables 11/22kV Cables 400V Cables Age (Years) Zone Substations Substation Transformers Firm Capacity (MVA) Offtaks Max Demand (MW) Outgoing 11kV Feeders Meets Security Std Annesbrook 2x11.5/23MVA Yes Hope 2x10MVA Yes Songer St 2x11.5/23MVA Yes Lower Queen St 2x15/30MVA* N/A 1 Eves Valley 2x5MVA Yes Takaka 2x 5/7.5MVA Yes Swamp Rd 2x 3MVA Yes Brightwater 2x 7.5/15MVA Yes Founders 2x7.5/15MVA Yes Mapua 2x10MVA Yes Richmond 2x11.5/23MVA Yes Motueka 2x 10/20MVA Yes Upper Takaka 2 x 6MVA Yes *Owned by Connected Large Industrial Consumer 1 Security level at preference of consumer Subtransmission Substations Substation Transformers Firm Capacity (MVA) Max Demand (MW) Meets Security Std Motupipi 4 x 1ph 6.6MVA No Cobb 2x40MVA* Yes *Owned by Connected Generation Company Network Tasman Asset Management Plan Page 33
34 Ripple Injection Transmitters Plant Generator Coupling Cell Controller Year Stoke Enermet SFU-K Indoor 33kV Enermet/Abbey EPL 1990 Motueka Enermet SFU-K Indoor 11kV Enermet/Abbey EPL 1983 Motupipi L+G SFU-K Outdoor 33kV Enermet/Abbey EPL 1984 Kikiwa L+G SFU-K Indoor 11kV Enermet/Abbey EPL 2013 Murchison L+G SFU-K Indoor 11kV Enermet/Abbey EPL 2013 Power Transformers Current Year 2019 Substation Unit Serial No Transform Voltage (kv) MVA Make Year Age Year Refurbished Hope T /11 10 Brush Hope T /11 10 Brush Annesbrook T1 M0235A 33/ /23 Wilson NA Annesbrook T2 M0235B 33/ /23 Wilson NA Songer St T / /23 Tyree Songer St T / /23 Tyree NA Eves Valley T /11 5 ABB NA Eves Valley T /11 5 ABB NA Brightwater T /11 7.5/15 Tyree NA Brightwater T /11 7.5/15 Tyree NA Founders T /11 7.5/15 Tyree NA Founders T /11 7.5/15 Tyree NA Takaka T1 P0872A 33/11 5/7.5 Wilson NA Takaka T2 M9854A 33/11 5/7.5 Wilson NA Swamp Rd T /11 3 TJ Swamp Rd T /11 3 TJ Motupipi T /33 4 x 6.66 ASGEN NA Mapua T /11 10 Brush Mapua T /11 10 Brush Richmond T1 M0602B 33/ /23 Wilson NA Richmond T2 M0602A 33/ /23 Wilson NA Motueka T5 VN / /23 ABB NA Motueka T6 VN / /23 ABB NA Upper Takaka T1 P /11 6 Wilson NA Upper Takaka T2 P /11 6 Wilson NA Max Age (Yrs) 61 Avg Age (Yrs) 28.0 Outdoor 66KV Switchgear Current Year 2019 Unit Type Make Year Manufactured Age Motupipi T1 Vacuum AE Power Motueka 62 SF6 ABB Motueka 82 SF6 ABB Upper Takaka 172 SF6 ABB Upper Takaka 192 SF6 ABB Upper Takaka 202 SF6 ABB Upper Takaka 222 SF6 ABB Cobb 72 SF6 ABB Cobb 82 SF6 ABB Max Age (Yrs) 29 Average Age (Yrs) 24.0 Network Tasman Asset Management Plan Page 34
35 Outdoor 33KV Switchgear Current Year 2019 Unit Type Make Year Manufactured Age Hope T1 Bulk Oil Takaoka Hope T2 Bulk Oil Takaoka Annesbrook T1 Bulk Oil Takaoka Annesbrook T2 Bulk Oil Takaoka Songer St T1 Bulk Oil Takaoka Songer St T2 Bulk Oil Takaoka Lower Queen St T2 Vacuum McGraw Edison Lower Queen St T3 Vacuum McGraw Edison Founders T1 Vacuum Nulec N Series Founders T2 Vacuum Nulec N Series Eves Valley Vacuum McGraw Edison Brightwater T1 Vacuum McGraw Edison Brightwater T2 Vacuum McGraw Edison Railway Reserve Vacuum McGraw Edison Takaka T1 Vacuum Nulec N Series Takaka T2 Vacuum Nulec N Series Takaka Feeder Bulk Oil Nissin Collingwood Feeder Bulk Oil Mitsubishi Three Bros Corner Vacuum Nulec N Series Hope Feeder Vacuum McGraw Edison Max Age (Yrs) 53 Average Age (Yrs) 32.5 Indoor 33kV Switchgear Unit Type Make Year Manufactured Age Mapua Incomer 1 SF6 Fluair Mapua BS SF6 Fluair Mapua T1 SF6 Fluair Mapua T2 SF6 Fluair Richmond Incomer 1 Vacuum Tamco Richmond Incomer 2 Vacuum Tamco Richmond BS Vacuum Tamco Richmond T1 Vacuum Tamco Richmond T2 Vacuum Tamco Outdoor 11kV Pole Mounted Switchgear No. Average Age Est Recloser McGraw Edison KF 2 36 Recloser McGraw Edison KFE 4 33 Recloser Nulec U Series Sectionaliser Nulec U Series 2 3 Total 70 Outdoor 11KV Ground Mounted Switchgear No. Average Age Est Magnefix 1T 1 44 Magnefix 2K1T Magnefix 3K1T Magnefix 4K1T 4 21 ABB SD ABB SD Halo 3LBS 6 3 Halo 4LBS 8 3 Halo 2LBS+2CB 1 4 Xiria 2 9 Total Units 308 Network Tasman Asset Management Plan Page 35
36 Indoor 11kV Switchgear Current Year 2019 Substation Feeder Type Make Year Manufactured Age Annesbrook Tahuna Vacuum Reyrolle LMVP Annesbrook Stoke Vacuum Reyrolle LMVP Annesbrook Aerodrome Vacuum Reyrolle LMVP Annesbrook Bishopdale Vacuum Reyrolle LMVP Annesbrook Wakatu Vacuum Reyrolle LMVP Annesbrook Pascoe St Vacuum Reyrolle LMVP Annesbrook Bolt Rd Vacuum Reyrolle LMVP Annesbrook Moana Vacuum Reyrolle LMVP Annesbrook T1 Incomer Vacuum Reyrolle LMVP Annesbrook T2 Incomer Vacuum Reyrolle LMVP Annesbrook Bus Section Vacuum Reyrolle LMVP Annesbrook Local Service Fuse Sw Reyrolle LMVP Founders Akersten Vacuum Reyrolle LMVP Founders Hira Vacuum Reyrolle LMVP Founders Atawhai Vacuum Reyrolle LMVP Founders Spare Vacuum Reyrolle LMVP Founders T1 Incomer Vacuum Reyrolle LMVP Founders T2 Incomer Vacuum Reyrolle LMVP Founders Bus Section Vacuum Reyrolle LMVP Founders Local Service Fuse Sw Reyrolle LMVP Hope Future 1 Vacuum Reyrolle LMVP Hope Waimea West Vacuum Reyrolle LMVP Hope Appleby Vacuum Reyrolle LMVP Hope Paton Road Vacuum Reyrolle LMVP Hope Gladstone Road Vacuum Reyrolle LMVP Hope Wensley Road Vacuum Reyrolle LMVP Hope Waimea East Vacuum Reyrolle LMVP Hope Future 2 Vacuum Reyrolle LMVP Hope T1 Incomer Vacuum Reyrolle LMVP Hope T2 Incomer Vacuum Reyrolle LMVP Hope Bus Section Vacuum Reyrolle LMVP Hope Local Service Vacuum Reyrolle LMVP Lower Queen St Estuary SF6 ABB Safesix Lower Queen St Queen St SF6 ABB Safesix Lower Queen St Swamp Rd SF6 ABB Safesix Lower Queen St Furnaces SF6 ABB Safesix Lower Queen St Refiners SF6 ABB Safesix Lower Queen St Chip Mill SF6 ABB Safesix Lower Queen St MDF East SF6 ABB Safesix Lower Queen St Lumber Plant SF6 ABB Safesix Lower Queen St T1 Incomer SF6 ABB Safesix Lower Queen St T2 Incomer SF6 ABB Safesix Lower Queen St T3 Incomer SF6 ABB Safesix Lower Queen St Bus Section SF6 ABB Safesix Mapua Mahana Vacuum Reyrolle LMVP Mapua Mapua Vacuum Reyrolle LMVP Mapua Upper Moutere Vacuum Reyrolle LMVP Mapua Spare Vacuum Reyrolle LMVP Mapua T1 Incomer Vacuum Reyrolle LMVP Mapua T2 Incomer Vacuum Reyrolle LMVP Mapua Bus Section Vacuum Reyrolle LMVP Mapua Local Service Fuse Sw Reyrolle LMVP Songer St Main Road Vacuum Reyrolle LMVP Songer St Aldinga Vacuum Reyrolle LMVP Songer St Polstead Vacuum Reyrolle LMVP Songer St Monaco Vacuum Reyrolle LMVP Songer St Nayland Vacuum Reyrolle LMVP Songer St Saxton E Vacuum Reyrolle LMVP Songer St Saxton W Vacuum Reyrolle LMVP Songer St Isel Vacuum Reyrolle LMVP Network Tasman Asset Management Plan Page 36
37 Songer St T1 Incomer Vacuum Reyrolle LMVP Songer St T2 Incomer Vacuum Reyrolle LMVP Songer St Bus Section Vacuum Reyrolle LMVP Songer St Local Service Fuse Sw Reyrolle LMVP Richmond King St Vacuum Reyrolle LMVP Richmond Waverley St Vacuum Reyrolle LMVP Richmond Talbot St Vacuum Reyrolle LMVP Richmond McGlashen Ave Vacuum Reyrolle LMVP Richmond Lower Queen St Vacuum Reyrolle LMVP Richmond Beach Rd Vacuum Reyrolle LMVP Richmond Champion Rd Vacuum Reyrolle LMVP Richmond Darcy St Vacuum Reyrolle LMVP Richmond T1 Incomer Vacuum Reyrolle LMVP Richmond T2 Incomer Vacuum Reyrolle LMVP Richmond Bus Section Vacuum Reyrolle LMVP Richmond Local Service Fuse Sw Reyrolle LMVP Brightwater Redwoods Valley Vacuum Reyrolle LMVP Brightwater Higgins Road Vacuum Reyrolle LMVP Brightwater Ellis St Vacuum Reyrolle LMVP Brightwater Spring Grove Vacuum Reyrolle LMVP Brightwater T1 Incomer Vacuum Reyrolle LMVP Brightwater T2 Incomer Vacuum Reyrolle LMVP Brightwater Bus Section Vacuum Reyrolle LMVP Brightwater Local Service Fuse Sw Reyrolle LMVP Motueka Kaiteriteri Vacuum Reyrolle LMVP Motueka Wildman Road Vacuum Reyrolle LMVP Motueka Tasman Vacuum Reyrolle LMVP Motueka Queen Victoria Vacuum Reyrolle LMVP Motueka Dovedale Vacuum Reyrolle LMVP Motueka Brooklyn Vacuum Reyrolle LMVP Motueka Whakarewa Vacuum Reyrolle LMVP Motueka Pah St Vacuum Reyrolle LMVP Motueka T5 Incomer Vacuum Reyrolle LMVP Motueka T6 Incomer Vacuum Reyrolle LMVP Motueka Bus Section Vacuum Reyrolle LMVP Max Age (Yrs) 34 Avg Age (Yrs) 16.1 Regulators Type Year Wakapuaka No1 McGraw Edison VR32 100A 3 Cans 1991 Wakapuaka No 2 McGraw Edison VR32 100A 3 Cans 2010 Pokororo McGraw Edison Autobooster 100A 2 Cans Cooks Corner McGraw Edison VR32 100A 2 Cans 1993 Kaiteriteri McGraw Edison Autobooster 100A 2 Cans Old House Road McGraw Edison Autobooster 100A 2 Cans Frog Flat Hawker Siddeley 130A Maruia Brentford 130A Kotinga 11/6.6kV Transformer Crompton Parkinson 3 x 1ph 350kVA Kikiwa 22/11kV Transformer Wilson 3 phase Autotransformer 5000kVA 2005 Kohatu 22/11kV Transformer Wilson Double Wound 3000kVA 2005 Tutaki Capacitor Bank 2 x 150kVA Steps 2002 Motupiko Capacitor Bank 8 x 300kVA Steps 2002 Howard Capacitor Bank 4 x 150kVA Steps 2008 Uruwhenua Capacitor Bank 4 x 150kVA Steps 2010 Bainham Capacitor Bank Hira Capacitor Bank 4 x 150kVA Steps 4 x 150kVA Steps Maruia Capacitor Bank 4 x 150kVA Steps 2013 Matariki Capacitor Bank 4 x 150kVA Steps 2014 Mangles Capacitor Bank 4 x 150kVA Steps 2014 Sunrise Valley SVG Static VAR Compensator 300kVA 2018 Network Tasman Asset Management Plan Page 37
38 Air Break Isolators No Average Age Est 66kV kV kV kV Total 788 HV DDO Line Fuses No Average Age Est 33kV kV kV Total 671 Mobile Generators 1 x1000kva Diesel Trailer Mounted x 500kVA Diesel Skid Mounted x 300kVA Diesel Skid Mounted x 150kVA Diesel Skid Mounted 2013 Network kwh Metering Nil Distribution Substations Fenced Padmount Kiosk Overhead Overhead Total Enclosure Platform Single Pole Stoke ,207 2,013 Motueka ,031 Golden Bay Kikiwa Murchison TOTAL ,297 4,537 There are 5 types of Distribution substation: Fenced Enclosure Concrete foundation pad with open bushing ground mounted transformer. Underground cables incoming and outgoing with HV fuse protection typically DDO at remote end of HV cable. Outdoor 11kV termination, transformer, and LV fusing all enclosed by perimeter fence. Transformers 50kVA to 1000kVA. Padmount Concrete pre-fabricated transformer pad, with compact composite transformer/substation bolted down. Underground cables incoming and outgoing. Transformer has lockable HV and LV cubicles and at either end. HV cubicle houses HV cable terminations, switchgear and HRC transformer fusing. LV cubicle houses low voltage fuse board, max demand indicator panel and streetlight controls. Kiosk Small concrete block building housing groundmount transformer, HV switchgear and HRC fuses, LV fuse board and streetlight controls etc. Overhead Platform Steel platform between concrete poles supporting transformers up to 300kVA in size. Open bushing transformer, drop leads on HV side from DDO fuses connected to overhead line. LV disconnector and fuses mounted on pole. Pole Single pole supporting hanger bracket transformer up to 75kVA. Drop leads to exposed bushings on HV side from DDO fuses. Low voltage fusing mounted on low voltage crossarm. Network Tasman Asset Management Plan Page 38
39 Distribution Transformers - Units 0-15kVA 16-30kVA 31-50kVA kVA kVA kVA >500kVA Total Stoke ,014 Motueka ,030 Golden Bay Kikiwa Murchison , ,535 Working Stock Emergency Stock Total Units 1, ,622 Distribution Transformers Capacity (kva) 0-15kVA 16-30kVA 31-50kVA kVA kVA kVA 500kVA+ Total Stoke 6,190 10,000 17,100 22, ,200 55,000 38, ,015 Motueka 3,689 5,960 10,150 15,375 33,050 11,650 10,000 89,874 Golden Bay 4,744 5,505 6,800 8,800 9,837 1,000 1,000 37,686 Kikiwa 2,533 2,265 2,800 2,600 3, ,398 Murchison 2,033 1,840 2,150 2,250 2, ,723 19,189 25,570 39,000 51, ,987 68,650 50, ,696 Working Stock ,272 Emergency Stock ,600 Total kva 19,686 26,320 39,600 51, ,187 68,650 50, ,568 Distribution Transformer Age Profile Units Polemount Groundmount Age (Years) Network Tasman Asset Management Plan Page 39
40 Low Voltage Networks The urban LV networks in this region are a mixture of overhead along one side of the street, and underground along both sides of the street. Urban LV networks from distribution transformers are run in open rings with limited transfer capability from one substation to another. The urban LV network is approx 50% underground. The rural LV networks tend to be mainly overhead, with underground only in newer rural subdivisions. Generally rural LV networks are not contiguous. Further information on the low voltage network is given in the Network Lines and Cables table and Age Profile charts at the beginning of this section. Service Boxes No Average Age Est All Concrete Pillar Concrete base All PVC Total 12, NETWORK VALUATION The Regulatory Asset Base value of the network is as follows: Asset Class Actual 31-Mar-2018 ($000) Forecast 31-Mar-2019 ($000) Distribution Cables 53,165 55,444 Distribution Lines 24,547 24,618 Distribution Subs and Transformers 24,204 23,303 Distribution Switchgear 7,826 8,240 Other Network Assets 13,737 12,600 Subtransmission Cables 9,616 9,424 Subtransmission Lines 8,051 7,910 Zone Substations 23,408 23,019 Non Network Assets 3,096 3,692 TOTAL 167, ,250 Network Tasman Asset Management Plan Page 40
41 4 NETWORK PERFORMANCE The performance of the network is measured in terms of asset performance, asset effectiveness and asset efficiency. These are discussed in this section. 4.1 ASSET PERFORMANCE Supply Reliability Supply reliability is measured and summarised in terms of consumer minutes lost each year due to network outages both planned and unplanned, and also in the number of consumer interruptions there are. Dividing the latter figure into the former yields the average duration of supply interruptions. The industry standard performance indices are SAIDI, SAIFI and CAIDI. These are defined as follows: SAIDI System Average Interruption Duration Index SAIDI = Total Annual Consumer Minutes of Non Supply Total Number of Consumers SAIDI is a measure of the number of minutes that a consumer on the network can expect to be without supply each year. SAIFI System Average Interruption Frequency Index SAIFI = Total Annual Consumer Supply Interruptions Total Number of Consumers SAIFI is a measure of the number of times each year that a consumer on the network can expect the supply to go off. CAIDI Consumer Average Interruption Duration Index CAIDI = Total Annual Consumer Minutes of Non Supply Total Annual Consumer Supply Interruptions CAIDI is a measure of the average duration in minutes of supply interruption. The historical trends in supply reliability of the NTL network and the targets for the future are shown in Appendix C and in section 4.7. The charts show SAIDI performance broken down by type of outage (Planned/Unplanned, Transpower Grid/Network Tasman Distribution), and by outage cause. Analysis of the charts reveals the following points: The breakdown of causes of unplanned outages shows that the major causes of outages are external events such as vehicle collisions, bird strikes to overhead lines, contractors' cranes or tree felling interference. SAIDI from such sources averages 40 points each year. The second largest source of unplanned outage minutes on the NTL network is from equipment faults which has averaged 15 minutes per year. Methods of reducing network outage consequence and network susceptibility to external interference have been considered and many have been implemented. The capital works plan contains a number of ongoing network enhancements aimed at reducing the frequency, extent and duration of unplanned outages. The strategies include breaking up feeder circuits, installing more line circuit breakers, introducing automation, increasing conductor spacing, identification and elimination of failing line hardware etc. Network Tasman Asset Management Plan Page 41
42 Analysis of reliability within each supply region reveals as expected, that the reliability of supply in rural areas is less than that in the urban areas. In particular, the Kikiwa and Murchison GXP regions suffer the poorest reliability, this being a function of the remoteness of the load centres from the supply substation, the very low consumer density in these areas, and the lack of alternative supply circuits. Planned outages on the distribution network have increased in the past few years due to less work being done live line on light copper conductors for safety reasons. Means of improving planned SAIDI from planned work will include deployment of temporary generators where practicable. The ten year programme of light copper conductor replacements will require more than previously experienced planned outages to complete. Two of the supply regions are dependent upon single transformer supply sites (Murchison and Motupipi). Shutdowns of the whole supply region are required to complete transformer maintenance activity at these sites. Investigations to identify means of averting the shutdowns at the NTL Motupipi substation have been completed. A capital upgrade solution is now planned for the substation in ASSET EFFECTIVENESS 1. Supply Quality Supply quality relates to the voltage delivered at the end use consumers connection point over the range of loads that the consumer has contracted for delivery. The tolerances are mainly specified within the Electricity Regulations and in various industry codes of practice. The parameters of supply quality are: Voltage magnitude Harmonic level Level of interference NTL aims to supply all end use consumers with supply quality that meets or exceeds the relevant regulatory standards. In order to achieve this, it designs and develops the network to meet allowable maximum voltage drop standards for worst case loading scenarios. These design standards are incorporated both into the design and construction standards for network extensions and into the company s upper network planning processes. In order to achieve the required voltage tolerance at each consumer network connection point (NCP), it is necessary to allocate the voltage drops across all components of the network between the last voltage regulated supply point and the consumers NCP. A chart detailing design regulation across network components is attached as Appendix H. This chart shows the design maximum voltage drops at minimum and maximum loads for each of the high voltage lines, transformers and low voltage lines. This allocation is designed to provide standard voltage at the consumer s switchboard with a tolerance of +5/-3%. This tolerance is tighter than the current regulatory standard of +/-6%, however it is chosen as a design standard to give +/-5% at the consumer s switchboard. It also makes allowance for abnormal system conditions or error. It has also been empirically proven to give correct voltage for the expected range of conditions on the NTL network. There are a small number of supplies in the rural area that are still operating on original low voltage supply lines that were designed for low capacity electricity supply. Typically, these are old dwellings connected to light overhead low voltage distribution lines. Over the years the houses have been modernised with appliances added and new electric hot water systems installed. The increased load on these systems results in Network Tasman Asset Management Plan Page 42
43 excessive voltage drop and maloperation of appliances. Other voltage complaints arise from faulty connections within the low voltage distribution. The key performance indicator for adherence to the supply quality standards is the number of proven voltage complaints that come about each year. 2. Contractual Performance NTL has specified standards for fault outage response within its Use of Systems agreement (UOSA) which is the basis of the contract with its energy retailer consumers. The network configuration and fault response systems are designed around meeting these targets for expected fault outage situations. The response standards for restoration of supply after general network fault notification are 6 hours for urban consumers and 10 hours for rural consumers. 3. Environmental Performance NTL seeks to take a responsible approach to management of the electricity distribution network in the local environment. It will seek to avoid, remedy or mitigate any adverse effects on the environment including discharge of contaminants, unreasonable noise, or unreasonable visual impact. It will design and operate its network with this aim in mind. One measure of environmental performance has been selected. This is the number of incidents of noncompliant emissions. This includes contaminant spill incidents. The target for this measure is zero. 4. Safety An important driver of the asset management process is safety. NTL aims to design, construct, operate and maintain its electricity distribution assets in a manner that ensures safety for all stakeholders and the general public. Five measures of safety performance are used as follows: The first is the number of serious harm incidents with contractors and staff whilst working on the electricity distribution network. The second is the number of injury or serious harm incidents experienced by members of the public in conjunction with the electricity network operation as reportable under the Electricity Act The third is the number of significant property loss or damage incidents experienced by member of the public. The target level for each of these measures is zero. Two additional measures of public safety performance are used as indicators to gauge the potential for public safety events and for the identification of trends in this area. These are as follows: Reported incidents that had the potential for serious harm to any member of the public. Reported incidents that had the potential for significant damage to any property of members of the public. The four public safety measures are Key Performance Indicators that have been recommended by the Electricity Engineers Association for incorporation into Public Safety Management Systems. The use of these recommended KPI s will allow alignment with other industry participants for the purposes of benchmark comparison. The company has reporting processes in place to ensure the complete and accurate collection of data. Network Tasman Asset Management Plan Page 43
44 4.3 ASSET EFFICIENCY 1. Thermal Efficiency NTL aims to operate a thermally efficient system. Although energy losses are inevitable, it is environmentally and economically responsible for ensuring that system losses are kept as low as possible. Losses are derived from thermal losses in lines and transformers and also from unmetered supplies. Historically the loss percentage (net energy imported/exported over energy imported) has run at approx. 5-6%. 2. Distribution Transformer Capacity Utilisation Capacity utilisation is measured and reported annually under the Information Disclosure Regulations. This is a measure of how well assets employed in the system are utilised. NTL aims to hold or improve its current utilisation. 3. Financial Efficiency NTL s mission is to provide a reliable electricity network while increasing consumer value. In order to do this, it needs to carefully manage costs. A measure of financial efficiency of the distribution network operations is required. Network costs are required to be disclosed by lines companies every year under the Electricity (Information Disclosure) Regulations. This allows NTL to benchmark its financial performance against all other lines companies in NZ. Due to the differences in costs of operating and maintaining networks of varying urban/rural mix, benchmarking exercises need to consider consumer density (consumers/km line). Total costs include all direct and indirect costs of operating and maintaining the electricity distribution network. The mix of direct and indirect costs may vary between distribution network companies depending on company structure and also on how many functions are contracted out. Depreciation charges may also vary depending on the age and size of networks and on valuations. To remove benchmarking variance brought about from these sources the measure of Total cash operating costs per consumer has been selected as an indicator of financial efficiency. This measure will give shareholders an indication of trends in NTL s financial efficiency given its other service measures, and also of its position against lines companies in NZ. NTL has an objective to achieve 1 st quartile industry performance in this measure. 4.4 PERFORMANCE OBJECTIVES Asset Performance The performance targets for all planned and unplanned interruptions on the NTL network for the period of this plan are as follows: Network Tasman Asset Management Plan Page 44
45 SAIDI Transpower Planned Transpower Unplanned Total Transpower NTL Planned NTL Unplanned NTL Total Overall SAIDI Actual 1995/ / / / / / / / / / / / / / / / / / / / / / / Forecast 2018/ Target 2018/ / / / / / / / / / SAIFI Transpower Planned Transpower Unplanned Total Transpower NTL Planned NTL Unplanned NTL Total Overall SAIFI Actual 1995/ / / / / / / / / / / / / / / / / / / Network Tasman Asset Management Plan Page 45
46 2014/ / / / Forecast 2018/ Target 2018/ / / / / / / / / / / CAIDI Transpower Planned Transpower Unplanned Total Transpower NTL Planned NTL Unplanned NTL Total Overall CAIDI Actual 1995/ / / / / / / / / / / / / / / / / / / / / / / Forecast 2018/ Target 2018/ / / / / / / / / / Network Tasman Asset Management Plan Page 46
47 Asset Effectiveness The performance targets in the area of asset effectiveness are as follows: Service Criterion Key Performance Indicator Annual Target 2019/20 to 2028/29 Actual 2017/18 Forecast 2018/19 Supply Quality Number of proven voltage complaints Contractual Breaches of UOSA Performance Environmental Incidents of non-compliant emission from Effectiveness network. Safety Staff and Contractor serious harm incidents Safety Public Injury incidents Safety Public Property damage incidents Safety Incidents with potential for Public Injury Safety Incidents with potential for Public Property damage Asset Efficiency The performance targets in the area of asset efficiency are as follows: Service Criterion Thermal Efficiency Transformer Utilisation Financial Efficiency Key Performance Indicator Annual Target 2019/20 to 2028/29 Actual 2017/18 Forecast 2018/19 Network Losses 6% 5.8% 5.8% KVA distribution transformers/peak demand 30% 29% 25% Cash operating costs per consumer $301 $291 $285 All of the service level targets are measurable from existing business systems in place. These are subject to audit. Many of these service level targets are required to be disclosed annually under electricity industry information disclosure regulations. 4.5 JUSTIFICATION FOR SERVICE LEVEL TARGETS Asset Performance Unplanned Outages - Reliability The reliability performance targets are derived from a combination of studies of historical performance, consideration of future works, network analysis, benchmarking with other lines companies of similar characteristics and from consultation with consumer groups that has been undertaken by the company over a long period of time. The process of setting unplanned event targets firstly considered historical performance by feeder to establish expected frequency rates of fault outage. Network unreliability is now dominated by external causes and historical rates provide useful information as a basis for the development of future targets. Adjustments were made for the effects of improvements brought about by targeted maintenance regimes, capital works and improved vegetation clearance that have now been deployed. The results of this were then incorporated into a network reliability analysis taking into account the expected effects brought about by growth in customer numbers and by the implementation of capital development projects as detailed in the Network Development plan. Network Tasman Asset Management Plan Page 47
48 This analysis is reviewed annually. The 2017 analysis results show that medium term targets for unplanned events of SAIDI 75, SAIFI of 1.07 and CAIDI of 70 are appropriate and achievable. The results of the historical performance analysis for unplanned outages showing the contributions by feeder to annual SAIDI statistics is given in Appendix J. This chart shows that aside from approx. seven feeders, most feeders contribute 0-3 SAIDI points per year to the total. The worst performing feeders are generally two types. Firstly, 33kV feeders, which have a low fault incidence but a high number of SAIDI points per fault. This is due to there being a large number of consumers supplied. Secondly very long rural 11kV feeders. Due to their length they have a high incidence of faults, and each fault tends to have a reasonably high number of SAIDI points involved due to the time taken to determine the fault source and make repairs on a distant line. Fault outage data over the past 5 years, shows that our average unplanned SAIDI over the period is 98 points. This average however includes the effects of extreme weather events and earthquakes. The average unplanned SAIDI discounting extreme events is 77. The list of major projects over the next five years and their expected effect on the performance of the feeders is given in the table below: Project Year Feeders affected Improvement effected SAIDI benefit Annesbrook Substation new feeder Pascoe St 11kV Feeder shortened 0.25 Waimea West 33kV Railway Reserve Alternative circuit provided 3 Interconnection 33kV Capacitor Banks N/A Voltage support under emergency 0 Motueka/Motupipi conditions Motupipi Substation Upgrade N/A Substation security improvement. 20 Motueka Substation Upgrade Whakarewa, Queen Additional Urban Feeders reduces 1 Victoria extent of existing urban feeders Wakapuaka Substation Hira Feeder shortened/broken up 0.5 Development Brightwater GXP Hope 33kV, Railway Feeders shortened/broken up 1 Reserve 33kV Riwaka Zone Substation Brooklyn, Feeders shortened/broken up 2 Kaiteriteri, Pah St. TOTAL The worst performing feeders are subject to improvement through the implementation of AMP capital projects programmed in the next five years, these being mainly the installation of additional reclosers to reduce the areas affected by fault events. Assuming that the rate of fault incidence remains constant for the foreseeable future, these AMP projects should result in a reduction of overall unplanned SAIDI to approx. 75 points. Given the topology of the NTL network, improvement in unplanned outage performance beyond the current level is not possible without considerable additional capital expenditure into network infrastructure. Performance returns per unit capital invested in additional infrastructure would be low. Less capital intensive Investments into operational improvements in unplanned outage restoration however have the potential to yield cost effective results. Network Tasman Asset Management Plan Page 48
49 Planned Outages - Availability NTL s target SAIDI from planned outages has been this year increased from 75 to 100, to take account of shutdowns required to complete the ten year light copper conductor replacement programme which commenced in This programme will require significant additional planned shutdowns over this period. Generators are planned to be utilised as far as is possible during the conductor replacement operations, but as the conductor being replaced is the primary means of distribution, an increase in planned outages for consumers supplied by the re-conductored lines is inevitable. The national average SAIDI figure for planned and unplanned is 192 points. Network Tasman s corresponding target for the period of this plan is 175 points. Asset Effectiveness Supply Quality Consumer feedback indicates that consumers are happy with the quality of supply that they receive in terms of flicker level, sags/surges etc. and that they would not wish to pay more for improved supply quality, but would not wish to see the existing standard of supply quality drop. The measure of proven voltage complaints each year is a direct measure of supply quality. The level of this measure is varies at between 5 and 10 per year. Targeting a continuation of this level is therefore justified. Contractual Performance NTL has processes in place to ensure that all responses required by its UoSA normally occur automatically under all but the most extreme circumstances. NTL has succeeded in operating without breaching UoSA standards for some years in the past. The target of zero breaches is therefore achievable. Consumer feedback suggests a continuation of current performance and price rather than a reduction of performance and price. This provides the justification for this KPI target. Environmental Performance Network Tasman operates its network with very low levels of emissions. The target level selected is based on continuation of high levels of environmental performance in line with historical performance. Feedback from stakeholders is that they have an expectation that the environmental performance of the company should not degrade over time. This justifies the target of zero. Safety The target levels selected are based on continuation of high levels of safety in line with historical performance. The worker safety targets are linked to the performance contract between NTL and its principle works contractor Delta Utility Services Ltd. This justifies the target level set. Asset Efficiency Thermal Efficiency NTL aims to operate a thermally efficient system. Although energy losses are inevitable, it is environmentally and economically responsible for ensuring that system losses are kept as low as possible. There is a law of diminishing returns in the pursuit of loss reduction. System modelling and analysis has shown that bringing losses below 5% would require significant capital investment into replacing the existing transformer stock with Network Tasman Asset Management Plan Page 49
50 lower loss transformers and reconductoring or upgrading voltage in rural networks. The very large expenditures involved cannot be justified on the basis of incremental loss reduction. Continued financial performance for stakeholders requires that the company makes capital investments that show appropriate returns. Setting a target for the continuation of existing losses at 6% is therefore sensible and justified. Capacity Utilisation Capacity utilisation is measured and reported annually. This is a measure of how well assets employed in the system are utilised. NTL s targets are in line with the industry average for this measure which is 30%. NTL aims to hold or improve its current utilisation at the industry average. The target levels set are in accordance with this goal and are justified. Financial Efficiency The target level selected is based on the projected costs of continuation of the operating efficiency service levels targeted and assumes continuation of the current company structure and existing economic environment. NTL aims to maintain or improve its relative industry position over the period of this plan, and has a long term strategic goal of being in the industry first quartile for financial efficiency. Targets going forward include adjustment for inflation. Consumer Consultation Following from process of feedback from consumer consultation work to date, and via the Network Tasman Trust, the resulting service levels are believed to be in line with consumer expectations and appropriate given the geography, network layout, weather conditions and consumer distribution of the Tasman area. In order to match supply reliability to customers expectations, NTL assesses customer satisfaction with their existing supply reliability by both direct and indirect means. In addition, large customers are explicitly asked if they would like additional supply reliability. Consumer consultation undertaken to date, including a survey undertaken during 2018, indicates that NTL consumers are happy with both the reliability and quality of electricity supply and with the price paid. An overall network performance satisfaction rate of 96% was recorded in the latest survey, with the majority of consumers (73%) stating that any increase in price would be too much to pay for an improvement in current performance. Further details of the 2018 consumer consultation outcomes are given in Appendix K. The reliability and financial efficiency level targets outlined in this section of the plan are also corporate objectives of NTL. The same service level targets are listed in the Network Tasman Statement of Corporate Intent (SCI). The company SCI is available on our website Performance measures of the company are set in conjunction with the Network Tasman Trust, which owns the company on behalf of the consumers through the SCI. Network Tasman Asset Management Plan Page 50
51 5 NETWORK DEVELOPMENT PLAN 5.1 INTRODUCTION This section outlines the plans of capital expenditure on the NTL network for the 10 year period The plan is based on demand growth rates for the NTL network as outlined in Appendix B. The resulting development project plan is based on maintaining the security design standard and network performance standards of the previous section whilst accommodating this load growth projection. The development planning process has the overall aim of developing the network in a timely manner and in a fashion that maintains the levels of supply quality, reliability and security required for our consumers. This aim is aligned with the corporate objectives of the company as discussed in Section NETWORK DEVELOPMENT POLICIES NTL aims to develop its distribution network in order to maintain quality, reliability and security of supply in line with the standards specified in this document. Prudent asset management planning takes a long term view of network development to ensure that the following criteria are met: Financial and technical risk is managed through optimised asset utilisation achieved through long term planning. Environmental effects of distribution network assets are minimised. Asset lifecycle costs are minimised and asset quality is maintained to ensure ongoing reliability. Formulation of Network Development Projects and Development Path The process of formulation of network development projects comes from network analysis studies in the light of expected load growth. During this process, future network loading scenarios are modelled using loadflow software and network constraints and regions of non- compliant voltage are identified. Section 5.9 discusses the detailed network constraints identified from this projected network loading analysis. A series of development project options is generated to remove the identified network constraints or correct the projected voltage profile. This series of options is then considered collectively to form a view of the most likely overall medium to long term development path. Consideration of technical and economic efficiency, ongoing compliance with the network security standard, and management of risk of non-supply are part of the process of formulation of the medium to long term Network Development Plan. Section 5.9 details the resulting likely network development path and its constituent projects by layer of the network supply hierarchy. Prioritisation of Network Development Projects Capital projects are generally prioritised using the following criteria: 1. Development or renewal projects that are being undertaken to remove or mitigate a significant public safety hazard. 2. Development or renewal projects that are being undertaken to remove or mitigate a high risk of uncontrolled loss of supply to existing consumers. 3. Development projects that are required to provide supply capacity for new consumers. 4. Development projects that are being undertaken to generally improve supply reliability. 5. Development projects that are being undertaken to generally improve supply security in line with the NTL security standard. Network Tasman Asset Management Plan Page 51
52 Depending on actual load growth outcomes against predicted load growth timing, the risk profile and ranking of various projects may change over time and sometimes over a relatively short time period e.g. an unexpected large industrial load. Such developments will cause a revision of the capital works plan and may result in a change in the priority and time that specific development projects are finally implemented. A sudden change in network conditions brought about by the unexpected failure or early end of life of one or more major items of plant may also result in re-prioritisation of capital projects. The Network Development Plan is reviewed each year as part of the Asset Management Plan review. The Development Plan projects are priority reviewed through the following process: 1. Complete Demand Forecast review process (refer section 5.8) 2. Run Loadflow and System Analysis to identify network constraints and order of occurrence. 3. Review Network Development plan and proposed projects and their timing and order of implementation in light of results of steps 1 and Review Public Safety Hazard Register. 5. Review Network Security against Security Policy. 6. Finalise Project Priority in light of step 5 using capital project prioritisation criteria. Capital Expenditure Approval Process NTL capital expenditure policy requires that capital expenditure projects above $100,000 in value are individually approved by the board of directors. In order to gain approval, a comprehensive business case must be developed. Business cases include an analysis and evaluation of alternative options for the project. Alternatives considered may be asset based solutions such as line upgrades, additional circuits, network reconfiguration, or voltage support techniques such as regulators or capacitors. Non asset based alternatives are also considered in project business plans and these may include load control measures, distributed generation etc. Project business cases consider projects in the context of both short term and long term network development strategy. 5.3 NON ASSET SOLUTION POLICY Evaluation of appropriate non-asset solutions is included in the network planning and business case development processes. In particular, where large lumps of capital investment are required to meet short term peak loads, then the deployment of demand side management techniques such as ripple control of storage loads is considered. NTL aims to develop a network that is constraint free under normal conditions and under the failure conditions defined by its security standard. Existing network constraints are listed in Section 5.9. NTL does not seek to contract with other parties for the provision of means of removing network constraints. NTL is of the view that the distribution network asset operates to an extremely high level of reliability and availability which is difficult to replicate by deployment of non-network solutions. Having said this, it will consider non network solutions other than load management systems under its direct control, in cases where the reliability of the non-asset solution is comparable with that of the network upgrade solution and when failure of the non-asset solution will not affect NTL s ability to meet its obligations to supply consumers other than the operator of the non-asset solution. At the high level network planning stage, deployment by consumers of non-asset solutions such as home energy management systems, small distributed generation and the effects of these on network loadings are considered. Such developments have had application in the Nelson area, but to date the overall effect of the developments on network demand has been minor. Forward planning remains cognisant of developments in the areas of demand side solutions. Network Tasman Asset Management Plan Page 52
53 For each of the major upgrade projects in this plan, all options including non-asset solutions are considered in the business case for the project. Options typically considered include voltage support via switched capacitors, use of regulators, feeder distribution voltage change, local generation, load division by provision of additional feeders etc. The company assesses the availability of non-asset solutions that may have practical significance for each project. These are typically location specific and may take the form of localised distributed generation. Such solutions are assessed for their ability to reliably and practically address the network constraint through being able to generate at the times of system constraint. The costs of operating are also taken into account. 5.4 DISTRIBUTED GENERATION POLICY NTL has an open access policy and welcomes the connection of all forms of distributed generation on its network. The benefits of reduced network losses, and the potential for reduced transmission demand based charges through cooperative operation are well recognised. NTL will also comply with the requirements of the Electricity Industry Participation Code for the connection of distributed generation. There are many examples of distributed generation operating within the NTL network at present, including photovoltaic solar generators and micro hydro plants. Prior to the connection of new distributed generation, it is necessary for studies of the operating conditions of the new generator at the point of connection with the distribution network to be completed. These studies identify issues that may affect existing network assets or other users of the network. Examples include asset overload or introduced effects such as voltage rise or voltage disturbance creating interference with other connected consumer s supplies. Operation of the generating plant under network fault conditions and provision of means to isolate the generation during times of network maintenance are also required to be understood and managed. Deployment of NTL operated local generation is considered as an alternative to incremental distribution asset as a part of the network development planning process. This is an option particularly applicable when seasonal peak loads occur such as in holiday areas or seasonal/temporary loads such as crop harvesting. NTL owns and operates four mobile diesel generators ranging in size from 150kW to 1MW. Network Tasman s current policy is to apply line charges only to load taking ICP s. Small scale distributed generation ICP s currently therefore do not attract line charges. Where generators are exporting to the network at peak load times, avoided transmission charges may be payable to the generator. Any capital investment in the network needed to accommodate an incremental generator must be funded by the generator. During the process of establishment of a generating ICP, a point of connection defining the boundary between NTL s network and the generator s installation will be agreed. This point will generally be a point of electrical isolation between the two systems. Further information for prospective operators of distributed generation in NTL s area can be found in the Network Tasman Distribution Code. This is available on NTL s website at PLANNING CRITERIA Network Development Planning Network development planning aims to continuously develop the network in a timely fashion, so that it can economically and efficiently support the loads to be placed on it. In planning the network, the following criteria are applied: Voltage regulation to be at all times within acceptable limits. (ref section 4.1) Network Tasman Asset Management Plan Page 53
54 System security to be consistent with Security Design Standard. (ref section 5.3) Urban subtransmission and zone substations planned using standard capacities (subtransmission 23-34MVA, zone substations 23MVA, distribution feeders 6MVA). Rural networks planned around economic selection of conductors and components. Compliance with all applicable Acts and regulations. Mechanically and electrically safe. Minimised environmental impact. Economic Viability Capacity Determination for New Assets The capacity of new upper network components (33kV subtransmission circuits, Zone substations, 11/22kV Distribution feeder circuits) is determined by consideration of the following initial criteria: Current and likely future electrical loading under normal and contingency conditions. Current and likely future fault level. Likely mechanical loading i.e. wind and snow. Likelihood of incorporation into future network re-arrangement e.g. ring circuits or conversion to main feeder. All new and upgraded 11kV and 400V installations are designed and constructed in accordance with a published design and construction standard. (ref: Network Tasman Design and Construction Standards). The Network Tasman Design and Construction Standards prescribe the design process to be followed in order to determine appropriate design capacities for new reticulation such as residential and industrial subdivisions. The Design and Construction Standards also prescribe standardised and approved components matching the determined capacities of all types of components. Examples are standardised LV and HV aerial conductors, standardised LV and HV underground cables etc. 5.6 NETWORK SECURITY POLICY The network security policy provides for higher reliability in urban networks than rural areas and in particular a higher standard of security for urban industrial and commercial power supply. Additionally, individual customers and/or customer groups can be provided with additional supply security if they are willing to pay. In order to effect this, a design standard for the components of the supply system is needed. This standard must take into account the expected rates of failure of the network components, represented by Mean Time Between Failure (MTBF), expected Mean Time to Repair (MTR), and also the number of consumers likely to be affected by a component failure. The NTL network security design standard incorporates the above parameters for the following components of its network: 66kV and 33kV subtransmission lines and cables Zone substations 22kV and 11kV lines and cables Distribution transformers 400V overhead lines and underground cables Overhead lines at all voltages have a higher failure rate than underground cables, but they have a much shorter repair time. Typically, an overhead line fault can be located and repaired within four hours, whereas a cable fault may take up to 36 hours or more to locate and repair. Also, typically, the higher the operating voltage of the line or cable the more consumers are affected. Zone substation transformers are the most capital intensive and technologically specialised components on the distribution network. Faults within them can take days or even months to rectify. They are also typically items that supply large numbers of consumers. Therefore a high level of redundancy is needed for these Network Tasman Asset Management Plan Page 54
55 components. Where this is not built into the in-service network then contingency plans for the loss of such units are required. The failure rate of these units is generally very low. Distribution substation transformers are much smaller and technically less complex than zone substation transformers. Failed distribution transformers can be replaced by spares within a few hours. 5.7 SECURITY DESIGN STANDARD The standard for the design and operation of the NTL network is represented by the chart below. This standard allows for supply to be restored to all consumers following any single failure contingency within approximately 18 hours. Double coincident failure events are not incorporated into the NTL standard. Such events are dealt with by the company s Risk Management and Disaster Recovery Plans. The security design standard is a long term network objective. Timing for the implementation of development projects to comply with this standard will be subject to economic, location, growth forecasts and alternative contingency evaluation on a case by case basis. The inclusion of any project in the 10 year network development plan is subject to business case evaluation and no reliance should be placed on any project proceeding. Group Peak Demand Over 10MVA 5-10MVA Up to 5MVA 2-5MVA Up to 2MVA Up to 2MVA Up to 1MVA Load Classification Major Zone Substation Minor Zone Substation Urban Distribution Feeder Rural Zone Substation Rural Distribution Feeder Remote Rural Distribution Feeder Urban LV Network Customer Security Impact Level Over 5,000 N-1 (note 1) 2,500-5,000 N-1 (note 2) Up to 2,000 N-1 (note 2) Time to restore first contingency 100% GPD immediate restore 100% GPD restore within 3 hours 100% GPD restore within 3 hours 1,000-2,500 N 50% GPD restore within 3 hours 100% GPD restore within 6 hours Up to 1,000 N 100% GPD restore within 6 hours Up to 300 N 50% GPD restore within 6 hours. 100% GPD within 12 hours Up to 300 N 100% GPD restore within 6 hours Up to 500kVA Rural LV network Up to 50 N 100% GPD restore within 12 hours Time to restore second contingency 100% GPD in repair/switching time 100% GPD in repair/switching time 100% GPD in repair/switching time 100% GPD in repair/switching time 100% GPD in repair/switching time 100% GPD in repair/switching time 100% GPD in repair/switching time 100% GPD in repair/switching time Note 1. Denotes full N-1 contingency with break for automated switching. Note 2. Denotes N-1 contingency with break for manual switching. Exceptions to the above standard are: 1. The 33kV supply from Stoke to the Lower Queen St substation (25MVA) is a dedicated supply circuit to Nelson Pine Industries and it has an N only security level supply, as agreed with the consumer. 2. The 33kV supply to Mapua substation (5MVA) incorporates a 4 core cable circuit, with each core spaced approx. 150mm from the others. Three cores are required for service, and there is a spare core. In the Network Tasman Asset Management Plan Page 55
56 unlikely event of two cores being damaged coincidentally, then an outage of up to 18 hours would result. 3. The Motupipi subtransmission substation (6MVA) has a single 4 x 1 phase transformer bank configuration, requiring approx. 6 hours to change out a unit following failure. 5.8 DEMAND FORECAST The fundamental requirement for long term network planning is a sound demand forecast. The risks to NTL s asset management program associated with a poor demand forecast includes amongst other things; the potential for over or under investment, inability to meet demand, severely underutilised assets and the potential for significant optimisation of assets in future valuations with corresponding impacts in price movements and financial performance. This AMP is based on a comprehensive demand forecast using the most current information available. Information from Local Territorial Authorities Population forecasts provided by the Local Territorial Authorities (LTAs) should form the basis of any forward projections in demand since it is the LTAs that should have the best information to provide forecasts based on known and promoted development. TDC recognise the dangers with their asset management planning for water, sewer and storm-water assets based on inaccurate forecasts. To-date there has not been any coordinated growth model developed. TDC and NCC are now working towards a 20 year footprint of development because of the unprecedented growth in the region. This 20 year footprint study is designed to include a residential and industrial growth forecast model which incorporates more science in the development of the forecasts. Currently, the best information available is forward population forecasts prepared by NZ statistics. Actual population growth is influenced by the availability of land, land zoning, provision of services and other infrastructure. Local Authority strategic plans therefore have a fundamental influence on the shape of future population projections as do private landowners since once land is rezoned, it is not necessarily redeveloped. Demand Forecast Methodology Step1. Identify Population Growth by District NTL s demand forecast is based on historic feeder loadings which are extrapolated using NZ Statistics population forecasts given for each area unit/district. The growth rates in each district are identified and checked with historical line connection growth rates. This information is also combined with any known development initiatives to refine the high medium and low population forecasts for each area unit/district. Step 2. Translate District Population Growth to Network Feeder Growth After diversity peak demands of 2.8kW per connection are assumed at 11kV feeder level. Domestic load is very weather dependant and the Nelson/Tasman district the peaks occur in winter. These are dominated by domestic space heating requirements on the cold cloudy days. The peak domestic load outturn in any particular year is highly dependent on how cold the weather is through the period June-August. Experience shows that there is an approx. 7% variation between the peak demands of a warm winter and a cold winter. Warm winters can mask the latent load that builds up with ongoing domestic load growth. Network Tasman takes a prudent approach by using after diversity peak demands recorded from cold winters when building up the demand forecast. A lower network forecast is firstly developed by combining 11kV feeder load forecasts into zone substation forecasts and then 33kV feeder load forecasts by combining zone substation forecasts. Network Tasman Asset Management Plan Page 56
57 This is then adjusted for industrial spot load information and planned load transfers in order to derive individual feeder demand forecasts and zone substation demand forecasts. Consumer expansion projects have major effects on the timing of capital expenditure in this plan. The advance information received from consumers has in the past sometimes proved unreliable, both from a load magnitude point of view and from a timing point of view. The growth plans of large consumers and any changes that they make can have a major influence on whether or not the capital expenditure plan eventuates in practice. Individual load expansions greater than 2MW are defined as large expansions that are treated specifically. The unexpected development of large expansions may cause significant changes to individual projects and a review of the programme of subsequent projects. Distributed generation developments are incorporated when known generation patterns have emerged. When generation patterns are known, they are incorporated into the load forecast as a negative load at their point of injection at the time of system peak. A factor is applied to generator maximum output depending upon its historic availability and probability of being available at the time of system peak. Then as the load matrix is built up, the effect of each distributed generator on the peaks at each level of the network is accounted. Step 3. Combine Upper Network Growth to develop Regional Demand Forecasts Finally, GXP forecasts are developed from the consolidated 33kV feeder forecasts. Diversity across the elements is allowed for at each combining step. Following diversity allowances in the forecast development process, the after diversity peak demand per new connection decreases to approx. 2.0kW at GXP substation level Embedded Generation The total uptake of small scale distributed generation such as solar panels and small wind turbines, is progressing at a steady rate, in the Nelson area. There are approx. 740 installed photovoltaic generation sites on the network at present representing 1.8% of total ICP s. This is the highest percentage of ICP s with solar generation in NZ. Total installed solar and wind generation across the network is 2.9MW or 2.5% of the total network load. Solar PV generation has a negative effect on consumption with no effect on peak network loading. This effect is due to the timing of domestic load peak demand which is on winter weekday evenings after sunset. Solar generation therefore has a significant effect on incremental growth in consumption. Ongoing growth in PV distributed generation will likely have a detrimental effect on system load factor. This has been taken into account in the 2019 demand forecasts. Modelling of the potential effects on the distribution network of various future PV generation scenario s is being undertaken at present. Steps to avoid potential network voltage management problems due to high solar PV penetration levels in the future have been taken and are ongoing. These include ensuring that generation in LV networks is within the capacity limits of the networks and that it is balanced across the three phases of the supply. Inverter configuration settings that will maximise the hosting capacity of the network for distributed generators have also been identified and implemented. The demand forecasts in this plan also include the effects of existing small embedded hydro generators (refer Section 3.2 for details of these). The net effect of the embedded hydro generators is a reduction of peak load of approx. 8% of the Golden Bay region load and 1% of the Motueka region load. The net effect of the small embedded hydro generation on the overall NTL peak load is a reduction of approx 1%. The Cobb power station (32MW) is directly connected to Network Tasman s 66kV subtransmission network. It is therefore not embedded within the distribution and as such does not reduce peak distribution system loads. Network Tasman Asset Management Plan Page 57
58 Experience with new embedded generators to date has shown that generation can be unpredictable for some years even after commissioning has been completed. Load Management NTL operates peak load management as part of a joint initiative by other Upper South Island Lines companies to limit the peak loading on the transmission network supplying power to the Upper South Island. Transpower transmission charges are based on NTL s contribution to the 100 highest peak loads each year. The dominant load in the Upper South Island is Orion Group Ltd which includes the city of Christchurch. Due to the fact that the mix of domestic and industrial load in the Nelson area is similar to the Christchurch area, NTL shares similar characteristics to Orion Group and the networks in both areas tend to experience overall peaks at around 6pm on the coldest winter evenings. Load management strategy operates to remove domestic and commercial water heating load at the times of system peak in order to minimise peak loadings. These loads are restored when the peak load periods have passed. During the early summer period of 2015/16, high loads on the Upper South Island (USI) network were experienced when the irrigation season start up load in south Canterbury coincided with cooler weather. These peaks exceeded some of the previously run chargeable winter peaks. This situation was repeated during the early summer of 2017/18, when high irrigation load in a period of dry weather caused winter peaks to be exceeded. To date in 2018/19, high summer peaks have occurred again when irrigation load has coincided with airconditioning load. It is unclear whether this will become a regular feature of Upper South Island system load management, however it is quite possible that the USI system will become regularly summer peaking due the large volumes of irrigation load that have been added to the network in Canterbury. In practice, the action of load management causes peak loadings of parts of the lower network (i.e. on zone substations and 11kV feeders) to occur after the overall GXP peaks have occurred. This is due to variations in load mix across individual feeders and zone substations, so that those with higher proportions of domestic type load and therefore more controllable load, will experience highest loads when the water heating is being restored. This is also accounted for in the formulation of the load forecast. The demand forecast detailed in Appendix B, takes account for the effect of load management and as a result the GXP peak loads do not contain controlled loads - up to 15MW (10% of total peak distribution network load) of domestic and commercial water heating is switched off at these times. This means that peak distribution network loadings are reduced by approx. 10% through the operation of the load management system. The connection of domestic storage water heaters to an approved ripple control receiver is mandatory in the NTL distribution network area. The 2019 Demand Forecast Summarised demand forecasts for the overall network, each GXP, and for all existing zone substations are given in Appendix B. Specific areas of load growth include: Residential growth over the next decade in the Richmond area, expanding westward and southward towards Hope and in Brightwater and Wakefield townships. The Mapua area and coastal zone between Richmond and Mapua is also expected to show continued strong growth as a domestic housing area enjoying a semi rural coastal environment with reasonable proximity to Nelson city. Most flat land close to Nelson city has been absorbed into residential subdivisions of relatively low load density housing. Richmond and Stoke are seen as ideal areas for retirement and many people move into the region from other larger cities. This has resulted in the development of a number of large rest homes. Further rest home developments are expected in the Stoke supply area. Network Tasman Asset Management Plan Page 58
59 Industrial load growth in the region is expected to continue in the Tahuna area, and in Richmond on the western side. Typically, this will take the form of light manufacturing, seafood processing and packaging, fruit packing, cold storage and timber processing. The Atawhai area to the north of Nelson is a steadily growing residential area. Aquaculture and aquaculture research are industrial activities that are also expected in this area. Further north, subdivision of farmland into lifestyle blocks is occurring The central Motueka area is expected to show moderate growth. Rural blocks in the Waimea Plains and in the Moutere area are being subdivided into farmlets or rural residential blocks providing for many isolated rural line extensions. The Kaiteriteri/Marahau area is an increasingly popular holiday resort and retirement area, and subdivision of coastal land for permanent residences here is ongoing and expected to continue. Hotel and accommodation developments are expected in the area as well. In Golden Bay, like Kaiteriteri, subdivisions for holiday homes and retirement investments are expected near the coastal areas of Pohara, Tata and Collingwood. Hop farming has increased substantially in the Tasman district in the past year, as a result of a rising demand both nationally and internationally for Nelson Hops. Hop processing is an annual short period load in February/March only. The load is a high demand very low load factor load. As a result, hop processing has a high impact on rural supply feeders but it has poor asset utilisation and very poor economics when expensive line upgrades are required. Due to these economic factors, NTL limits the supply capacity that it makes available to rural hop processing operations to cover motive loads only and encourages rural hop processing operators to look to alternative fuels for heating. Development of dairy farms including new irrigation is being undertaken in the rural areas of Golden Bay, Tadmor, Korere, Murchison, Matakitaki and Maruia. Typically, irrigation systems require approx. 100kVA of supply capacity. Most of these areas are currently serviced by long 11kV lines. Capacity upgrades are required to accommodate these on many of the feeders. Capacity upgrades are being provided by the installation of capacitor banks initially. A survey of the longer term plans of dairy farmers has been undertaken. The results of this has caused a review of the upgrade plans for some rural feeder systems. Capital investment into supply upgrades must show an economic return to NTL without increasing existing urban to rural cross subsidies. Large Industrial Loads Expansion of seafood processing is expected to generate a number of applications for increased load in the Tahuna industrial area. The demand forecast has been revised to include these new large industrial loads. This new industrial load will generate the need for an additional 11kV feeder circuit supplying into the Merton Place/Beatty St area from Annesbrook substation. A project to provide this has been included in this year s revision of the development plan. Significant additional cold storage load is also planned in the Stoke and Motueka supply regions. This will generate the need for additional 11kV feeders in the Motueka supply region. The load forecast and programme of network capital development in this plan is based on the best information held by NTL at the time of plan revision. This plan therefore represents NTL s view of the most likely path of load growth and of network development. Electric Vehicles Electric vehicle charging may become a significant load within the planning period. To date however, there has not been significant development of this load in the Nelson area. There are approx. 150 electric vehicles in the Tasman district at present of which 70% are purely electric. NTL is aware of the uptake drivers for electric Network Tasman Asset Management Plan Page 59
60 vehicles and it operates two electric vehicles within its fleet. NTL has installed three fast charging stations in its supply area. We are keeping a watching brief on international electric vehicle technology developments and on the implications for overseas electricity networks where they are appearing. High levels of uptake of electric vehicles have the potential to radically alter load profiles and impose high network capital investment costs if vehicle charging is not aligned to network off peak usage. Load management initiatives such as controlled off peak charging may offer a more cost effective solution for consumer electric vehicle charging. Investigative work is being undertaken at present to identify the potential network impacts of this new load type. Older overhead low voltage distribution networks in particular are expected to require capital investment, especially if charging occurs coincident with existing peak loads on these networks. Communication to electric vehicle owners of the potential impacts on the electricity supply system (including both generation and distribution) and on the environment of charging at peak times may be undertaken by the company. Electric vehicle owners will also be encouraged to take advantage of Day/Night pricing plans offered by retailers. Clustered home based vehicle charging occurring in the evening in winter may impact low voltage distribution circuits in the next few years. NTL is monitoring the uptake and clustering of electric vehicles on its network. Opportunities may exist for cooperative use of the energy storage of the vehicle. This is an area that NTL will also research. The demand forecast of this AMP at present does not take account of potential development of this load. Future demand forecasts and AMP reviews will consider the local developments of this load category. Battery Storage Home energy storage (batteries) may have an effect on NTL s network peak demand in the future. It is too early to predict the timing or magnitude of this however. Factors influencing the effect include the uptake rate of battery systems and the degree of influence that network companies will have over the way the systems are used by consumers. Installed battery storage within the NTL network to date is not significant and it is not yet clear when it will become significant. Home battery systems on the market at present are designed to increase the self-consumption of energy generated from the home solar PV. This is generally advantageous to lines companies as long as the result is reduced household demand at the time of network peak loading. Bulk battery energy storage is generally not yet economic against other energy storage systems such as ripple control or diesel generation. Battery cost reductions of the order of 70-80% are required before bulk battery storage will become an economic option. Domestic storage water heating has already provided a large energy storage element in the NTL network for our use and much of the benefits of energy storage within the network for peak load reduction have already been realised through ripple control of this storage. Domestic and network scale batteries are another energy storage medium that may become economic and available to us in the future for network load management purposes. Network Tasman is keeping a close watch on developments in this space and is keeping itself fully informed. The company will be reviewing options to undertake a limited trial of a battery solution on one of our rural feeders that is nearing capacity. Energy Efficiency Network Tasman Asset Management Plan Page 60
61 The advent of modern energy efficient home appliances and the steady replacement of older appliances with these higher efficiency appliances appears to be having a significant effect on average household consumption such that the annual average consumption in the Nelson area has fallen from approx units p.a to approx units p.a over the last ten years. The effect on household peak demand is less pronounced however. Photo voltaic generation is also contributing to the effect of reduced annual average household consumption but with a lesser reduction in average peak demand. The trend of reducing annual average household consumption is expected to continue. The revised growth forecast is given in Appendix B and the capital expenditure programme is Appendix E. For capital expenditure planning purposes, the following distribution of new consumer connections has been assumed to be connected each year: 2019/20 to 2028/29 Urban Connections Rural Connections STOKE MOTUEKA GOLDEN BAY KIKIWA 0 12 MURCHISON 0 7 TOTAL DEVELOPMENT PLAN - DETAIL Network Classifications Proposed network upgrades are outlined in detail in this section under the following classifications: Transpower GXP s Primary distribution network (33kV) Zone and subtransmission substations 11kV feeders Distribution transformers Urban low voltage lines Rural low voltage lines SCADA/load management system/communications Ripple injection system Distributed Generation Transpower GXP and Transmission Line Upgrades The transmission capacity from Christchurch to Nelson was significantly upgraded with the commissioning of a third 220kV transmission circuit between Islington and Kikiwa in More recently the Stoke GXP substation firm capacity was increased with a major 220/33kv supply transformer and 33kV switchboard redevelopment. At current growth rates, it is expected that further capital investment into the Transpower network in the Nelson area will be required over the planning period of this document in order to maintain security of supply. During 2009, a transmission roadmap was formulated in conjunction with Transpower. Following loadflow studies of the network under projected loading scenario s, a list of development projects and approximate timings has been formulated. In particular: 110/66kV transformer capacity at Stoke (2019) Network Tasman Asset Management Plan Page 61
62 The coincident loads of Motueka and Golden Bay zone substations now exceed the rating of the 110/66 interconnecting bank at Stoke. This means that there is a reliance on the Cobb power station for generation to be on line during peak periods. This upgrade project is the subject of a new investment agreement and is underway at present. New 220/33kV GXP at Brightwater ( ) At around 2023, the load on the Stoke 33kV bus is likely to exceed the firm capacity of the supply. Due to the limitations in bringing further load out from the Stoke GXP in its valley site, a second GXP will be required. This should be sited near the load centre of the incremental growth which will be to the south of Stoke. Connections from this substation to the existing 33kV network can be made. Land was purchased for the site in 2005 and the site was designated as a substation site in This project has a lead time of 2-3 years and it is a very high cost development. Development of this substation will be a cooperative effort between Transpower and Network Tasman. The project timing could be affected by a single large industrial development in the Stoke 33kV GXP supply region. A focus on the GXP load growth and on technological developments that may offer options to defer the project will be required in the interim. Additional Transmission Capacity Southern Lakes Generation to Christchurch: Transpower is at present implementing tactical upgrades to existing lines and a programme of transformer capacity upgrades and voltage support device installations. These are expected to delay the requirement for major new transmission lines until at least kV Subtransmission Network Upgrades The 33kV network is designed to the standard that each zone substation in the urban area has sufficient firm capacity in 33kV supply circuits to carry the peak load on the substation. This is made available by the provision of alternative circuits that can be switched into service in the event of a primary circuit line or cable failure. Some rural zone substations have no 33kV line backup. In general, all 33kV overhead lines can be repaired within half a day in the event of insulator failure or single pole failure. Wider spread damage tends to be much more catastrophic but far less likely. Most 33kV cables can be repaired within 24 hours after the faulted section has been located. The substations with firm capacity in 33kV supply are Annesbrook, Songer St, Richmond, Hope, Founders and Brightwater. The substations without full firm capacity in 33kV supply are Lower Queen St, Mapua, Eves Valley, Takaka and Swamp Rd. Six specific 33kV network development projects have been identified. These are: a. The installation of a replacement 33kV underground cable at Songer St substation to boost the reserve capacity available in the backup 33kV feeder (2019/20). A short section of existing 33kV cable in the Railway Reserve feeder at Songer St substation will become capacity constrained due to load growth in the Richmond/Brightwater area. When the Brightwater GXP project is completed, this cable circuit will be reconfigured to form the Songer St A feeder circuit and become dedicated to the Songer St substation. This project has an estimated cost of $150,000. b. Extension of the 33kV network with an underground cable installed between Waimea West and Ridgeview Road (2019/20). This extension will provide an alternative route to the Appleby highway 33kV line feeding Mapua substation. This section of overhead line is prone to vehicle interference. This project has an estimated cost of $2.8m. c. Installation of four new 33kV feeder cable circuits linking new Brightwater GXP substation with existing 33kV network in the Brightwater area ( ). The estimated cost of this project is $9.6m. These cable circuits will provide a switched firm supply for the Eves Valley, Hope, Brightwater and Mapua zone substations. The 33kV network in the Stoke area will also be re-configured so that a no break firm capacity 33kV supply is provided for the larger urban substations. Network Tasman Asset Management Plan Page 62
63 d. Reconductoring of the Motupipi to Collingwood 33kV circuit (26km). This circuit is expected to become capacity constrained by approx The estimated cost of this project is $0.7m e. The installation of a new 600A 33kV cable in the Railway Reserve between Neale Avenue and Annesbrook substation, together with reconductor of the overhead line circuit along the Railway reserve in the same area to 600A conductor. This project will increase the firm capacity of 33kV supply to Annesbrook substation to 34MVA. This estimated cost of the project is $500,000. The project is timed for when the Annesbrook substation bus load reaches 23MVA which is in 2026/27. f. Extension of 33kV network from Brightwater to Wakefield in preparation for zone substation construction at Wakefield. (approx. 2029/30). The estimated cost of this extension is $1.5m kV Subtransmission Network Upgrades On 1 December 2014, the 66kV subtransmission system and substations at Cobb, Upper Takaka and Motueka were transferred from Transpower to Network Tasman. This asset transfer was part of a programme of non-core transmission grid assets that are viewed as more appropriately owned and operated by lines companies rather than the national grid operator. Cost savings to the country as whole are likely to result from the lines companies being in a better position to operate and maintain the assets in a more cost effective manner that is optimised to the local environment. Two specific 66kV subtransmission circuit projects have been identified. These are: a. Installation of double circuit 66kV cables from the 66kV overhead lines at Riwaka to a new substation site. (approx. 2025/2026). The estimated project cost is $700,000. b. Capacitor banks Motupipi (2020) and Motueka (2023) Ongoing load growth will create the need for voltage support on the 66kV network under contingent conditions. This will take the form of capacitor banks to be installed at Motupipi and Motueka substations Zone and Subtransmission Substation Upgrades As a result of projected load growth a number of existing zone substation supply areas will require substation supply capacity augmentation prior to the end of the planning period. Brightwater/Wakefield Area The Brightwater substation is the main supply for these areas. A project to upgrade the substation to full N-1 capacity has been completed. In the longer term (beyond the horizon of this plan), further load growth at Wakefield and Brightwater will generate the need for a zone substation at Wakefield. Wakapuaka/Hira Area The Wakapuaka/Hira area is supplied via a single overhead line that runs along the top of the Atawhai hills and drops down to the coast to a regulator site at Wakapuaka. This line is constructed and insulated for 33kV but it is currently operated at 11kV. The area has experienced steady load growth mainly from rural residential land developments. The capacity of the 11kV supply to the area from Founders has been boosted by regulators, capacitor banks and judicious use of distribution transformer tap settings. Network Tasman has been recently advised of significant industrial load development at the Glenn. Modelling indicates that this load will cause the supply to go beyond the capability of 11kV and generate the need to install a small zone substation at Wakapuaka. There will also be a need to install Network Tasman Asset Management Plan Page 63
64 a new underground cable circuit from the new substation site to beyond the Glenn turnoff in order to create a second 11kV feeder circuit allowing the Hira area load to be separately supplied from the Glenn load. This development will defer a previously envisaged substation development at Hira to beyond the current planning horizon. The new underground cable circuit will be insulated to 33kV however in anticipation of a future substation at Hira. The Wakapuaka substation is a two year project planned to be completed in Motueka/Riwaka/Kaiteriteri Area The Motueka substation was acquired from Transpower in December The substation has two 66/11kV transformers that have a 10/20MVA rating. The 20MVA rating is an emergency rating with forced air cooling in 10 degree C ambient. The transformers were manufactured in The substation peak load is limited to 19MW by operation of the load management system, however there are significant periods in summer at this loading. Industrial and residential load growth is ongoing in Motueka. During 2016, enquiries were received for major cold storage developments in the Motueka area. A capital project to replace the two 10/20MVA transformers at the substation and increase the capacity from the substation was completed during In this project, two new transformers were installed each with nominal continuous rating of 23MVA. Two additional 11kV feeder circuits are also planned for this substation. These circuits will run to the central and northern parts of the Motueka township, relieving the load on the existing township feeder circuits. In the mid-term, further load growth is likely in the Motueka township and in Kaiteriteri and Marahau to the north. At around 2025, the load on the Motueka substation 11kV bus is expected to reach the firm capacity of the substation of 23MVA. This load is difficult to serve at 11kV from the existing substation and it is proposed that a new zone substation at Riwaka is constructed. This will relieve loading on the Motueka substation, meet the incremental north Motueka load and provide an alternative source of supply for Motueka township. Land and cable easements for the substation have been procured and designated for this future substation. This project would require a cable extension of the 66kV network at Riwaka to the new substation site. Motupipi Substation The Motupipi substation is a single transformer bank 66/33kV substation. There are four single phase transformer units on site. Three of these are in service at any time, and a five hour shutdown of the substation is required to change out one of these with the spare unit. This configuration necessitates shutdowns of the Golden Bay load in order to maintain the transformer banks. The substation configuration also does not meet the security standard for the 6MVA load of 100% restoration of supply within 3 hours in the event of a transformer failure. The existing transformers at Motupipi are now 49 years old. A project to enhance the substation and bring it up to the appropriate security standard is now planned for This project will involve replacing the existing transformer bank with two new three phase transformers and a second 66kV circuit breaker at the substation. Following this, each transformer bank will be capable of carrying the total load. This development will remove the need for regular shutdowns of Golden Bay for substation maintenance and it will significantly decrease the risk of extended unscheduled loss of supply. Hope Substation Network Tasman Asset Management Plan Page 64
65 The Hope Substation was first commissioned in 1960 and extended in The two power transformers at the substation were refurbished in 2004 and The substation is sited on land that has been designated by NZTA for future use as a highway. The substation 11kV switchboard has recently been replaced. The new switchboard includes additional feeder circuit breakers in preparation for planned new feeder circuits accommodating load growth in the Richmond west and south areas. In approximately 2022, it is expected that the Hope substation would be upgraded to 23MVA firm capacity by installing two new 11.5/23MVA units at the site. Annesbrook Substation At around 2026 a capacity upgrade of Annesbrook substation is expected. The substation firm capacity would be expanded to 34MVA by the installation of a third transformer and an additional 11kV switchboard. A summary of proposed zone substation transformer movements and purchases is outlined below: 2019/20 Construct new substation at Wakapuaka utilising two new 7.5MVA transformers. 2019/20 and Install two new 66/33kV 15MVA three phase transformers at Motupipi Substation. 2020/ /22 Install two new 11.5/23MVA transformers at Hope Substation. 2022/23 and Construct new GXP substation at Brightwater utilising two new 220/33kV 60MVA transformers. 2023/ /26 Construct new substation at Riwaka utilising refurbished 66/11kV 10/20MVA transformers. 2026/27 Upgrade Annesbrook substation with additional new 23MVA transformer. 2029/30 Construct new substation at Wakefield utilising two new 7.5/15MVA transformers kV Feeder Upgrades NTL operates a radial 11kV system generally without back-up for rural areas. In the urban areas open loops are built to allow alternative feed routes in the event of cable circuit failures. HV feeder upgrades are identified through loadflow modelling of the 11kV feeder network. A continuous model of the network down to 11kV lines is kept. The voltage profiles on this network can be obtained for various present and anticipated future loading conditions, and areas likely to require reinforcement can be identified at an early stage. Reinforcement projects are then identified and the implementation timing of these optimised from operational and economic viewpoints. Stoke Region 11kV feeders As mentioned in the previous section a number of new 11kV feeders and existing feeder upgrades are planned in order to meet anticipated load growth, meet the design supply security standard and meet network supply quality and reliability performance targets. These are as follows: 1. Installation of a new feeder circuit breaker at Annesbrook substation and a new 600A feeder cable from the substation to a new 11kV distribution switchboard in Merton Place. This is to boost supply to the Tahuna industrial area which is undergoing significant growth. 2. Installation of a new feeder from Hope Substation to connect with overhead lines in Swamp Road Richmond. This is to support expected industrial load development in the Lower Queen St industrial area. 3. Installation of an interconnecting cable in Marsden Valley to link with the Panorama Drive subdivision with associated switchgear in order to eliminate a section of network that is currently supplied by single cable spur and does not meet the design security standard. 4. Reconductoring of overhead line from the Brightwater substation southward along Higgins Road to Bird Lane. This project is required to provide a full backup feeder circuit to the Wakefield load area and to reduce voltage drop. Network Tasman Asset Management Plan Page 65
66 Motueka Region 11kV Feeders Central Motueka The township of Motueka is supplied from the Motueka zone substation via four 11kV feeders. The Motueka zone substation is situated approx. 3km away from the town centre. Significant load growth has occurred on the existing urban feeders in the past five years and this is expected to continue. At around 2020, an upgrade to the 11kV feeder capacity into central Motueka is expected to be required. This will generate the need for two additional cable circuits run from the existing zone substation into the urban area. An expansion of the switchroom capacity at the substation to accommodate these circuits will also be required. Upper Moutere/Sunrise Valley This area is supplied from a line running from Mapua substation following the Moutere Highway from Lower Moutere. The end of line voltage conditions at Sunrise Valley are at the statutory limits during peak feeder loading at present. A regulator was installed at Old House Road during 2012 to improve end of line voltages. Recent development of Hop Processing in Sunrise Valley has generated the need for further voltage support. A Static VAR Compensator (SVC) is being installed to provide this. This SVC is state of the art inverter technology. Tasman/Ruby Bay The Tasman/Ruby Bay areas are supplied via a long light 11kV feeder line from Motueka substation. The section of feeder line from Motueka substation to Moana Road has been upgraded in conductor size in the past. Subdivision of previous orchard land and upgrading of some packing sheds is creating a consistent growth in electrical peak load on this feeder. The commissioning of the new substation at Mapua together with conductor replacements has boosted capacity in this area for the medium term. Kaiteriteri/Marahau The load at Kaiteriteri and Marahau is highly seasonal with a distinct peak during the Christmas and New Year holiday week. For the rest of the year, the load is relatively light. Recently, a new feeder circuit has been installed reducing the load on the original circuit and significantly improving the end of line voltage conditions during high load periods and also significantly improving the reliability of supply in the area. For the longer term, the Kaiteriteri area is expected to continue to develop, particularly in the tourism area. A new zone substation in the Riwaka area is expected to be required later in the planning period. This development will relieve expected high loading on the existing Motueka substation, and improve expected voltage profiles at Marahau at the time. The Marahau area is supplied via a single 11kV cable installed across the tidal estuary. The shifting sand channels in the estuary have reduced the cover on the cable in places. This creates risk of damage to the cable from trailing boat anchors or shortened cable life from corrosion. A replacement cable installation run around the road is being considered. Alternative options would be considered in a business case study. Golden Bay Region 11kV Feeders Upper Takaka Ongoing installation of irrigation in the Upper Takaka Valley generated the need for incremental voltage support and supply capacity enhancement. To provide this, a new supply substation was constructed and commissioned at Upper Takaka in Further irrigation load growth in the area is expected. Rockville During 2011, three applications for irrigation system load were received in the Bainham area on the Rockville 11kV feeder. A capacitor bank was installed at Bainham during 2012 to support voltage in the area and Network Tasman Asset Management Plan Page 66
67 accommodate these new loads. Significant further load growth on this feeder may generate the need for further feeder capacity upgrading which would likely take the form of 22kV conversion. This development will be subject to full business case economic analysis and to final overall approval by the NTL board. Kikiwa Region 11kV Feeders Rotoiti/Kawatiri/Glenhope The Rotoiti/Glenhope area is supplied from Kikiwa substation via a single line running southward from the substation to St Arnaud, down the Buller River to Kawatiri, and then over hill country to Glenhope via Lamb Valley. The St Arnaud area has shown only moderate growth with additional holiday properties at St Arnaud used during the winter skiing season and over the Christmas break period. Voltage profiles over the line show that the supply along it is within regulatory tolerance at all points. Should further major development at St Arnaud occur then further investment possibly taking the form of a line upgrade to 22kV may be required. This development will be subject to full business case economic analysis and to final overall approval by the NTL board. Korere/Tadmor The Korere Feeder from Kikiwa Substation supplies the Korere and Tadmor areas. This feeder is a 50km long 11kV feeder. Significant dairying development has occurred in the Tadmor area. Some reconductoring of the feeder has taken place and two capacitor banks are in place at strategic points on the feeder to support peak load voltage. Hops are now being planted in the area replacing previous grazing land. Hop processing is becoming a significant load. Further dairying and hop processing development in the future is possible. This may generate the need for partial rural line upgrades to 22kV. Any development will be subject to full business case economic analysis and to final overall approval by the NTL board. Murchison Region 11kV Feeders Maruia/Springs Junction The Maruia Valley and Springs Junction are supplied from the Murchison substation GXP via the longest single line radial feeder on the network which is 80km long. Two voltage regulators and a capacitor bank are sited at strategic points along this line to support the line voltage. In parallel with these developments a two stage system upgrade is underway. In the first stage (2004/5-2006/7) the line has been reinsulated to 22kV. When the load growth in the area requires it, a step by step process over five years to upgrade the operating voltage of the line to 22kV is to be undertaken. During this process an 11/22kV transformer and 22kV distribution transformers will be installed allowing progressive re-energisation of the line at 22kV from the Springs Junction end. The total cost of this upgrade project is estimated at $900,000. This development will be subject to full business case economic analysis and to final overall approval by the NTL board. Longford/Mangles Network Tasman Asset Management Plan Page 67
68 During 2011, three applications for irrigation system load were received in the Tutaki/Mangles area on the Longford 11kV feeder. Capacitor banks have been installed at Tutaki and at Mangles in order to support voltage in the area to accommodate these new loads. Significant further load growth on this feeder may generate the need for further feeder capacity upgrading which would likely take the form of 22kV conversion. This development will be subject to full business case economic analysis and to final overall approval by the NTL board Urban Low Voltage Lines Considerable infill development has occurred and is ongoing in some urban areas. This is coming about through the subdivision of former 1000 sq m and larger sections down to smaller lots of around 450 sq m. In some cases, both the back and front areas of some properties have been subdivided to provide land for two additional low cost houses. New cables from these new houses have been run out to the existing reticulation which in most of these areas is still the original overhead lines. This has resulted in some sections of line in urban areas being loaded well over their original design. Some expenditure in these areas to relieve these overload situations is expected and has been allowed for in the plan. Relief methods include installing intermediate transformers in existing overhead lines, or running new circuits underground on the opposite side of the street to the existing overhead lines. An allowance of $150,000 per year has been made for this type of upgrade in the plan Rural Low Voltage Lines There are a number of long rural low voltage supply lines feeding multiple consumers and long supply lines to single consumers that require upgrading so that regulation voltage is supplied at each rural NCP. Typically, these are brought to our attention through consumer complaints of low voltage. Upon investigation of the complaint an upgrade of the supply is required, taking the form of a new transformer installed closer to the consumer, or an increase in the size of the low voltage line that supplies the consumer(s). Ten proven low voltage complaints are allowed for each year, at an average cost to rectify of $7,000. This leads to a budget of $70,000 for the rectification of rural low voltage complaints. The nature of these cases is that they are not specifically predicted at the beginning of each year, however once underway they become specified upgrade projects. A budget of the total expected costs of all cases is therefore allowed at the budgeting stage SCADA/Load Management System Upgrades An upgrade of the SCADA master station has been completed. This upgrade incorporated enhanced load management and improved remote access via laptops. It also allowed for the expansion of the system to incorporate down feeder line field devices such as autoreclosers. The master station hardware and software is updated from time to time as new releases of the system are made available by the vendor. It is not expected that the SCADA system will require any other major development or full scale replacement in the timeframe of this plan. Expansion of the system to complete incorporation of all zone substations on the network is planned over the timeframe of this plan. A fibre optic communications system has been extended to all zone and grid exit substations in the Stoke and Motueka bulk supply regions. A microwave radio link provides communications with the major outstations in Golden Bay Remote Control of 11kV Field Autoreclosers Network Tasman Asset Management Plan Page 68
69 A programme to automate approx. 60 distribution feeder field autoreclosers in stages commenced in the year All autoreclosers have now been automated with control integrated into the company s SCADA system. Communication with these devices is by intermittent polling over a mesh radio network Ripple Injection System Upgrades A ripple control system consists of one ripple transmitter which injects signals into the reticulation system and many ripple receivers located on consumer switchboards. The receivers, when detecting the particular signal code, they are programmed to respond to, then switch the loads that are connected to them on or off. The main purpose of the ripple control system is to utilise the storage available in some types of loads in a way that allows the overall peak demand on the transmission and distribution networks to be reduced. This is done by taking control of all these storage type loads (via the mechanism of ripple control), and ensuring that they are turned off when the uncontrollable loads (i.e. the rest of the system) are at their greatest. In this way the overall peak on the network can be reduced in comparison to what would be run without the benefit of ripple control. Our aim is to ensure that all our chargeable peak demands contain no controllable loads, i.e. that at the time that any peak load is run no water heaters or controllable space heaters are on. To a large extent this aim is achieved. The primary justification for employing a ripple control system is based on the costs of providing peak capacity, or more correctly, the avoided costs of providing peak capacity. These costs can be divided into two groups. The first of these is the cost of providing transmission capacity to carry the peak load to the Nelson region. These costs manifest themselves in Transpower transmission charges. The latest Transpower pricing indicates that the incremental cost of new demand on the system is $99/kW/year. The second group of costs are those of providing distribution capacity within the region. These costs are in capital servicing for heavier lines and transformers. The estimated cost for incremental demand on the network can be approximated from the current average cost. The replacement value is approximately $270m to supply a load of 140,000 kw. This translates to $1930/kW replacement capital, or $135/kW/year assuming a 7% p.a. cost of capital. Adding these two component costs together gives a total avoided cost of $234/kW/year. At present the load control system reduces our overall peak loading by approximately 15,000kW. Therefore, the ripple control system is saving NTL $3,510,000 in avoided capital charges per year. During 2013, Network Tasman altered its policy for the supply of domestic storage water heaters, making mandatory the connection of the water heater through an NTL approved ripple control receiver. The NTL network has five ripple control transmitters in operation, one operating in each bulk supply area. All of these are modern static frequency transmitters that are monitored and remotely controlled via SCADA Fault Indicators Research into overhead line fault indicators that can deliver high sensitivity and reliability in the detection of weak earth faults on the rural overhead line network is taking place. This level of sensitivity and reliability is required to match the protection schemes that are currently in place. It is also envisaged that future overhead line fault indicators would report back into the SCADA system via the mesh radio network. Such capability will enable a degree of automation of fault identification and isolation Emergency Generation Network risk management studies have identified the need to provide relocatable generation as a temporary contingency in the event of two types of network fault. Network Tasman Asset Management Plan Page 69
70 The first of these is the case of an 11kV cable fault in a section of spur network containing up to 450kVA of load in up to two distribution substations. As cable fault location and repairs can take up to 36 hours to complete, then in order to meet urban supply restoration time limits of 6 hours, local generation is needed until the cable fault repairs can be effected. Three transportable generators fitted with cables ready to be connected to the low voltage switchboard of a distribution substation were purchased during 2013/14. The second case is a contingency to allow supply restoration to rural spur networks within 12 hours in the event of 11kV cable failure. Five such spur sections have been identified on the network with loadings of up to 1100kVA. A containerised 1250kVA generator was purchased and a trailer constructed for this generator during 2002/3. Aside from its emergency power supply function, this generator is also utilised for peak load management during the winter and for alternative power supply during shutdowns on rural feeder trunk lines. This generator is reaching the end of its life and it is planned to be replaced during 2019/ Power Factor Correction As the load in the Motueka and Motupipi bulk supply regions increases, the firm capacity of the 66KV subtransmission network is encroached. Projects to install high voltage capacitors at Motueka and Motupipi substations to reinforce the upper network capacity have been identified. A budget capital allowance of $0.8m has been made for this project in the 2020/21 year and a further $0.5m 2019/20 year Overhead to Underground Conversion During 2001, the NTL board approved a new underground conversion policy. This policy provided for the conversion of overhead to underground and is based on the overall benefit to the community as a whole. The overhead to underground conversion programme was based on NCC, TDC and NTL s priorities with NTL determining the final programme. The programme has now been largely completed. Two individual projects are still underway and one is to commence in These are: The current programme of works is as follows: : High Street Motueka Stage 3, Batuep Road Hope : Ellis St, Brightwater Other small underground conversion projects come up from time to time when major street upgrade works are being undertaken by NCC or TDC and it is cost effective and practical for NTL to underground lines in conjunction with the works or alternatively to install ducts for future underground conversion. The average annual budget for ongoing underground conversion projects such as these is $500, NEW CONSUMER GENERATED NETWORK EXPENDITURE Background Tasman District has experienced steady population growth in recent years. This has created a growing demand for residential land and in turn provides a stimulus for the business sector as the local economy expands. Combined, both sectors are demanding greater line function services, initially as new connections, and then followed closely by business requiring greater capacity. Land subdivision activity has resulted in approximately 500 new connections per year. Network Tasman Asset Management Plan Page 70
71 Distribution Transformers Distribution transformers are generally provided free issue by Network Tasman to reticulation developments and industrial expansions. The current average expenditure on distribution transformers (11kV/415V) is $880,260. These provide capacity for residential consumers and increased business demand. Typical applications are urban/rural residential subdivisions, industrial subdivisions, central business district areas and sporadic rural sites. Whether or not a transformer is required for a subdivision or individual customer will depend on the capacity requested, the proximity of the LV network and whether or not there is any unutilised capacity in that circuitry and its transformer to meet the demand required. Urban residential customers have an after diversity maximum (ADMD) of 3kW at low voltage distribution transformer level. With approximately 415 new urban connections requiring 1245kVA of transformer capacity, NTL can expect to invest $240,000 annually on typically 200kVA and 300kVA padmount transformers, where density allows customers to be connected to single substations. Rural subdivisions by contrast are less densely populated (typically >2000m2 lots) thus requiring more substations with smaller transformer capacity. Where only single lots are created by subdivision, a single dedicated transformer is often required (15kVA is minimum size purchased). On average in Stoke, Motueka and Golden Bay, rural consumers are provided with 10kVA of transformer capacity resulting in a low utilisation factor. Costs rise from $190/kVA for urban connections to $261/kVA for rural, leading to an overall $172,260 capital cost for rural transformer purchases to supply the 66 new rural consumers per year. The Tasman District Council Rural 3 plan provides for cluster type development but this is unlikely to significantly alter the costs in rural areas. Kikiwa and Murchison have respectively 12 and 7 new connections p.a. on average. Apart from the odd subdivision at Tophouse/St Arnaud, almost all connections require a dedicated 15kVA transformer. At approximately $5700 per unit, the annual transformer cost is $108,000 for both regions. Large commercial and industrial consumers typically requiring 300kVA to 1000kVA create the remaining user group. Annually approximately 12 new transformers are purchased at a cost of $360,000. For safety and convenience reasons, a recent trend has been a move away from fence enclosure type industrial substations to padmount substations Switchgear Consumer generated network extensions and alterations often create the need for additional 11kV switchgear to meet operational requirements and security standards. Normally these occur in the meshed section of the network to maintain n-1 security for urban and industrial subdivisions. Typical examples are pole mounted isolators at cable terminations and ground mounted ring main units at the confluence of three or more cables. The annual budget is $373,000 per year, for this equipment. As load and consumer numbers increase on rural feeders, sectionalisers and reclosers are added to aid fault location and supply restoration as a means of improving network performance Urban Subdivisions Provided the reticulated works are vested with NTL, then NTL will provide up to 100% contribution towards 11kV materials on qualifying subdivisions. This includes: padmount transformers including installation, 11kV cables, switchgear except for some isolators and associated fixtures. On vesting and livening NTL will also pay a further contribution per electrically connected lot as consideration for vesting. Network Tasman Asset Management Plan Page 71
72 Estimated replacement costs for urban subdivision reticulation is on average $3,500 per lot. Total value with an average of 415 new lots per year amounts to $1,452, Rural Supplies Rural subdivisions and industrial connections are largely funded by the developer but vested with NTL. Estimated replacement costs for rural connections is on average, $8,000 per connection. Total value with an average 85 new connections over all GXP regions amounts to $680,000 p.a. All assets vested to NTL that are on private land are protected by registered easements MAJOR NETWORK DEVELOPMENT PROJECTS 2019/20 Refer to the table in Appendix D showing total capital expenditure by year over the planning period. This section details the major network development projects planned for the 2019/20 year. Alternative options for these major projects are discussed. Unless otherwise stated, these projects are subject to business case approval prior to commencement. Specific details of the projects proposed are as follows: 1. New 11kV Feeder Annesbrook Substation Step increases in load at a number of sites in the Tahuna industrial area have exceeded the firm capacity of 11kV supply. A new feeder into the area from the nearby Annesbrook substation is required to restore this firm capacity and provide for expected ongoing industrial load growth. This project is a system growth project that has an estimated cost of $600, Construction of new substation at Wakapuaka and feeder cable extension Wakapuaka to Glenduan This development is required to meet load growth in the outer northern part of Nelson City. A business case for this development gained NTL board approval during 2017 and detailed design of the substation is underway. The overall cost of this project is $5.3m, with an expected 2019/20 year expenditure of $3.5m.. This project will have no incremental improvement effect on target service levels but it will serve to maintain existing supply quality and reliability while accommodating current and future load growth. 3. Alternate 33kV Supply to Mapua Substation This development is required to improve the reliability and security of the 33kV supply to the Mapua substation, by providing an alternative circuit of supply that bypasses the existing single line of supply along the Appleby Highway. It involves a 33kV cable installation between existing overhead lines in Waimea West and Ridgeview Road/SH60. The project has an estimated cost of $2,800,000. This project will improve overall system reliability by approx. 3 SAIDI points MAJOR NETWORK DEVELOPMENT PROJECTS 2020/ /24 Network Tasman Asset Management Plan Page 72
73 Refer to Appendix D, detailing all capital expenditure identified as likely to occur in the four years 2020/21 to 2023/24. Unless otherwise stated these projects are subject to business plan approval. The major projects and the alternative options to be considered prior to approval of these are as follows: 1. 11kV Switchboard Extension and Additional 11kV Feeders Motueka Substation (2020/21 and 2021/22) Residential growth and expansion of the Motueka township area is ongoing. By approx the existing 11kV feeders will have increased such that the n-1 security level will have been reached. To remedy this, a project to install two additional 11kV feeder circuits into the township has been identified. This will require expansion of the 11kV switchboard at the substation as well. Options considered in the planning for this development will include: Major deployment of embedded generation in the Motueka township. This project has an estimated value of $4.8m. This project will have no incremental improvement effect on target service levels but it will serve to maintain existing supply quality and reliability at current levels despite the effects of load growth. 2. Upgrade of Hope Substation to 23MVA firm capacity (2021/22): Load growth in south Richmond and Hope is expected to projected to have exceeded the firm capacity of Hope substation in A project to upgrade the firm capacity by replacing the 10MVA transformers with 2 x 23MVA rated units is proposed. The project will also include the installation of an indoor 33kV switchboard in a new switchroom building adjacent to the existing 11kV switchroom. The project will also complete the relocation of the Hope substation away from the NZTA roadway designation where it now sits. Options to be considered in the business case for this project will include: Project deferment by embedded generation. Project deferment by battery storage installation. This project has an estimated cost of $2.5m. 3. Motupipi Substation Upgrade (2020/21 to 2021/22): This project is planned to bring the substation in to line with design security standards. The project will entail the addition of two new 66/33kV transformers at the substation together with associated 66kV and 33kV switchgear. The cost of this project is $3.2m. Options to be considered in the business case will be Deferment based on extension of life of transformers. Further development of local embedded Generation. This project will improve supply security but will not significantly improve any target service levels. 4. Capacitor banks Motupipi (2020/21) and Motueka (2023/24): The installation of capacitor banks at Motueka and Motupipi substations have been identified as a development step in a program of steps to boost subtransmission capacity over the next 20 years. The capacitor bank installations will provide voltage support under n-1 contingency conditions. The business case would consider the following alternative options: Contracting for local generation during contingencies New local generation Network Tasman Asset Management Plan Page 73
74 66kV line capacity upgrade by re-rating, reconductoring or voltage increase. The capacitor banks have a budget cost of $1.3m. This project will have no incremental improvement effect on target service levels but it will serve to maintain existing supply security and quality at current levels despite the effects of load growth. 5. Rockville Feeder 22kV Conversion Stage 1 (2021/22) and Stage 2 (2022/23) Dairy irrigation expansion in the Aorere Valley may generate the need for conversion of the 11kV feeder from Swamp Road substation to 22kV. This project will become necessary when incremental capacity enhancements such as capacitor banks have been exhausted. A full business case for the project taking account of committed irrigation projects and load control options will be required. This conversion project has an estimated value of $3.2m. Alternative options to be considered in the business case will include: Load levelling by battery storage and/or Local Generation This project will have no incremental improvement effect on target service levels but it will serve to maintain existing supply quality and reliability at current levels despite the effects of load growth. 6. Brightwater GXP Development (2022/ /24): The n-1 level security of supply from the Stoke 33kV is projected to be exceeded in the winter of A second 33kV point of supply is planned to be established at Brightwater. Land has been purchased for the site and designated for the purpose of a 220/33kV substation. Options considered in the planning for this development include: Deployment of embedded diesel generation. Load transfer to the Stoke 66kV GXP. The project has an estimated total value of $28m, however the project will be subject to a Customer Investment Contract between NTL and Transpower. The addition of the additional GXP will improve security and reliability of supply and also increase the resilience of the electricity to the Nelson/Tasman area by providing an alternative supply from the Stoke GXP. Network Tasman Asset Management Plan Page 74
75 6 ASSET RENEWAL AND MAINTENANCE PLAN 6.1 PLANNING CRITERIA AND ASSUMPTIONS It is NTL s view that electricity distribution network assets can be operated, maintained and progressively renewed on an ongoing basis in perpetuity so that the overhead lines, cables and other equipment never become unserviceable and overall they remain in a such a condition that the probability of failure of any line is held constant. Inputs and drivers used to develop the maintenance plan include the following: Asset survey Condition driven maintenance and renewal (CDM) - from asset data base Equipment replacement programme Regulatory compliance Equipment obsolescence Safety considerations The performance standards and monitoring process provides an ongoing indication of the health of the network and basis for the matching of maintenance and capital expenditure to stakeholder expectations. The total projected network asset operations, maintenance and renewal expenditure over the ten years of the plan by asset class is given in Appendix F. The projected expenditure for asset maintenance and renewal is summarised by category in the following table: ASSET MAINT & 2019/ / / / / / / / / /29 RENEWAL EXP $k Faults and 1,202 1,214 1,226 1,238 1, ,275 1,288 1,301 1,314 Emergency Maintenance Routine and 1,760 1,778 1,796 1,814 1,831 1,850 1,869 1,887 1,906 1,925 Preventive Maintenance Refurbishment 1,562 1,578 1,593 1,609 1,625 1,642 1,658 1,675 1,691 1,708 and Renewals Maintenance Total 4,524 4,569 4,615 4,661 4,706 4,755 4,802 4,850 4,898 4,947 N.B. Figures are 2019 dollars and do not include inflation adjustment. The mode of maintenance of the system is primarily condition based whereby individual components making up lines are replaced when their condition and serviceability has deteriorated to the point that it creates an unacceptably high risk of failure. Since the service life of various types of components vary widely (e.g. timber cross arms years, porcelain line hardware in excess of 50 years), then a composite line may never reach the point where it has reached the end of its life. Over a long period of time all components of the line may have been replaced at least once, however the line at no point in time was unserviceable or significantly less serviceable than a new line. True ageing of the composite overhead line network is therefore minimal and difficult to identify. There is not expected to be any significant technology developments in the immediate future in the industry that will have a significant impact on network component performance in the macro sense. Any technological gains are seen as being complementary to the existing equipment and such improvements will operate in addition to the existing equipment. Most extensions to the system have been underground over the last two decades, and it is expected that this will reduce the need for maintenance in the longer term. It is also apparent that over a period of time there has been a significant contribution to the renewal of the system from the continual alterations needed to accommodate additional consumers or to meet changing consumer needs. Network Tasman Asset Management Plan Page 75
76 6.2 ASSET RENEWAL AND REFURBISHMENT POLICY Network Tasman s asset renewal and refurbishment policy is to replace or refurbish components just prior to end of life. Lifecycle renewals are ongoing under the regime of inspection and maintenance that the company is operating. As most network components have few or no moving parts, end of life is determined by age based degradation of materials such as insulation deterioration, metal fatigue or rusting, timber rotting etc. Many technological items such as relays, switchgear and SCADA components are replaced for reasons of obsolescence rather than wear out. For those items that do reach end of life in service there can be significant variation of age at end of life. This means that the wave of replacements of a particular type of component typically does not have the same time profile as the wave of initial installation. The overall effect is a significant flattening of the original installation profile for renewal. Only a few assets or components of assets undergo refurbishment due to the nature of the network asset being made up of a number of replaceable components that individually are of low value. The exceptions to this are power transformers and large distribution transformers. These are subject to refurbishment policies aimed at extending the life of the asset by undertaking mid life refurbishment. In service failures of components on the network are infrequent and account for less than 10% of all HV outage events and approx. 20% of annual unplanned outage minutes. Any component types that have failed in service a number of times are investigated for the failure mechanism. When this is identified and ascertained, all items of the same type are isolated and programmed for progressive replacement. In this way individual component failure rates are kept very low and it is difficult to obtain consistent figures for failure rates of individual components over time. Other activities that significantly contribute to ongoing asset renewal include: Underground conversion of lines either by line company or private landowner. Line relocations for land development or roadworks Replacements of damaged assets from vehicle collisions Details of asset renewal and refurbishment policies by individual asset type are given in section ASSET CLASSES The assets of the network are broken down into the following classes: Pole structures Overhead Conductors 66kV, 33kV, 11kV, 400V Underground Cables 33kV, 11kV, 400V Distribution Substations Distribution Transformers Service Boxes Air Break Switches Ground Mounted Switchgear Pole Mounted Switchgear HV Line Fuses 33kV, 11kV Circuit Fuses 400V Field Regulators and Capacitors Zone Substations Power Transformers SCADA Communication Networks Public Lighting Ripple Injection Plants Network meters Connection Assets Network Tasman Asset Management Plan Page 76
77 These asset classes are the basis of the asset layers of the GIS system and they also provide the framework for the network asset register. All items of plant are individually identifiable within these classes. 6.4 ASSET MAINTENANCE AND RENEWAL CATEGORIES In this plan the following categories have been used: Faults and Emergency repairs Routine and Preventative maintenance Refurbishment and Renewals Faults and Emergency Repairs These are unanticipated repairs/replacement work arising from network equipment failures, accidents, storms and other external impacts which cause outages, weaken or impair service, or reduce asset life. The category includes all work needed to restore the network to its pre-incident strength and capacity. Works during emergency repairs may constitute either premature maintenance and/or premature renewal. If an asset classed as a network component is completely replaced during the repair the activity is treated as a renewal. A list of typical emergency repair activities is given in Appendix G Routine and Preventative Maintenance This is regular ongoing work, annual or other regular longer time cycle, aimed at maintaining the existing composite assets rather than enhancing the life of them. The work is not intended to change the service potential, although this may to a minor degree be a result of this work. Typical examples of this are tree trimming, service box maintenance, cleaning, also tightening line hardware, changing crossarms, rebinding conductors and replacing fuse links. A list of typical routine maintenance activities is given in Appendix G Refurbishment and Renewals Maintenance Refurbishments and Renewals are mainly component life extending refurbishments or complete replacements such as pole structure replacements and/or crossarms and line hardware. Refurbishment of equipment is generally only undertaken to the extend the life of major capital items such as power transformers. Most other single items are more economically replaced rather than refurbished. Renewals are typically replacement works that arise near the end of an asset s expected life. As previously stated, the process of ongoing maintenance and replacement of the individual components making up a line network ensure that the overall line network is never significantly aged or reduced in service potential. A list of typical renewals maintenance activities is given in Appendix G. 6.5 ASSET INSPECTION AND CONDITION MONITORING The company has engaged one staff member in the field to assess maintenance and renewal requirements. The entire network is subject to a survey round that involves inspection of every asset at least every five years. The routine surveys confirm the view that the system is in a good state of repair. The entire network has now been inspected with the bulk of the identified work being timber crossarm renewals with some pole Network Tasman Asset Management Plan Page 77
78 replacements. The intention of network survey programmes is to inspect all components of the network system at least every five years on a condition driven maintenance basis. Urban and rural inspections are generally made from the ground. Remote rural inspections are sometimes made from helicopter. The table below summarises the routine inspection regimes in place. Inspection Type Period Pole structures Visual 5 Yearly Overhead Conductors Visual and Thermographic 5 Yearly Insulators Visual and Corona Discharge 5 Yearly Pole mounted Switchgear Visual and Thermographic 5 Yearly Pole Mounted Switchgear Operational Test Monthly Air break switches Visual and Thermographic 5 Yearly Distribution Substations >100kVA Visual and MDI Reading Yearly All Distribution Substations Visual and Earth Test 5 Yearly Field Line Regulators Operational Test 6 Monthly Zone Substations Visual Inspection Monthly Zone Substations Switchgear Maintenance and Protection 2 Yearly Operational Test Power Transformers Tapchanger Operational Test Monthly Power Transformers Tapchanger Oil and Contacts 2 Yearly Power Transformers DGA Oil Sample Test Yearly Ground mounted switchgear Visual and oil sample test 5 Yearly Service Boxes Visual 5 Yearly Underground Cables 33kV Partial Discharge Test 5 Yearly Underground Cables 11kV Major Feeder Partial Discharge Test 5 Yearly Ripple Injection Plants Operational Test Monthly Ripple Injection Plants Supplier Service Inspection Yearly SCADA Master Station Supplier Service Inspection Yearly All maintenance work identified from the routine field inspections in the above table is entered into the Network Maintenance database. Each item of maintenance or renewal work is referenced to the specific asset via a unique asset identifier. Maintenance works contracts are later formulated from the information in this database and let to the principle maintenance contractor. A comprehensive GIS system has been developed that includes all network components. This has links to the Network maintenance database and allows the recording of all survey and completed maintenance activity for each individual component. The GIS system provides a convenient and efficient means of geographically selecting maintenance works tasks from the database to form contract works packages. These works packages are assigned to the contractor for completion in the field. The maintenance database is then updated upon completion of each works task. The database therefore also becomes a historical record of all maintenance activities undertaken at each pole site on the network. 6.6 LIFECYCLE ASSET MAINTENANCE AND RENEWAL POLICIES BY ASSET CLASS Pole Structures The NTL overhead line network is based on purpose-designed concrete poles. There are approximately 28,000 poles in the NTL network, 95% of which are a reinforced concrete type that have been manufactured by the company and its predecessors since the 1930 s. They have proven to give excellent service and in the relatively benign conditions of Nelson they have a very long life. The design strength rating of these poles (despite some minor design alterations over the years) has been confirmed as being conservative and poles that have been in service for 55 years have shown to have strengths well beyond their design rating even after considerable concrete spalling has occurred. Network Tasman Asset Management Plan Page 78
79 A graph of the historical development of the network shows that rapid expansion took place in the period when the reticulation system was initially formed. Since that period some overhead feeder lines have been rebuilt to accommodate heavier conductors. Others have been replaced by underground cables during a period of underground conversion of the central townships and main urban highways. This took place in the period Reinforced concrete poles that have been correctly manufactured with good quality raw materials have a long and as yet undetermined life. There are many examples of 70 year old poles on the network that are not cracking or spalling and show no signs of deterioration. Loss of strength, even in heavily spalled poles, is not evident. Strength testing has shown that the poles have better than their initial design strength even after one side has almost completely spalled. Concrete poles are generally therefore replaced for aesthetic and public safety reasons (risk of being struck by a falling piece of concrete) rather than for loss of strength. The onset of spalling (and therefore premature end of life) comes about mainly by reason of poor manufacture. Some batches of poles were produced with insufficient cover over one side of the reinforcing cage. Some others are believed to have been produced using reinforcing that was rusted through being transported on ships as deck cargo. Approximately 1200 reinforced concrete poles have been scheduled for replacement over the period of this plan. This represents 4% of the total pole population. Pole replacements due to spalling tend to be variable over the age distribution of poles and seem to be more related to the quality of initial manufacture rather than age. Until a distinct ageing mechanism for these poles can be isolated, we are assuming that the life of the poles is in excess of 90 years and that due to this no agebased renewal programme is needed in the time horizon of this plan. Research into the expected life of the reinforced concrete poles has been undertaken. This research utilised the engineering resources of local civil engineering companies and the University of Canterbury. Research undertaken to date indicates that reinforced concrete poles that are not within 30km of the coast will achieve a life of greater than 150 years. Notwithstanding the above, the performance of concrete poles in estuary situations was brought into focus with the early failure (approx. 15 years in service) of some poles on the line supplying Bests Island. It has been ascertained that salt water ingress into these poles results in rapid rusting of the reinforcing steel within the pole leading (particularly in the case of pre-stressed concrete poles) to catastrophic failure of the pole. A programme to replace all concrete estuary poles with class A marine treated pine poles is now nearing completion. The manufacture of reinforced concrete poles was discontinued in At this time the reinforcing steel had become prohibitively expensive. All new concrete poles installed on the network are now pre-stressed construction. These are a stronger pole than the reinforced concrete pole, however they have the disadvantage of not having residual strength following breakage from vehicle impact for example. The remaining 5% of poles in the NTL network are either iron rail poles from the original Nelson railway or treated pine softwood poles. The railway iron poles date back to the 1950 s and are now showing signs of reaching end of life in some areas. There are approx. 200 of these still in service on the network. A pro-active iron rail replacement programme is now operating. Iron rail poles that have maintenance scheduled on them (for example to change the crossarm) are replaced with a concrete pole. Also, as lines are being upgraded (e.g. larger conductor installed) all iron rails in the line section are replaced with a concrete pole as part of the upgrade. All remaining iron rail poles in the network will be replaced by The treated pine poles on the network were installed during the period 1975 to 1985 mainly in spur lines in the rural area. They were identified at the time as being a cost effective pole for use in rural line extensions, however the quality of them proved inconsistent and this led to ongoing problems with twisting and splitting, and so their use was generally discontinued. They are used now only in special situations such as high salt Network Tasman Asset Management Plan Page 79
80 areas, estuaries and where access necessitates deployment of helicopters. Treated pine poles in service on the network are still relatively new and they are monitored during survey rounds. A testing program for these poles is to be introduced in 2018/19. Few are expected to require replacement within the time horizon of this plan. A stack of replacement treated pine poles is kept for difficult access situations. Pole Routine and Preventative Maintenance: Pole maintenance is limited to patching reinforced concrete poles in cases where cover concrete has been damaged by impact rather than due to quality of manufacture based spalling. Straightening poles and strengthening pole footings by re-blocking and re-compacting the footing is also considered maintenance. Pole Refurbishment and Renewals: Most repair works undertaken on poles result in replacement of the pole. No poles are refurbished. As discussed above, pole replacement programs are underway for spalling reinforced concrete poles and iron rail poles. These replacements are budgeted to continue at a steady rate for the time horizon of this plan. All pole replacements are treated as renewals and as capital expenditure under company policy Line Hardware Line hardware consists of all pole structure sub-components other than the poles themselves. Items include crossarms, insulators, strain insulators, guy wires and anchors, bracestraps, dropout fuses and cutouts. Crossarms: The timber crossarms in use in the NTL system are mainly Australian hard wood arms of varying types. The quality of these has varied within batches and across varieties such that the life spans of crossarms is highly variable. The service life can vary from 15 to 45 years with an average of around 25 years. Factors influencing crossarm life are aspect and level of shading from the sun, and the propensity for lichen growth on crossarms particularly in the southern regions of our network. Crossarm condition is generally assessed by visual inspection from the ground, initially looking for end splitting, shrinkage, corrosion of the upper surface of the crossarm and signs of dry rot. The current average condition of crossarms is good. The present replacement rate is approx crossarm changes per year. This is consistent with the crossarm average life. Hardware: Most line hardware is of galvanised steel or porcelain material that has proved to have a very long life in the Nelson environment. In the west coast region of Golden Bay however, the environmental conditions are extremely corrosive being an area of high and steady salt laden westerly winds, with regular light showery rain. This leads to severe corrosion of line hardware particularly where dissimilar metals are used in the same components. Line hardware that is specified as corrosion resistant is trialled in the area. Line Hardware Routine and Preventative Maintenance: Line Hardware and crossarm maintenance activity consists of tightening crossarms and hardware only. Line Hardware Refurbishment and Renewals: Most line hardware and crossarm activity involves replacement of the component. Such activity is ongoing across the network at a steady rate (approx. $1.1m p.a.) for the period of this plan. No items of line hardware are refurbished. Network Tasman Asset Management Plan Page 80
81 Specific component types have been identified as reaching the end of their service life and for which specific replacement strategies are underway are as follows: These are listed as follows: Dominion dropout fuses of the two piece insulator construction with a galvanised steel and cement insulator mounting have been found to fail particularly in cold moist environments. Moisture entry into the mountings of the insulator posts is prone to freezing, with a resultant expansion and fracturing of the insulator mounting. The DDO normally retains its electrical insulating strength however its mechanical strength is severely reduced. The mounting failure becomes apparent when the fuse is operated by a faultman, in that it falls apart when the fuse candle is re-inserted after fuse link replacement. Units of this type are being identified during line surveys and replaced. Band clamp type Dominion Dropout fuses also have a failure mechanism whereby ice induced expansion of the band insulator mounting leads to loosening and eventual mechanical failure of the DDO. These units are also scheduled for replacement as they are identified. In the salt laden air environment of the northwest coastal strip, dropout fuses are known to corrode in the hinge area, defeating the dropout function of the fuse. This causes the candle to remain in situ following fuse element ruptures and the candle becomes a highly resistive conductor. Reports of low voltage or burning HV fuse candles alert faultmen to the problem. 11kV dropout fuses incorporating stainless steel fittings and pre-load spring systems are now used as replacements in these remote areas. Prior to 1995, the grease tube and line tap connector was commonly used for tapping copper tails onto aluminium lines. These have proved to be an unreliable method of connection and the procedure has now been discontinued. A compression joint is now made in all cases. Where other linework is taking place in an area, all grease tube and aluminium line tap connections are replaced. All remaining 11kV connections of this type will be identified for replacement during future line surveys. It is anticipated that it will take a number of years to change all 400V connections of this type. Porcelain strain insulators of the kidney type have been found to be failing in areas prone to lightning. The failure mode is a pin hole puncture through the porcelain when a high voltage impulse from a lightning strike occurs. This pinhole may not result in immediate failure of the insulator at normal service voltage, however it significantly reduces the insulation strength and often leads to later failure in misty or wet conditions. Kidney insulators are now scheduled for replacement during maintenance survey Overhead Line Conductor Overhead line conductor in use on the network is copper, ACSR, or all aluminium conductor. There are also short sections of galvanised steel conductor still in use on some rural HV spur lines. Careful inspection and monitoring of the condition of the conductor at points subject to vibration, resulting in fatigue failure of strands, will be required to determine the reliability of these lines. Vibration testing to date indicates that aeolian vibration levels are generally low on the network, possibly aided by a policy of conductor installations at reduced tensions. Conductor renewal is however required for light copper lines in the next ten years. Older light copper conductors are reaching of end of life. Over the life of the conductor, vibration fatigue and annealing from passing fault currents results in loss of tensile strength. This is evidenced by an increased occurrence of conductor breakages when conductors are clashed together or otherwise abnormally stressed. There have been no incidences of conductor breakage under normal loading conditions however. A programme to replace approx. 210km of light copper conductors on the network over the next ten years is underway. Network Tasman Asset Management Plan Page 81
82 The standard ACSR conductor has a very limited life in the coastal conditions of Westhaven. Salt particles are driven into the conductor creating a chemical and abrasive attack on the aluminium strands. This deterioration is also enhanced by any conductor vibration in the crosswinds. A major renewal project of the Westhaven lines was completed during 2010/11. Conductor Routine and Preventative Maintenance: This consists mainly of re-sagging and/or re-binding line conductors. Any conductor repairs generated from conductor clashing also falls into this work category. There is a small budget each year for this activity. (Refer Appendix F.) Conductor Refurbishment and Renewals: Conductor renewal has been proceeding over recent years with the replacement of steel (originally galvanised) that has rusted to failure, and have reached the end of their economic life. Conductor renewal has also taken place in spans of light conductor where conductor clashing has been known to have occurred over a long period of time. This leads to weak spots in the conductor. This review of the AMP includes a program of replacement of 7/064 and lighter copper HV conductors over a ten year period, commencing in 2017/18. Conductor installation records and historical records of conductor breakages have been used to prioritise this replacement program. Under the program, approximately 21km of light copper conductor has been planned to be replaced each year. Conductors that are removed from service are generally disposed of. No conductor refurbishment takes place. Conductors are also often replaced prior to end of life for load growth reasons. Refer to the Network Development plan for further details HV Underground Cables In general the underground cable network is in good condition. It has been carefully installed in good bedding material, and it is operated prudently within conservative loading limits. The HV cables are mainly mass impregnated non-draining (MIND) oil impregnated paper lead technology, with a small amount of cross-linked polyethylene cable in some areas. The preference has been to continue with paper lead as the standard, due to its proven performance and long life as a high voltage insulation. The MIND paper lead cable has proven worldwide to be a very long life cable construction. If operated carefully and not interfered with, the life of the cables is indeterminate. In the past ten years, a number of joints in the underground 11kV network have failed in service. The failures have tended to be instigated by water ingress into the joint. In particular, the early Raychem type joint has been prone to this. It is proposed to partial discharge test critical cable sections with this type of joint in order to identify cases where there is a risk of failure. HV Underground Cables Routine and Preventative Maintenance Preventative Maintenance activity for HV underground cables consists of periodic visual inspection of cable terminations and partial discharge testing of 33kV and major 11kV feeder cables. Cable terminations or cables identified as having poor insulation are scheduled for replacement. HV Underground Cables Refurbishment and Replacement In service HV cable failures in the past two years have highlighted an issue with small c.s.a (35 sq mm and below) steel tape armoured cables installed during the 1980 s and early 1990 s. The steel tape has significantly corroded during the approx. 20 years in service to the point that the mechanical protection that the steel tape Network Tasman Asset Management Plan Page 82
83 provided has all but disappeared. This exposes the cables to increased risk of damage from external sources such as tree roots etc. Excavations around these cables are also more hazardous. NTL has highlighted the enhanced risk situation with contractors in the area, reinforcing compliance with operational procedures when working in close proximity. Cable failure rates are also being closely monitored. Spur circuit sections of 35 sq mm HV cable have been now individually identified and a replacement program targeting these cables has been created. This program will commence in 2017 and continue for six years. The program consists of a number of individual cable replacement projects. The list of these projects, their cost and timing is given in Appendix E. The costs of these projects are included in the capital works budgets of Appendix D Zone Substations The network contains one 66/33kV, two 66/11kV substations and ten 33/11kV substations of capacity ranging from 3 to 23MVA. All zone substations are in good condition and are well designed for normal expected electrical duty. Monthly operational checks are completed and defects picked up in this process are remedied immediately. Seismic strengthening of some switchroom buildings to bring them up to appropriate standards has been recently completed. Power Transformers There is one bank of single phase 66/33kV transformers at Motupipi substation. These are circa 1966 units. They have seen light service only and condition monitoring such as partial discharge and dissolved gas analysis indicates good condition. The units do not have on load tapchangers fitted. There are twenty 33/11kV three phase transformers ranging in capacity from 3MVA to 11.5/23MVA. The oldest of these are two 10MVA units at 57 years. There are two three phase 66/11kV power transformers at Motueka substation. These are new (2018) 11.5/23MVA units. Power Transformer Routine and Preventative Maintenance: The transformers, tapchangers and switchgear at all substations are maintained on a bi-annual basis. Oil samples are taken from the in-service transformers for Dissolved Gas Analysis every year and the results of these are checked for trends. Oil acidity and moisture content is monitored carefully and oil is treated before it reaches the point that it may significantly compromise winding insulation life. Due to the N-1 design standard deployed for zone substation transformers, few units have been operated for significant periods beyond 70% of their nameplate rating. As a result of these practises, it is expected that the insulation of the power transformers is still in good condition. The on load tapchangers on all power transformer units are opened up bi-annually and checked for wear, etc. At this time, contacts are dressed or replaced and the tap switch is treated. Although original parts can no longer be purchased for the older tapchangers, it is possible to have them manufactured if required. The economics of having to replace many parts within a few years brings about the economic end of life for the older tapchangers. Power Transformer Refurbishment and Replacement: Network Tasman has an age based refurbishment and replacement policy for power transformers. Under this policy, a mid-life refurbishment is undertaken after 40 years of service. Power transformers are planned to be finally retired from service after 65 years. Network Tasman Asset Management Plan Page 83
84 The five oldest 33/11kV power transformers on the network have undergone mid-life refurbishment. Paper insulation strength tests undertaken during the refurbishments confirmed that the insulation was in good condition for all of these units and that the expected 65 year service life would be attained from the transformers following refurbishment. Further policy based midlife refurbishments of power transformers are scheduled in the capital programme of this AMP. The oldest transformers on the network at Hope substation will be retired when the substation is upgraded in approx There are no other age based replacements of power transformers within the time horizon of this plan. 66kV Switchboards There are outdoor overhead 66kV switching structures at Motupipi, Upper Takaka, Cobb and Motueka substations. These are gantry based structures comprising 66kV isolators, 66kV circuit breakers, current transformers and voltage transformers. These structures are in good condition. The 66kV circuit breaker at Motupipi is a vacuum/dry air insulated type. This circuit breaker was new in 2012 having replaced the previous SF6 unit which had a slow gas leak. All other 66kV circuit breakers in service on the network are of the SF6 type. 66kV Switchboard Routine and Preventative Maintenance Maintenance requirements for these switchboards are minimal, consisting mainly of visual inspections, intermittent circuit breaker and isolator operational checks and circuit breaker gas level monitoring checks. 66kV Switchboard Refurbishment and Renewals Refurbishment and renewal of 66kV switchboard equipment constitute significant capital works. There are no plans to replace or refurbish the 66kV switchboard equipment in the timeframe of this plan, however should any CB s develop significant gas leaks, then they may be removed from service and refurbished. Further analysis and determination of the life cycle situation with the 66kV SF6 circuit breakers is to take place during the next few years. 33kV Switchboards There are ten outdoor overhead 33kV switching structures, comprising overhead buswork, isolators, lightning arrestors and circuit breakers. The switchboards are monitored with thermal imaging during winter on a biannual basis. The circuit breakers are either bulk oil or vacuum type, the oldest circuit breakers being circa These are inspected on a bi-annual basis. Very few fault clearing operations have occurred on these circuit breakers. The Mapua and Richmond substations have indoor 33kV switchboards. The Mapua switchboard has SF6 CB s and the Richmond switchboard is an encapsulated vacuum type. 33kV Switchboard Routine and Preventative Maintenance Maintenance requirements for these switchboards are minimal, consisting mainly of visual inspections, intermittent operational checks and gas level checks. These are undertaken bi-annually. 33kV Switchboard Refurbishment and Renewals High voltage switchboards are major capital items. Refurbishment and renewal are significant capital works. Network Tasman Asset Management Plan Page 84
85 The 33kV circuit breakers at Motupipi substation are older bulk oil circuit breakers. These proposed to be replaced in The 33kV switchboard at Hope substation is proposed to be replaced in conjunction with a zone substation capacity upgrade and relocation in Further information is provided in section kV Indoor switchboards There are seven vacuum switchboards (circa 1998, 2001, 2003, 2005, 2006, 2013 and 2016) and one SF6 indoor switchboard (circa 1985). These switchboards are all in good condition, have sufficient fault duty and are regularly serviced. 11kV Switchboards Routine and Preventative Maintenance The maintenance requirements of the modern vacuum and SF6 switchboards are minimal. All switchboards are inspected, cleaned and tested on a bi-annual basis. Partial discharge testing is also undertaken on a biannual basis. Partial discharge testing of all switchboards to date has revealed no unusual discharge activity. 11kV Switchboards Refurbishment and Renewal All 11kV switchboard refurbishments or replacements are major capital works. All oil interruption technology 11kV CB switchboards have been replaced with modern encapsulated vacuum technology switchboards in the last 15 years. There are no planned refurbishments or renewals of any of the vacuum or SF6 switchboards in the period of this plan. The last oil technology 11kV switchboard at Hope substation was replaced during Protection Relays The protection relays are a mixture of electro-mechanical and electronic devices. Most substations have all electronic protection relays. Some have a mixture of digital electronic and electromechanical: The remaining electromechanical protection relays are associated with the older (1980 s) 33kV transformer circuit breakers. Although these relays are ageing, there have been no signs to date of failure or critical degradation. Renewal of these relays will be undertaken for reasons of obsolescence rather than end of service life. The modern digital protection relays now offer much greater functionality within one unit. All protection relays are tested for functional operation and timing accuracy bi-annually in conjunction with other substation maintenance. Oil Management Oil handling procedures and facilities at all zone substations have been upgraded incorporating the provision of oil spill kits. Oil interceptor bund systems have been installed at Lower Queen St, Brightwater, Founders, Annesbrook, Mapua and Richmond substations as the transformer pads at these sites have been built or modified. Other bund systems are planned to be installed to the other zone substations during 2018/ Air Break Switches There are 788 air break isolators in service on the NTL network. These comprise 66kV, 33kV, 22kV and 11kV isolators and include both side swing and rocker arm types. Network Tasman Asset Management Plan Page 85
86 Bolted connections on overhead 11kV air break switches have previously been made using galvanised bolts and belville washers. These have severely corroded within five years of service, resulting in failure of these connections in service. Mahanga 11kV Air break switches manufactured prior to 2014 have an insulator moisture ingress problem that can result in corrosion and insulator cracking especially in areas where temperatures drop freezing point. Investigative work is underway to find an effective method of replacing the insulators on these switches. Once this work is complete, then an insulator replacement programme will be implemented. Air Break Switch Routine and Preventative Maintenance Air break switch maintenance is carried out with the switch in situ and consists of periodic thermographic surveys, operating mechanism adjustments and arc controlling flicker adjustments. Air break switch maintenance is usually initiated from reports from lines staff of operating problems. A programme to replace all bolted connections with friction welded bimetal connectors fastened with stainless steel bolts and washers is underway. Over a period of 10 to 15 years the complete replacement will be made. The worst connections are being identified by annual thermographic surveys of the HV network now being undertaken each winter. Problems have been experienced with the arc controlling flickers on modern air break switches. Investigations into this have revealed that the initial setup of these is critical to satisfactory operation over the life. Air Break Switch Refurbishment and Replacement Air break switches that are of the minimum 400A rating and no older than 40 years are refurbished if this can be economically achieved. Refurbishment consists of contact and flicker assembly renewals and individual insulator changeouts where it is possible to undertake these. Air break switches of rating less than 400A and/or older than 40 years are scheduled for replacement in the network maintenance database Pole Mounted Switchgear (Autoreclosers and Sectionalisers) There are 69 pole mounted autoreclosers and sectionalisers on the NTL network. These are mainly Nulec vacuum type. There are 5 McGraw Edison KF and KFE vacuum type also in service. Pole Mounted Switchgear Routine and Preventative Maintenance This is limited to monthly operational field checks and battery replacements. If any switchgear should fail an operational test, then it is brought into the workshop for analysis and any further testing. Line connections are also checked periodically through thermo graphic surveys. Pole Mounted Switchgear Refurbishment and Replacement All oil interruption technology reclosers and sectionaliser units have been subject to a replacement program that was completed during 2016/17. Under this program, 64 reclosers and sectionalisers were upgraded to modern automated encapsulated vacuum type. These are all SCADA controlled, facilitating improved fault outage response and providing a corresponding improvement in network availability. The fleet of reclosers and sectionalisers is now modern and will not require refurbishment or replacement in the ten year time horizon of this AMP Ground Mounted HV Switchgear There are two main types of ground mounted 11kV switchgear in service on the network. These are the Hazemeyer Magnefix type and the ABB SD oil switch type. Network Tasman Asset Management Plan Page 86
87 Ground Mounted Switchgear Routine and Preventative Maintenance The Magnefix switchgear is a fully encapsulated compound insulation switchboard. Due to the propensity for the surface of this equipment to track, particularly when in moist air, these units are installed only within transformer enclosures where the heat generated from the transformer keeps the units dry. This also ensures that no sunlight is normally incident upon them. Maintenance of these units consists of a periodic surface cleaning and link contact inspection and cleaning. Under these installation conditions it is believed that these units will give at least a 45 year service life. There are no units on the network that will reach this age within the time horizon of this plan. The ABB SD oil switchgear is deployed in banks of 11kV switches. All are oil insulated and also rely on oil for their arc breaking capability. All units are series 2 type, and there are no fuse switch (HV fuse in oil) units in the network. Maintenance consists of periodic inspection for corrosion and leaks in the metal cases and checking of internal oil levels. The oil within each switch unit is also tested for moisture ingress. From time to time the units may also be repainted. The oldest of these units is circa Ground Mounted Switchgear Refurbishment and Replacement: All series 1 Andelect oil switch units (35 units) have now been replaced under a renewal programme that has been running for the last ten years. This replacement program was be completed in The use of HV fuses in oil has been discontinued following an incidence of fuse candling. This resulted in the catastrophic failure of the switch unit. There are now no HV oil fuse switches in the NTL distribution network. The series 2 ABB SD oil switchgear is now no longer in production. The Halo type encapsulated vacuum switchgear has been adopted as a standard alternative for 11kV free standing ground mounted switch applications. These have the facility for future SCADA monitoring and control. There are now four Halo switch units in service on the NTL network. There are no further refurbishment or replacement plans for ground mounted switchgear in the timeframe of this plan Distribution Substations There are currently 4,537 distribution substations on the network. These are in five standard types being single pole substations, multiple pole platform substations, kiosks, padmounts and fenced enclosures. The substations are maintained in good condition and the loadings are monitored, with few having been allowed to exceed their nameplate rating for significant periods. All substations of capacity 100kVA and above are fitted with maximum demand indicators. These are read and reset annually. Substations below 100kVA are fitted with fuses on the low voltage side, limiting the load that can be drawn from them. Fenced enclosure substations were a common style in the past for industrial sites. These are now gradually being phased out for new installations or upgrades as large padmount types are now readily available, and these require less space. Platform substations are no longer being installed. A program of replacement of existing platform substations with padmount type substations where there is a risk of public interference with or access to the substation has been commenced. This will continue through the period of this plan. These replacements are prioritised on risk of public access to the platform. During 2018, the platform substations were assessed for seismic strength. A number of remedial actions were identified that if implemented, would bring the population of platform substations up to a minimum 67% NBS. A five year programme of seismic strengthening of remaining platform substations will commence in The Andelect J type fuse low voltage fuseboards within older padmount substations have been identified as being prone to loosening and overheating, particularly in cases where they supply large commercial or Network Tasman Asset Management Plan Page 87
88 industrial load. A design fault in these fuseboards has also been isolated where the busbars are fitted to the fuse pillars. The regular thermo cycling effect of the load causes the bolted connections and wedge type fuses to be loosened. A programme has been put in place to identify all sites that have the potential for this fault mechanism, and replacement modern equivalent fuseboards are being installed Distribution Transformers The age profile of the distribution transformers on the network is shown in the chart of Section 3.3. The life of distribution transformers has been found to be highly variable. The degree and length of time at high load is a significant factor in determining the life of a transformer. There are many other factors affecting life however such as over voltage on the supply, surges and exposure to lightning. The latter exposure varies according to location. Older transformers typically fail finally during a lightning storm. Lightning storms are intermittent in the Nelson area and five to ten transformers only are permanently damaged during major storms each year, however not all such failures are old transformers. The overall in service failure rate of transformers has been very low over the past 10 years at approximately 150kVA per year. The in service failure rate of transformers is not expected to rise. Many transformer changeouts occur as a result of load increase beyond the transformer s capacity rating. Transformers of 100kVA and above have maximum demand indicators fitted. Transformers below 100kVA have load limiting fuses fitted on the low voltage side. Transformer upgrade takes place when two subsequent annual readings of 10% over nameplate rating are recorded, or when load limiting fuses are repeatedly ruptured due to overload. Load increases resulting from new consumer connection applications or existing connection upgrades also generate proactive transformer changeouts. Distribution Transformer Routine and Preventative Maintenance Distribution transformers are maintained when they are released from service on the network for reasons of load increase/decrease or substation re-location due to underground conversion etc. Distribution transformer maintenance consists of tank rust removal and re-painting, oil treatment if oil acidity or moisture content has reached the point that insulation degradation is resulting and tightening of internal connections. The annual budget for distribution transformer maintenance is approx. $120,000. Distribution Transformer Refurbishment and Renewals An age based renewal policy and replacement programme for distribution transformers commenced in 2008/9. Under this policy, distribution transformers that have been returned to store as a result of load capacity changeout or in service failure are retired and replaced if they are older than 50 years. Those that are less than 50 years old will be inspected and tested and if OK, repainted, oil treated and returned to service. In service distribution transformers that are older than 65 years are scheduled for replacement within 5 years. A renewals budget provision of $253,000 per year over the term of this plan has been allocated LV Underground Cables Network Tasman Asset Management Plan Page 88
89 The LV cables are mainly 70 sq mm, 95 sq mm, 185 sq mm or 240 sq mm stranded aluminium conductor 3 or 4 core cables with either PVC or XLPE insulation. There are no paper insulated low voltage cables on the network. As with the HV cables, they are well bedded in fines such as crusher dust and protected from overload through conservatively rated HRC fusing. LV Underground Cables Routine and Preventative Maintenance The strong UV conditions experienced in the Nelson area have caused cracking and deterioration of XLPE insulated cable tails when low voltage cables are terminated to overhead line. For all new cable to overhead line terminations, the tails are now covered with UV resistant heatshrink. Existing terminations are covered as they are identified during survey rounds. LV Underground Cables Refurbishment and Renewals There are no end of life replacements of any LV cables planned in the time horizon of this AMP Service Boxes There are 12,284 service boxes in place on the network. There are three main types. These are all concrete pillar boxes type (1970 to 1978), concrete base/pvc lid type (1979 to 1985), and all PVC type (1985 to present). In general the service boxes are in good condition with no identifiable age-based deterioration. They have a moderate ongoing maintenance overhead, however, due to the fact that they are prone to damage from vehicle interference. Service Boxes Routine and Preventative Maintenance The PVC type service box lids often require resecuring after they have been struck by vehicles. Sometimes damage in these cases extends to necessitating fuseboard repairs as well or complete replacement of the box. In each case an assessment is made as to whether or not the box should be protected by bollards or relocated to avoid repeat incidents. Service boxes are subject to a five yearly safety inspection programme. Some boxes have been buried or made inaccessible by local landowner landscaping activities. An annual amount of $20,000 is provided in the 400V underground lines maintenance budget for this type of remedial work. Service Boxes Refurbishment and Replacement There are no plans for the refurbishment or replacement of service boxes in the time period of this plan Connection Point Assets These are mainly low voltage fuses, carriers and bases. To date most outdoor units have been porcelain as these give the best service in the Nelson UV conditions. Replacement of rewireable links with HRC cartridge fuses is ongoing as fuses fail or as LV crossarms are replaced. The HRC type fuse has advantages of more stable and accurate fusing performance and longer life. All new connections deploy HRC cartridge fusing Ripple Control Transmitters There is one ripple control transmitter within each bulk supply region. All of these are solid state injection plants. All are in good condition and monitored annually. Ripple injection frequencies are 475Hz and 233Hz. The convertor equipment at the Motueka ripple injection plant was upgraded during Network Tasman Asset Management Plan Page 89
90 The convertor equipment at the Stoke ripple injection plant was upgraded during The convertor equipment at Motupipi was upgraded during Network Communications Systems The network system utilises three communications systems. These are the SCADA fibre and mesh radio communications network and the VHF voice mobile communication network. The SCADA communications network comprises fibre optic and radio links from zone substations and ripple injection plants to the control centre at Hope. Three point to point microwave radio links also connect the substations at Cobb and Upper Takaka in Golden Bay to the Hope control centre. These links were purchased in conjunction with the 66kV asset transfer in A mesh radio communications network was installed in 2015 allowing improved communications to 64 field autoreclosers and sectionalisers distributed across the network. This system is expandable to incorporate more distribution automation devices in the future. The mesh radio system replaces three E band data repeater channels Other Specific Renewal Projects Marsden Rd Stoke - Double Circuit 33kV There is a section of double circuit 33kV line in Marsden Rd, Stoke. It is proposed to replace the double circuit configuration with standard single circuit flat configuration utilising a 450A aluminium conductor. The project cost is estimated at $80, VEGETATION The Electricity (Hazards from Trees) Regulations 2003 became fully effective on 1 July These regulations require power companies to survey lines and advise tree owners when their trees are encroaching powerlines. In the first encroachment, the tree is given a trim at the line company s cost. For subsequent encroachments the tree owner has the option of arranging and funding trimming of the tree him/herself or declaring no interest in the tree, at which point the line company may trim or remove the tree at its discretion. NTL has introduced a formal tree owner notification operation and administration system to meet the requirements of these regulations. Two vegetation notifying staff perform regular patrols of the overhead network to identify and notify tree owners of their obligations and options under the regulations. The aim is to reach a steady state where the network is fully patrolled every 22 months. This return period has been identified as being appropriate given the typical growth rates of species in the Nelson environment. NTL s area enjoys a mild climate. Rural land use in the area includes forestry, horticulture and pastoral farming. There is also a high and increasing number of small lifestyle blocks in the area. Landowners place a high value on trees and vegetation. Many of the rivers in the area have banks supported by species such as willow and poplars. Much of the approx. 2600km of overhead line traverses private land, both urban and rural. The result of these environmental conditions is that vegetation management is a significant ongoing part of operations for NTL. This has been recognised over a number of years and policy has been evolved to deal with it in an effective and efficient manner. This has involved identifying the parties involved, and within the legal framework identifying the responsibilities of each, and then setting drivers so that optimal decisions are made by the parties. Network Tasman Asset Management Plan Page 90
91 As part of its risk management processes, NTL surveys its network for the risks of damage from unstable trees within fall distance of its network. Such trees are not covered by the Electricity (Hazards from Trees) regulatory notification process, however they remain significant risks. NTL seeks to recover losses from damage to its network caused by trees falling through lines. Claims against tree owners for damages resulting from outages caused by trees falling through lines are also possible from other consumers. In cases where fall distance tree hazards exist, the owner of the tree is made aware of the hazard and the potential liabilities. Advice on options of mitigating the risks is also given. As an option for the tree owner to consider, NTL offers a free felling service to the tree owner. Line Corridors There are sections of line on private property that traverse land that is not farmed or otherwise specifically managed by the landowner. Typically this land has been de-stocked and left to revert to bush. Gorse and broom are the typical dominant species to take hold in such cases, and in the Nelson climate these species thrive. If left untreated, within a few years gorse will grow to 4 to 5 metres in height and become impenetrable. In order to maintain access to the lines and avoid creating fire risks should the vegetation overtake the conductors, NTL takes a pro-active approach to managing these areas as line corridors. Experience has shown that the most cost effective management strategy is to keep line corridors open with vegetation within kept at a low level. This requires treating the areas regularly with low cost methods such as hand cutting and aerial or ground spraying. The long term aim is to encourage grass cover and/or low and slow growing native species. Forestry Corridors Forestry Corridors are a special subset of Line Corridors. NTL has been working with major forest owners to formulate an operating policy that makes the best use of the skills and knowledge of both the forest owner and the line company to manage the risks of power lines coexisting with forestry blocks. The result has been an operating agreement that considers a corridor of land of general dimensions 20-30m either side of the line. The interest/no interest principle is applied to this corridor where the forest owner decides which trees he has an interest in, all others are passed to the line company to manage. Following establishment of the line corridor the ongoing maintenance of it is the responsibility of the line company. The operating agreement does not assign liability in the case of forest fire, it merely serves as a joint process to lower the risks of forest fire for all parties. Access Tracks NTL has many access tracks on private land in order to access poles that are typically part of hill country lines. The maintenance of these is generally the subject of individual agreement with affected landowners. The standard of maintenance is all weather access for 4 wheel drive vehicles. Maintenance activities include water table and cutoff clearing, and track spraying. This work is put out to contract outside of the Network maintenance contract. Vegetation Management Expenditure Budgeted vegetation expenditure is given in the maintenance expenditure projection table of Appendix F. The figures going forward over the time period of this plan are based on information held at the time of writing. Five vegetation management budget categories are identified. These are: Regulatory Free Trims All free trims arising from the Electricity (Hazards from Trees) regulations. Regulatory Removals - All removals arising from the Electricity (Hazards from Trees) regulations. Network Tasman Asset Management Plan Page 91
92 Fall Distance Hazard Removals Removals of Trees identified as significant fall hazards to overhead lines. Line Corridors Maintenance of line corridors. Access tracks Maintenance of access tracks. Vegetation expenditure has stabilised after many years of concentrated effort aimed at achieving long term lowest cost vegetation management. A previous backlog of tree clearance and removal work has been cleared and the steady state has been reached. It is unlikely that tree management costs will decrease significantly from the forecast levels as the regulations require that the lines company offers a free trim or removal for all trees not previously attended. As new vegetation is continuously appearing then there is an ongoing overhead for the lines company. Increased costs of working in the vegetation management area have come about through traffic management requirements. More costs are possible through pending revisions of tree clearance codes of practice and regulations. An independent review of vegetation management policy and practise was completed during This review concluded that NTL vegetation expenditure levels are in line with similar networks in NZ and that its policy and practise are aligned with good industry practise. Network Tasman Asset Management Plan Page 92
93 7 NON NETWORK ASSETS This section provides a summary of non network assets. These are material assets that are necessary and used for the purpose of management of the electricity distribution network. 7.1 NON NETWORK ASSET DESCRIPTION Network Tasman s material non-network assets are described in the following table: Type Sub Type Description IT and Technology Systems Network Modelling Software CYME Dist Loadflow Geographic Information System (GIS) ESRI ArcGIS Asset Management Systems NTL Hope Main Office Office building including PC Computer Network Hardware Contractors Depot - Hope Office building and workshops Contractors Depot Takaka Office building and workshops Contractors Depot - Murchison Office building and workshops Motor Vehicles 1 x Toyota Cruiser 4WD Line Survey 2 x Daihatsu Terios Vegetation Survey 1 x Nissan Leaf Office 2 x Toyota Hi-Lux 4WD - Technicians 1 x Mitsubishi Outlander - Office Plant Tools and Equipment 1 x GPS/Ruggedised Laptop 2 x Portable Power Monitors 7.2 NON NETWORK ASSET DEVELOPMENT, MAINTENANCE AND RENEWAL POLICIES Development Network Tasman s asset management practises are now mature and well bedded in to steady operations. All procedures are supported by developed information systems that have been evolved over many years. There is no specific plan for further investment into systems development, however it is NTL s policy to monitor technological developments in the field of asset information collection and process automation. Any identified non network asset development project will be carefully analysed and must show operational and economic justification via a business case to the board. Maintenance and Renewal Non network assets are maintained in good working order during their expected economic life. At the end of their economic life, non-network assets are replaced unless they are rendered obsolete or redundant due to a development initiative. 7.3 NON NETWORK ASSET CAPITAL, MAINTENANCE AND RENEWAL PROJECTS There are no large individual non network asset capital works projects or significant maintenance projects planned for the next five years. The following replacements/renewals are budgeted: Asset Replacement Computer Hardware and Software Vehicles, Plant and Equipment 2019/ / / / / / / / / / N.B. Figures are 2018 dollars and do not include inflation adjustment. Network Tasman Asset Management Plan Page 93
94 8 RISK MANAGEMENT 8.1 OVERVIEW Sections 5.5 to 5.7 of the AMP detail the network design issues related to maintaining a prudent level of security of supply, in order that the operating reliability of the network is kept at levels consistent with good customer service yet delivered at a reasonable price. The attainment of an optimum balance of operating cost against network supply quality and reliability is the primary focus and objective of this plan. Although this AMP is primarily focussed on the distribution network asset owned by NTL, risks of loss of supply to consumers include risks of failure of the Transpower transmission system to deliver supply capacity to the NTL Grid Exit Points (GXP s). In recent years, capacity constraints in the Transpower transmission network, particularly during times of peak load have become apparent. Transpower have addressed these by completing the stringing of the 3rd 220kv circuit from Islington to Kikiwa which has increased capacity by approximately 100MW and it is working over the next few years to complete various tactical upgrade projects. Beyond approximately 2030 however the transmission capacity into Christchurch may need to be further augmented. Transpower are now evaluating transmission and non transmission options. NTL has a high degree of reliance on supply from Transpower GXP s in its network and there is very limited transfer capacity between GXP s. The Stoke GXP in particular carries the major load including Nelson City. Total or partial loss of transmission capacity to the GXP s is dealt with in the Network Tasman Disaster Readiness and Response Plan. 8.2 RISK MANAGEMENT STRATEGY The primary risk strategy employed by NTL is to limit the load on single line feeder circuits that cannot normally be repaired under single contingency event scenarios within 24 hours, to that load which can be supplied by a transportable generator. Once these load limits have been reached on these spur circuits then permanently available alternative supply circuit routes are developed. Other risk events of a more catastrophic nature such as complete loss of substation switchboards are subject to specific contingency plans and these are detailed in the company s disaster recovery plan. Risk events not directly resulting in loss of supply such as oil spills are also treated through documented contingency plans in the disaster recovery plan document. In all commercial contracts with customers, Force Majeure applies as defined in the Use of Systems Agreement (UOSA). 8.3 RISK MANAGEMENT BACKGROUND The core business of NTL is electricity distribution. The primary strategic goal of the company is to provide a reliable electricity supply service at minimum cost whilst achieving a satisfactory return on its assets. The stakeholders of NTL are its shareholders, its customers who are electricity retailers or end-use customers, its employees, and its suppliers (TransPower NZ Ltd and contractors.) Risk is defined as the chance of something happening that will have an impact upon objectives. In the context of NTL s core operations, risk will be any event that could potentially be of detriment to the strategic mission of the company as outlined above. The electricity distribution business is characterised by its asset base, that is the poles, lines, cables and transformers making up the distribution system. This asset base is large in value in relation to the business Network Tasman Asset Management Plan Page 94
95 turnover and the risks associated with not managing this asset well are significant not only to NTL as a company but also to the wider community who are its shareholders. Risks relevant to NTL take many forms. These may be categorised as follows: Business Risk Commercial Risk Political Risk Economic Risk This document analyses and records the risks of physical failure or damage to the assets that make up the distribution network and that results in loss of supply to customers for more than 24 hours. Dealing with power supply interruptions of duration up to 24 hours are part of the normal business of network management operations. The process of risk management undertaken follows NZS The steps are: Establish Risk Context Identify the Risks Assess the Risks Treat the Risks Monitor and Review The network is broken down into its major constituent parts and through a process of risk identification and assessment, a risk grading is assigned to events affecting each part. The specific risks that are inherent to each component are identified and highlighted. Analysis of these risks then leads to plans for either risk mitigation and reduction or to risk acceptance with reference to contingency plans. Contingency plans are the subject of a separate document entitled Network Tasman Limited Disaster Recovery Plan. This document is appended as Appendix L. Reference is made to three documents related to risk management of the NTL network. Although now dated, the subjects of these reports remain unchanged and the reports are still current. Natural Hazards Risk Analysis Report Feb 1997, Sedgwick Ltd Risk Profile for Tasman Energy Ltd Sept 1998 Sedgwick Risk Services Ltd Seismic Assessment of Network Tasman Structures Dec 1998 Worseldine and Wells Ltd 8.4 NETWORK RISKS CONTEXT An electricity distribution network is made up of a series of component parts, the total set being arranged in a supply hierarchy. At the top of the hierarchy are the extra high voltage subtransmission lines and cables that transmit bulk electricity from the national grid bulk supply point to the power companies zone substations. These lines and cables typically form a network that for security of supply reasons allows a number of alternative routes of supply to important zone substations. Because of the nature of subtransmission as opposed to distribution, the number of lines in this grid tend to be low in number, however each typically has high strategic importance. Next in the supply hierarchy is the zone substations themselves. These break the voltage of supply down from the subtransmission voltage to the primary distribution voltage. Typically, a zone substation will have one or Network Tasman Asset Management Plan Page 95
96 two subtransmission lines feeding in to it, and there will be four or more HV distribution lines feeding power out of it. The HV distribution lines form the third tier in the supply hierarchy. Typically, these are 22,000V or 11,000V lines and underground cables that are configured in a grid in urban areas or more simply as a long distribution feeder in the rural areas. The HV distribution lines are run through streets and along roads or over private land to within 300m of the end use customers. The grid pattern in the urban areas provides for redundancy and backup circuits in the event that a particular section of line or cable should become faulted and unavailable for service. In the rural areas, such interconnections and multiple routes of feed are less common and if the line develops a fault, then the power remains off until repairs are completed. The fourth level in the supply hierarchy is the distribution substations. These substations step the supply voltage down from the HV distribution voltage of 22kV or 11kV to 230/400V. This is the voltage of supply for most end use electricity customers. Distribution substations can be found in most streets and along roads and take the form of pole mounted transformers, kiosks, or pad mount transformers located on street berms. The fifth and final level in the supply hierarchy is the low voltage network. These are lines and cables that distribute power from the distribution substations to the end use customers' connection points. Due to voltage drop constraints, these are generally fairly large conductors and generally limited in length to around 300m. The following table is indicative of the numbers of customers that can be associated with any one component in the various supply hierarchy levels No of Feeders or Subs Max Customers per Feeder or Substation Subtransmission Feeders 11 6,000 Zone Substations 13 5,000 Urban HV Distribution Feeders 22 1,500 Rural HV Distribution Feeders 26 1,000 Distribution Substations 4, O/H LV Distribution Feeders 2,200 (est) 40 U/G LV Distribution Feeders 1,000 (est) 50 From the above table, it can be seen that the higher level components of the network tend to be few in number but each component supports a high number of customers. Lower level components are greater in number but support a much smaller number of customers. From a risk management point of view, the subtransmission network supports a high number of customers using a small number of feeder circuits. This leads to the situation where the probability of a loss of supply event at this level is low but the consequence of failure is very high. At the other end of the supply hierarchy, where there are a large number of LV distribution network lines, the probability of a loss of supply event occurring is high but the consequence is low. An added factor of the consequence of a failure when a loss of supply to customers is concerned is the time needed to restore supply following the incidence of a fault that generates a loss of supply. Loss of supply can be measured in Customer hours whereby loss of supply to one customer for one hour generates 1 customer hour of unavailability. Risk can be defined as: Risk = Probability of Failure x Consequence of Failure The risk analysis in this report is based a numeric ranking of risks for the various components of the network. Risk of Non Supply for the purposes of the risk ranking of NTL s network is defined as: Network Tasman Asset Management Plan Page 96
97 Risk of Non Supply = Annual Failure Probability x Customers Affected x Duration of Outage An event with a risk level of 5000 therefore could be an event that typically occurs once per year, resulting in loss of supply to 5000 customers for one hour. Another event with the same risk level could have a twice per year probability of occurrence and effect 250 customers for 10 hours. 8.5 RISK BENCHMARKING Events with a low risk level may be accepted as events that can be dealt with in the normal course of operating a distribution network. Events falling in to this category are outages caused by foreign interference with the network such as vehicle accidents, bird strikes and the like. It is necessary to establish a benchmark risk level in order to identify those risk events that require consideration for mitigation treatment. Events with risk rankings below this benchmark are accepted as run of the mill hazards managed by everyday operations. The following table gives an indication of the dimensions for an event risk level of 2000, for outages of duration one day. Event Return Period (Yrs) Event Frequency Outage Duration Customers Affected The risk ranking of 2000 is an appropriate benchmark cut off against which event risk rankings can be identified for further risk treatment. A decision prompt is generated for events falling above this as to whether or not some mitigation action should be taken to reduce the risk level. This level of risk corresponds to events that are outside of the type of events that occur in the normal course of running the network. Events of risk rating above 2000 include wind storms etc that generate environmental forces beyond the design strengths of the overhead network. Other less severe storms but longer lasting are also in this risk category. Such events are beyond the capacity of the normal systems and processes of fault response to resolve within the timeframes of the Use of Systems Agreements (UOSA) that NTL has its retailer customers. Risk treatment may involve capital expenditure to reduce the probability of the event, or the number of customers affected, or contingency planning to reduce the duration of the resulting outage. Other options include insurance to cover any financial effect of the risk on the company. 8.6 NETWORK RISK ANALYSIS Low Voltage Network Events resulting in loss of supply on the low voltage network are fairly frequent (approx. 100 times per year). Repair and supply restoration times are short for most events on both overhead lines and underground systems due to the low grade of conductor insulation required and the high degree of development of repair kits and connector systems etc. In urban areas, there is a significant amount of redundancy in low voltage systems since circuits are often run to meet up with nearby supply substations. This allows supply restoration via connection through alternative supply routes in many cases. Network Tasman Asset Management Plan Page 97
98 Since the low voltage networks exist on a 300m maximum radius of distribution substations, the susceptibility of the networks to environmental effects since as weather, seismic events and vehicle collisions is very much site specific. In general, overhead systems are more susceptible than underground systems, however the time taken to identify and repair a fault on overhead is usually much shorter than with underground cables. Risks of prolonged non supply due to simultaneous damage of multiple low voltage networks caused by environmental conditions such as wind storms and earthquakes are likely to carry higher consequence although with very low probability. The resulting risk level is significant however. The low voltage overhead networks are generally resilient to the wind storms of return frequency up to 1 in 20 years. The later overhead networks are generally designed around a peak wind speed of 130km/hr, however at such wind speeds the influence of windborne flying debris rather than mechanical line strength tends to dominate performance. Fortunately wind storms of such strength are generally rare in the Nelson area. Four have been experienced in the last 40 years. Similarly, the networks are resilient to earthquakes of strength up to MMV, however earthquakes of strength up to MMVIII have a moderate probability in the Nelson region Earthquakes of this strength may result in damage to both overhead and underground reticulation with simultaneous faults in many areas. The risk assessment matrix for events affecting the LV networks is as follows. Risk: Loss of Supply due to event on Low Voltage Overhead Network Event No Events per year over entire system Feeders in System Probability of event on any individual Feeder Customers Affected Restore Time Tree through Line Pole knocked down by vehicle All single point effect events Wind storm >130km/hr ,960 Major earthquake ,160 Risk Event Risk: Loss of Supply due to event on Low Voltage Underground Network No Events per year over entire system Feeders in System Probability of event on any individual Feeder Customers Affected Restore Time Insulation failure in LV Cable Connection or Joint failure All single point effect Events Wind storm >130km/hr Major earthquake ,040 Risk There is little more that can be done to mitigate the effects of major earthquake or major wind storm on the low voltage network other than to possibly relocate lines underground in some areas, and to be cognisant of objects or vegetation close to overhead lines that could damage them in the event of high winds. The risks of such events are best managed through effective contingency planning and insurance. Distribution Substations Distribution Substations on the NTL system take a number of forms. These can be pole or platform mounted overhead substations, or Pad or Kiosk enclosed ground mounted substations. Faults in substations can range Network Tasman Asset Management Plan Page 98
99 from simple protection fuse ruptures to internal faults within substations resulting in total loss of the transformer and or the substation support structure. Lightning storms affecting a wide area pose a significant risk of overwhelming the faults response capability As transformers contain insulating oil there is also risk of oil spillage associated with all substations. Although not necessarily affecting supply restoration, oil spillage is an event that must be dealt with quickly to avoid infiltration into waterways etc. Oil spill management is the subject of a contingency plan included in the NTL disaster recovery plan. The effect of major earthquakes on our overhead and underground distribution substations is the subject of a report by consulting civil engineers Worseldine and Wells dated December The management of earthquake risk through insurance is the subject of another document entitled Risk Profile for Tasman Energy Ltd by Sedgwick Risk Services and dated September As with most of our earthquake risk assessment, the risk associated with a major earthquake affecting the distribution transformers can be very high, however no amount of capital expenditure will bring this down to a level of complete comfort. Therefore, NTL must accept such risk but plan for an event through contingency plans and control financial risk through appropriate levels of insurance. An assessment of events resulting in loss of supply with distribution transformers is given in the following: Risk: Loss of Supply due to event on a Distribution Substation Event No Events per year over entire system Stations in System Probability of event on any individual Substation Customers Affected Restore Time Internal Substation fault Connection or Joint failure All single point effect Events Lightning storm Major earthquake ,080 Risk High Voltage Distribution Network Events on the HV distribution network resulting in loss of supply are relatively frequent. Fault statistics show an average incidence of 100 events per year with an average outage time of 1.2 hours. The average number of customers affected by any one fault is 280. Of this the overhead network has an average incidence 95 events per year, and the underground network an incidence of 5 per year. Most of these faults are the result of external interference with the network system. Examples of sources of such interference are bird strikes to overhead lines, vehicle collisions, contractor activity (cranes, excavators), animals and trees. Overhead Lines: Risk: Loss of Supply due to event on High Voltage Overhead Network Event No Events per year over entire system Feeders in System Probability of event on any individual Feeder Customers Affected Restore Time Tree through Line Pole knocked down by vehicle Risk Network Tasman Asset Management Plan Page 99
100 All single point effect events ,176 Wind storm >130km/hr ,2760 Major earthquake ,680 A higher risk ranking for overhead HV lines comes from a high susceptibility to externally initiated fault events, resulting in a high probability of event occurrence. The consequences of each event are moderate however since the supply restoration times are short and the number of customers affected by an event moderate. It is the combination of high probability and moderate consequence that generates the high risk. The probability of an event that would result in prolonged loss of supply is much lower, and is generally limited to extreme wind conditions such as cyclones and major earthquakes. NTL currently manages the risk through the deployment of a comprehensive 24hr fault repair operation. Clearly however, any further efforts to mitigate overall risk of loss of supply to customers should be focussed in this area. Possible practical treatment actions could include: Installing additional switchgear and line sectionalising equipment (reduces number of customers affected by a fault. Trefoil reconstruction of overhead lines (reduces susceptibility of overhead lines to birds etc). Additional automation of system by extension of SCADA system (reduces average time to restore power following a fault. Underground HV Cables Risk: Loss of Supply due to event on High Voltage Underground Network Event No Events per year over entire system Feeders in System Probability of event on any individual Feeder Customers Affected Restore Time Insulation failure in HV Cable Connection or Joint failure All single point effect Events ,562 Wind storm >130km/hr Major earthquake ,160 Risk Given the low incidence of underground HV cable faults the risk levels associated with this part of the network are more or less at an acceptable level at present. The benchmark of 2000 risk points can be used as an indicator however in the urban area particularly where underground HV spur systems are present. On a spur system there is no backup cable route in the event of a fault, therefore restoration time for customers supplied on the spur are set by the time taken to repair the fault. The longest repair time cable faults are those requiring section replacements and these have a typical repair time of hours. In order to limit the number of customers that can be affected by a single underground cable fault, a network design standard limit on the load on a domestic underground HV spur system of 500kVA is in effect. This is the maximum load that can be supplied by a truck mounted temporary generator. Zone Substations and Subtransmission Risk assessment matrices for each of NTL s 12 zone substations and 3 Subtransmission substations are included as Appendix J to this document. Risks associated with the 33kV supply network that feeds these substations are included in these matrices. Network Tasman Asset Management Plan Page 100
101 In this exercise, each of the major substations and other major components of the supply network were analysed by working through a specific set of criteria designed to identify the specific weaknesses and inherent risks associated with that component. The following numeric values are assigned to the Probability and Outage Duration Probability Return Period Value Outage Duration Action to Restore Restore Time (hrs) High (H) 1 in 10yrs 0.1 Extreme (E) Extensive Repairs 168 Med (M) 1 in 50yrs 0.02 Long (L) Many Long Jobs 48 Low (L) 1 in 100yrs 0.01 Medium (M) Long Jobs/Many Small 12 Negligible (N) 1 in 500 yrs Short (S) Minor Repairs 6 Instantaneous (I) Switching Only 2 The results of the risk assessments for each zone substation are discussed below: Motupipi Substation This substation is a subtransmission substation supplying two zone substations in turn supplying 3,200 customers in Golden Bay. The 66kV supply to Motupipi substation is a single circuit overhead line from Upper Takaka, therefore providing only N level subtransmission security. The risks of loss of supply include the risks of loss of service of this line for a long period. As single structure failures can be repaired within a number of hours, it is longer repair time events such as loss of three or more spans that are critical. The line traverses rolling hill country with a few river crossings. Risks of loss of service to this extent are low probability. The substation is a simple outdoor switchgear design with 4 single phase transformers, three of which are required to be in service at any time. Events resulting in lengthy outage for the substation are low in probability. Loss of two or more transformer units from earthquake damage or lightning strike would be the most likely scenario for an extended outage event. Hope Substation This substation supplies 2,300 customers in the Waimea Plains area. The main 33kV supply line to this substation is backed up by an alternative 33kV circuit on a separate line route giving an N-1 level of subtransmission security. The major risks associated with Hope substation include the risk of loss of 33kV supply for a prolonged period due to an event causing the loss of more than 3 spans such as a landslip on the hillside area that the line crosses to the south of Stoke Substation at a time when the alternative supply circuit is not available. There is a high earthquake risk in the region and this substation could be affected. The switchroom building is being replaced with a building of modern seismic strength. Beyond this the major earthquake event is covered in the Disaster Recovery Plan (Ref. Appendix L). The loss of major components of the substation such as part or all of the indoor switchboard or both of the transformers are the other major risks associated. Such events have a low probability but could result in a lengthy outage for many customers. These events are dealt with through specific contingency plans documented in the Disaster Response and Recovery plan (refer Appendix L). Songer St Substation Songer St substation supplies the central Stoke area including 4,800 customers. The substation has a main and backup 33kV feeder supply providing N-1 level subtransmission security. Network Tasman Asset Management Plan Page 101
102 The greatest risk of loss of supply with this substation is the loss of 33kV supply to the substation through extensive damage to the two underground cables that run from Songer St to the substation at the rear of the Omaio Village. Both the primary and backup 33kV supplies to the substation come close together at this point. Such an event could come about through external interference such as excavation contractor error. As with the other major substations, the loss of the major components of the substation will result in loss of supply to many customers, however due to the very low probability of this occurrence, the risk is satisfactorily managed using a contingency plan. Annesbrook Substation The Annesbrook substation has a full backup supply circuit available within the 33kV network. The substation has N-1 subtransmission security. Therefore, the risk of loss of supply due to 33kV line fault is low. There are 5,200 customers supplied from the substation. As with the other major substations, the loss of the major components of the substation will result in loss of supply to many customers, however due to the very low probability of this occurrence, the risk is satisfactorily managed using a contingency plan. By far the greatest risk of loss of supply results from the medium probability of a major earthquake in the region. This risk is managed through contingency planning again. Founders Substation Founders substation supplies 2,400 customers in the Nelson north area. The substation has two lines of supply at 33kV, the primary line being an underground cable and the backup line being a hill country overhead line. The substation has two transformers providing full n-1 security. The risk of prolonged loss of supply for consumers supplied from the substation is now low. The substation feeds a much smaller number of customers than Hope, Annesbrook or Songer St. Therefore, although similar probabilities of loss of supply are associated, the extent of outage is greatly reduced. Again contingency plans for such events exist. Brightwater Substation This substation supplies the townships of Brightwater and Wakefield and the rural areas adjacent. There are 2,350 customers supplied from the substation. The substation is supplied via an open ring 33kV supply providing N-1 security, therefore the risks of prolonged non supply from loss of 33kV supply are low. The substation has two transformers in service and it now feeds a fairly wide area. In the event of equipment failure at the substation, the supply can be partially re-supplied via 11kV supply from the Hope substation. The risks of pro-longed non-supply to the area supplied by it are moderate. The risk of loss of the substation through major earthquake is the greatest threat to the system. Eves Valley Substation This substation under normal conditions supplies only one customer who is the Carter Holt Harvey sawmill. A nominal loss of supply consequence equivalence of 1000 customers is assigned to the station for the purposes of the risk profiling. The subtransmission security level is only N. The substation load can be backed up to a certain extent however via 11kV supply from Hope or Brightwater substations. Network Tasman Asset Management Plan Page 102
103 There are two transformers at the substation either of which can supply the full load. The 33kV and 11kV switchboards are both outdoor overhead structures. These can be repaired within 24 hours. Lower Queen St Substation Lower Queen St substation is dedicated to the supply of the Nelson Pine Industries Medium Density Fibreboard plant. The 33kV supply can only be partially backed up from the subtransmission network. The substation is therefore an N security substation only. This level of security is in agreement with the customer. Takaka Substation This substation is fed by a short overhead 33kV supply line that runs over flat land from the NTL substation at Motupipi. The subtransmission security level is N only. This short line can be repaired quickly in the event of failure however. The combined effect of low probability of occurrence, short repair times and a relatively small number of affected customers (2,300), results in a low risk ranking. The substation has a simple outdoor overhead busbar structure that can be almost entirely rebuilt in a short time following a major event. There are two transformers at the site, either of which can carry the total substation load. The substation site is on an alluvial plain that has been previously identified as being an earthquake liquefaction risk. A capital project to install an in ground platform supporting the transformers was completed in 1995, thereby greatly improving this risk hazard. The earthquake hazard is now managed in a similar fashion to the other substations through deployment of a contingency plan. Swamp Road Substation Swamp Road substation is the smallest substation on the network supplying approximately 900 customers. The 33kV supply is via a single 26km 33kV overhead line traversing mainly undulating farmland. The subtransmission security level is N only. Single point faults or structure failures on the line can be repaired fairly quickly however loss of more than five spans would result in an outage possibly lasting a number of days. A contingency plan for such an event possibly involving deployment of a diesel generator is included in the company s disaster recovery plan. The substation has a double transformer configuration with all outdoor overhead busbars. Either transformer can carry the total load of the substation. Contingency plans cover the major hazards of severe earthquake damage and coincident failure of both transformers. Mapua Substation Mapua Substation supplies approx. 2,200 customers in the rural area. The 33kV supply to the substation is via a long overhead line circuit that has interconnections to backup circuits over 35% percent of the route length. The substation therefore has only N level subtransmission security. The final 10km of the overhead line route is alongside a busy state highway. There are relatively frequent car vs pole events along this section of road. The 33kV supply to this substation is the greatest area of risk of loss of supply to consumers fed from this substation. There is a capital project in the asset management plan to provide an alternative overhead line as a backup for this section of line. The final 12km to the substation is via a four core underground cable giving a spare core in the event of damage to or failure of one of the three in service cores. Network Tasman Asset Management Plan Page 103
104 The substation has a double transformer configuration with all switchgear and transformers inside a building. Each of the 33kV and 11kV switchboards is built in two halves with a single bus section circuit breaker. Richmond Substation Richmond substation supplies approx. 5,000 customers in the Richmond area including the Richmond CBD and industrial area. The substation is supplied directly from the Stoke GXP, via a 6km underground 33kV cable. A full capacity alternative 33kV supply is available to the substation from the Railway reserve 33kV feeder which is on an entirely separate route. The substation therefore has N-1 subtransmission security. The substation has a double transformer configuration with all switchgear inside a building. Each of the 33kV and 11kV switchboards is built in two halves with a single bus section circuit breaker. As a result of the backup 33kV supply and the n-1 level of equipment redundancy at the substation, the substation has a low overall loss of supply risk ranking. Motueka Substation Motueka Substation supplies approx. 8,000 consumers in the the Motueka area including Motueka township and its rural environs. The substation is supplied by two 66kV feeder lines from the Stoke Substation 66kV GXP. The substation therefore has a full no-break N-1 security of supply. The substation has a double transformer configuration with all 11kV switchgear inside a building. The 11kV switchboard is built in two halves with a single bus section circuit breaker. As a result of the parallel 66kV supply and the n-1 level of equipment redundancy at the substation, the substation has a low overall loss of supply risk ranking. Cobb Substation Cobb substation is a subtransmission substation that connects the Cobb Power Station into the network. There are no load consumers supplied from the substation, however the Cobb Power station does have significance for NTL as NTL is contracted to provide line function services for the power station. The substation has two circuits feeding it at 66kV. If one circuit is unavailable then Cobb generation is still possible, but at reduced levels. There are two transformers at the substation, either of which can support the full output of the station. These are however owned by Trustpower who are the owners of the generation. The substation has a low overall loss of supply risk rating. Upper Takaka Substation Upper Takaka substation is a 66kV subtransmission substation that serves as a connection node in the 66kV line network. There are three 66kV circuit breakers at the substation which form the major and critical components. There are currently no offtake consumers supplied from the substation, although failure of some critical items at the substation could affect the supply to Motupipi substation. Given that the repair time of these items is short, (circuit breakers can be bypassed and protection reconfigured in an emergency) then the substation has a low loss of supply risk rating. Transpower GXP Substations NTL relies for its supply on delivery of electricity to four Transpower GXP s in its region. These are at Stoke 66kV, Stoke 33kV, Kikiwa 11kV and Murchison 11kV. Detailed risk assessment of these GXP s is beyond the scope of this document, however since NTL relies almost entirely on supply through these substations, then Network Tasman Asset Management Plan Page 104
105 consideration of the risks to NTL and the region as a whole of partial or total loss of supply from these GXP s (and the transmission lines supplying these GXP s) is warranted. In particular, NTL has a high reliance on the Stoke GXP. This GXP is the northern terminus of the South Island 220kV transmission backbone. It is also an interconnection point for the 66kV network that supplies the Motueka and Golden Bay bulk supply regions and connects the Cobb power station. The substation is also near a known faultline, as is the 220kV transmission line to it. NTL contracts with TransPower for supply to its network via the four GXP s. Supply reliability is the subject of a commercial contract between NTL and TransPower. TransPowers s Risk Management Plan and the performance of Transpower is therefore of the upmost importance to NTL. NTL has identified the risks associated with the supply from the Stoke substation and the other GXP s. Network Tasman s Disaster Recovery plan incorporates contingency planning for the event of partial or total loss of supply from one or more of the TransPower bulk supply points. This plan is appended as Appendix L. 8.7 EARTHQUAKE PERFORMANCE AND RISK A specific analysis of the associated risks and expected performance of the network under potential earthquake conditions has been undertaken. The results of this including any possible mitigation or special preparedness activities to be undertaken are discussed in this section. Network Tasman is part of the Nelson Tasman Engineering Lifelines group which considers the potential impacts and co-dependencies of lifeline organisations in the Nelson Tasman district. Information has been drawn from the work of this group in this analysis. The major active fault near the Nelson region is the Alpine fault. This passes through the Murchison district (Upper Matakitaki) and the Nelson Lakes in a northwesterly direction and runs along the Wairau Valley. Other fault systems which are still active but having a high recurrence interval are the Waimea-Flaxmore systems. The most recent major earthquake centred in the region was the Murchison earthquake of June This was a Richter 7.8 event which resulted in ground shaking intensity of Modified Mercalli (MM) scale MMVII to MMIX throughout the Nelson area. The Nelson Tasman district has a moderate probability of experiencing MMVII or greater earthquakes. Return periods (years) for Earthquakes of varying intensities are given in the following table: AREA MMVI MMVII MMVIII MMIX Nelson/Richmond St Arnaud/Kikiwa Murchison Ground shaking and peak ground accelerations in soft sediments up to 30m deep can be amplified with respect to bedrock accelerations. Liquefaction is also possible in when ground shaking exceeding MMVII occurs in saturated silty or sandy layers within approx. 20m of the surface and where high water tables exist. In Nelson City, conditions for amplified ground shaking and liquefaction particularly in the reclaimed areas around the port and Maitai estuary, but also in parts of Tahunanui and Stoke. When assessing the prospect of damage to the electricity network, it is necessary to consider the network into two parts. These are the subtransmission system and the distribution system. The subtransmission system consists of the point to point individual lines that carry supply at 33kV from the GXP to the zone substations and the zone substations themselves. Each zone substation has a dedicated 33kV subtransmission line. The Network Tasman Asset Management Plan Page 105
106 likely effects of a large earthquake on this supply line and the substation itself can thus assessed on an individual basis. The distribution network consists of the distribution feeders, street substations and low voltage feeders that distribute the supply out to all end use consumers. The distribution network can only be considered in a general sense as it is unavoidable that it passes into all areas to reach consumers including areas highly prone to liquefaction and amplified ground shaking etc. All structures are designed to withstand up to MMVII shaking, and there is little scope or justification for further strengthening of distribution network structures. In a MMVIII or greater earthquake, pole footing damage can be expected to occur at overhead platform substations due to the high top weight of the transformer. Damage to underground cables and pad mounted substations will also likely result where surface rupture or slumps occur. The network has redundancy in 11kV distribution cables and therefore a low level of underground cable failures could be tolerated without major loss of capacity to supply. In a major earthquake, pole footing failure from ground shaking may result in poles leaning. Such damage can be repaired fairly quickly to allow restoration of supply. The susceptibility and expected performance of the subtransmission network in a major earthquake is discussed by reference to individual zone substation sections in the following. Founders Substation This substation supplies the north Nelson area including Atawhai and Hira. The supply to the substation is via a 10km long underground cable from the grid exit point substation at Stoke. This is backed up with a back country overhead line that runs from Stoke GXP to the substation. The substation is built on reclaimed land that would be subject to liquefaction in a major earthquake event. The substation building and transformer pads have been constructed on piles down to bedrock and should therefore be immune to liquefaction at the site. The outdoor 33kV switchboard is not piled however and some damage (bus distortion and fracture of insulators) to the structure could occur during a major event. Only half of this structure is required to be in-service for the substation to take full load however and being outdoor overhead, repairs to damaged components can be effected fairly quickly. The structure has been designed to withstand some distortion and movement due to seismic events up to MMVII. To go beyond this would require significant capital investment, likely to be in the form of an indoor 33kV switchboard. Given the ability to fairly quickly repair damage to the outdoor switchboard in the event of a major earthquake, it is unlikely that such investment is justified. Annesbrook Substation Annesbrook Substation supplies the Tahunanui and Bishopdale areas. It also supplies the Airport under normal conditions, however the Airport can also be supplied from the Songer St substation. The supply to the substation is via relatively short overhead lines. Ground shaking and ground movement in a major earthquake may cause some poles to be leaning, but damage resulting in loss of line serviceability would be unlikely. The substation is on land that has low susceptibility to liquefaction but moderate susceptibility to amplified ground shaking. Like Founders it has an outdoor 33kV switchboard and indoor 11kV switchboard. The 33kV switching structure is susceptible to distortion and insulator breakage from severe ground shaking and movement. The substation has been completely upgraded within the last ten years. Heavy cables connect the 11kV switchboard to the transformer. The transformer bushing connections however lack flexible connections. This poses a risk of transformer bushing failure under earthquake conditions. Fitting of flexible connections to these connections is a sensible risk mitigation strategy that should be undertaken. Songer Street Substation This substation supplies the Stoke area. It can be backed up by 11kV supply lines from Annesbrook and Richmond substations. The supply for the substation is via a short overhead line running down Songer St. Two short underground 33kV cables from run into the substation from Songer St. Network Tasman Asset Management Plan Page 106
107 Like Annesbrook, the substation is sited on land that has low susceptibility to liquefaction but moderate susceptibility to amplified ground shaking. It has the same configuration as Annesbrook as well, in that it has an outdoor switchyard that will be susceptible to distortion and insulator breakage from severe ground shaking. The transformer 11kV bushings do not have the same type of cable box and are less susceptible to breakage. Earthquake strengthening at the substation was undertaken in the late 1980 s. There are no further modifications required. Richmond Substation This substation supplies the Richmond area, but it can be backed up by 11kV supply from the Songer St and Hope substations. The main 33kV supply from Stoke is an underground cable. Damage to this cable from ground movement in a major earthquake is possible but unlikely. Richmond substation is sited on land that has low susceptibility to liquefaction but could suffer amplified ground shaking. The substation has indoor 33kV and 11kV switchboards and outdoor transformers. The substation is well constructed and presents no special seismic hazard. Hope Substation Hope Substation supplies Hope and the Waimea Plains. It is supplied via overhead line from Stoke GXP. The overhead line traverses hill country that is susceptible to slumping. This may result in structure footing failures in a major earthquake. There is an alternative supply route available. The substation is sited on land that is not subject to liquefaction or amplification of ground shaking. Seismic strengthening of the outdoor 33kV structure and transformer mounting has been undertaken in the past. There are no further seismic improvements identifiable. Brightwater Substation This substation supplies the Brightwater and Wakefield townships and surrounding district. The normal 33kV supply is the Hope substation overhead line, therefore the same risks of loss of supply as to Hope substation apply. Brightwater substation is not sited on land subject to liquefaction or amplified ground shaking. The substation has the same configuration and earthquake resilience as the Hope Substation. Takaka Substation Takaka substation supplies the Golden bay area aside from the northwestern Collingwood district. The 33kV supply is via single overhead lines from Upper Takaka to Motupipi and on to Takaka. The site of the substation is known to be subject to liquefaction, but the transformer pads have been constructed to be resilient to this by being constructed on piles down to bedrock. Damage to the outdoor overhead structure could result from heavy ground shaking from an earthquake. Additional works to mitigate the risk of damage may be considered in the future. Swamp Road Substation (Collingwood) Swamp Road substation supplies the northwest Golden area. 33kV supply is via a long overhead line traversing undulating land that may be subject to high peak ground acceleration during a major earthquake. This could result in pole footing failures. The substation site is not subject to liquefaction. Seismic strengthening of the overhead outdoor structure has been undertaken in the past. Network Tasman Asset Management Plan Page 107
108 8.8 RISK MANAGEMENT CONCLUSIONS Risk analysis of the NTL distribution network reveals the following points: 1. There is a significant risk of loss of supply from an earthquake of MMVIII or greater strength. 2. After the risk of non-supply resulting from a major earthquake, events affecting the HV overhead network supply have the highest risk ranking. This is reflected in reliability statistics for the network. 3. Aside from the effects of a major earthquake, the risks of loss of supply due to failure of the LV network and distribution substations is small. Incidents in this part of the network are adequately managed with the current 24hr availability fault service. 4. Due to the nature and extent of the HV overhead network, NTL carries significant risk of loss of supply to customers from events caused by third party interference. The high risk grading for this part of the network comes from a high probability of loss of supply rather than a high consequence since the repair time for most fault incidences is fairly low and the number of customers affected is moderate. Although currently adequately managed through the 24hr fault service and contingency planning, reducing the susceptibility of the overhead network to external influence or reducing the consequence of an event would serve to improve the ongoing reliability of the network and lower the risks of non supply. 5. The HV underground cable network generally has a low loss of supply risk rating, however a limit to the number of customers supplied by HV spur cables is necessary. Prudent risk management will also include a contingency supply in the form of a temporary generator to meet the spur circuit load whilst cable repairs are made. 6. Loss of supply at zone substation level generally carries a lower risk grading than HV distribution lines. Timely implementation of the capital work upgrade planning as included in the AMP is required in order to maintain this risk ranking. 7. There is a high dependence for continuity of supply on Transpower, in particular on the 220kV transmission lines in the area and on the Stoke GXP substation. Network Tasman Asset Management Plan Page 108
109 9 PERFORMANCE MEASUREMENT, EVALUATION AND IMPROVEMENT 9.1 FINANCIAL AND PHYSICAL PERFORMANCE Last Completed Financial Year The information disclosure regulations require that the results from the last completed financial year are compared against that which was planned. At the time of writing of this plan, this is the 2017/18 financial year. These are as follows: CAPITAL EXPENDITURE ($k) Actual 2017/18 Budget 2017/18 % Variance 2017/18 Customer Connection % System Growth 1,242 3,106-60% Reliability, Safety and Environment 622 1,663-63% Asset Replacement and Renewal 1,993 2,903-31% Asset Relocation % ASSET MANAGEMENT CAPITAL EXPENDITURE 5,385 8,832-40% OPERATIONAL EXPENDITURE ($k) Actual 2017/18 Budget 2017/18 % Variance 2017/18 Routine and Preventative Maintenance 1,451 1,680-14% Refurbishment and Renewals Maintenance 1,984 2,119-6% Faults and Emergency Maintenance 1, % ASSET MANAGEMENT OPERATIONAL EXPENDITURE 4,696 4,763-1% TOTAL DIRECT NETWORK EXPENDITURE ($k) 10,081 13,595-26% SYSTEM MANAGEMENT AND OVERHEADS ($k) Actual 2017/18 Budget 2017/18 %Variance 2017/18 System Operations % Vegetation Management % TOTAL OVERHEADS 1,499 1,655-10% The above variances were discussed in the 2017 AMP review. Progress against Plan for first year of 2018/19 Asset Management Plan Network Tasman has a 31 March end of financial year. This means that at the time of review of the AMP, final financial results for the first year of the previous AMP are not available. As a proxy, forecast figures based on the 10 months completed are used in this performance review section. The financial progress against plan for network capital projects and maintenance and operations expenditure is summarised in the following tables: CAPITAL EXPENDITURE ($k) Forecast 2018/19 Budget 2018/19 %Variance 2018/19 Customer Connection % System Growth 5,861 7,856-25% Reliability, Safety and Environment 1,014 1,648-39% Asset Replacement and Renewal 2,734 2, % Asset Relocation % ASSET MANAGEMENT CAPITAL EXPENDITURE 11,330 13,093-14% Forecast Budget %Variance OPERATIONAL EXPENDITURE ($k) 2018/ / /19 Routine and Preventative Maintenance 1,773 1,845-4% Network Tasman Asset Management Plan Page 109
110 Refurbishment and Renewals Maintenance 1,473 1,906-23% Faults and Emergency Maintenance % ASSET MANAGEMENT OPERATIONAL EXPENDITURE 4,132 4,745-13% TOTAL DIRECT NETWORK EXPENDITURE ($k) 15,462 17,838-13% SYSTEM MANAGEMENT AND OVERHEADS ($k) Forecast 2018/19 Budget 2018/19 %Variance 2018/19 System Operations and Network Support % Vegetation Management 1,137 1, % TOTAL OVERHEADS 1,787 1,656 +8% Network Development Projects The completion status at near year end of the Network Development projects planned for 2018/19 is summarised as follows: Specific Development Projects Network Enhancement Project Year SumOfEstimated Expenditure Completion Region Cost Class Status 1MVA Generator Replacement 2019 $450, Stoke Reliability Deferred 33kV cable circuit upgrade Songer St - 600A 2019 $150, Stoke System Deferred Growth 33kV Cable Extension Wakapuaka Sub to Glenn System 10% 2019 $1,800, Stoke turnoff Growth Completed Andelect Replacement Merton Pl $10, Stoke Renewal Deferred Annesbrook Express Feeder CB and Cable 2019 $600, Stoke System 70% Growth Completed Fault Indicators Overhead Lines 2019 $12, Stoke Reliability Deferred Galv Conductor Replacement Central Road 2019 $25, Motueka Renewal Completed Galv Conductor Replacement Whakarewa St 2019 $15, Motueka Renewal Completed Interconnection Cable Tasman Heights to Deferred 2019 $100, Stoke Reliability Marsden Valley New Recloser Appleby Travellers Rest 2019 $25, Stoke Reliability 20% Completed New Recloser at Buller Gorge 2019 $25, Murchison Reliability 20% Completed New Recloser Brooklyn Valley 2019 $25, Motueka Reliability 20% Completed New Recloser Livingston Road 2019 $25, Stoke Reliability 20% Completed New Recloser Longford 2019 $25, Murchison Reliability 20% Completed New Recloser Ngaio $26, Motueka Renewal Completed New Recloser Rockville-Parapara 2019 $25, Golden 20% Reliability Bay Completed New Recloser Ruby Bay 2019 $25, Stoke Reliability 20% Completed New Recloser Shaggery 2019 $25, Motueka Reliability 20% Completed New Zone Substation at Wakapuaka 2019 $3,500, Stoke System 25% Growth Completed Radio Link Takaka Hill to Takaka Substation and Motupipi Reconductor Lower Queen St Swamp Rd to Lansdown Rd 2019 $60, Golden Bay 2019 $90, Stoke Reliability System Growth Deferred Completed Network Tasman Asset Management Plan Page 110
111 Replacement 23MVA 66/11kV Transformers Motueka Stage $250, Motueka System Growth Completed RTU Motueka Substation 2019 $30, Motueka Reliability Deferred RTU Takaka Substation 2019 $15, Golden Deferred Reliability Bay RTU Upper Takaka Substation 2019 $30, Golden Deferred Reliability Bay Transformer Bunding Eves Valley Substation 2019 $20, Stoke Reliability 10% Completed Transformer Bunding Hope Substation 2019 $30, Stoke Reliability Deferred Transformer Bunding Songer St Substation 2019 $30, Stoke Reliability 10% Completed Transformer Bunding Swamp Rd Substation 2019 $20, Golden Completed Reliability Bay Transformer Bunding Takaka Substation 2019 $20, Golden Completed Reliability Bay Underground Conversion Batuep Road 2019 $120, Stoke Relocation Completed Underground Conversion High St Motueka Completed 2019 $700, Motueka Relocation Stage 3 Upgrade to 66/110kV transformer at Stoke System 50% 2019 $0.00 Stoke Substation Growth Completed During 2018/19, major network development projects completed included: Power Transformer replacement Motueka Substation Underground conversion High St Motueka Stage 3. New Patons Road 11kV Feeder Bateup Rd Undergrounding. Contractor resource limitations influenced the commencement of some projects during 2018/19. A nationwide industry shortage of experienced and skilled staff is impacting resource availability in some work areas. All projects not started during 2018/19 are now planned to be started during 2019/20 or 2020/21. The deferment of projects will not compromise the safety or security of the network, Network Extensions Customer driven network extensions continued steadily during 2018/19. Approx 600 net new connections are forecast to be added to the network compared with the long term average of 500. Network Operations and Maintenance Planned and emergency network maintenance expenditure for the network is a little under budget for the year ($4.132m vs $4,745m). Ongoing network maintenance and renewal activity completed during the year, included pole, crossarm and line hardware replacements, trefoiling of 11kV circuits in some areas, tree trimming and removals and overhead line corridor reinstatement. Many testing programmes occur on a continuous basis eg distribution substation earth testing and switchgear and regulator operational tests. Vegetation Vegetation management expenditure for the 2018/19 year is forecast slightly over budget at $1,137k vs $1,005k. A catchup in notification rounds was achieved during 2018, but due to wet spring and summer conditions at the end of 2018, a backlog of cutting has built up going in to 2019/20. This however will be dealt with through the year and the vegetation budget has been increased slightly to deal with this. Network Tasman Asset Management Plan Page 111
112 Tree notifications during 2018/19 were mainly sixth and seventh round notifications under the Electricity (Hazards from Trees) Regulations. Tree trimming obligations for Network Tasman are dropping but tree removals are increasing as many land tree owners elect to declare no interest in trees that they have previously had trimmed under first free trim provisions. New commitments to provide free trims apply to trees growing out to the sides of lines that were not previously notifiable. Many trees were found to have branches reaching out that made them notifiable on the second or third round. The budget for 2019/20 is not significantly changed from the 2018/19 budget. Vegetation budget projections going forward are now fairly stable. 9.2 SERVICE LEVEL AND ASSET PERFORMANCE Reliability Performance against target for the 2018/19 year are forecast near year end as follows: Target Forecast SAIDI Planned SAIDI Unplanned SAIFI Planned SAIFI Unplanned CAIDI Planned CAIDI Unplanned Planned outages for the 2018/19 year are forecast to be over budget. There were a high number of planned outages in order to complete the light copper conductor replacements during the year. Going forward, planned outages are expected to continue to run at a higher levels than previously experienced until the conductor replacement programme is completed. Portable diesel generators will be deployed where practicable to minimise the impact of these works, however the nature of conductor replacement work is such that shutdowns of consumer supplies are inevitable since it is the means of distributing even locally generated electricity power that is being replaced. The SAIDI and SAIFI targets for the next nine years have been increased by 33% to allow for this project. Unplanned outages are forecast to be well over target for the year. This forecast includes three events that cut the supply to the Mapua Substation affecting 2,200 consumers. Two of these incidents were vehicle vs poles requiring pole changes in the single line 33kV supply to the substation. The third event was another foreign interference event where a sheet of iron was blown up into the 33kV lines. A total of 34 SAIDI points were accrued in these three events. A capital project to install a backup cable circuit for the Mapua substation has been approved and is now underway. Network defects caused approx. 10% of outage minutes for the year. The trend of reliability performance for the past five years is given in Appendix C. Other service levels targeted for 2018/19 were as follows: Service Criterion Performance Indicator Target 2018/19 Forecast 2018/19 Supply quality Number of proven voltage complaints 10 5 Operating Efficiency Breaches of UOSA 0 0 Operating Efficiency Network losses 6% 5.8% Operating Efficiency Faults per 100km line Operating Efficiency Peak demand/kva distribution transformers 30% 25% Financial Efficiency Cash operating costs per consumer $295 $285 Environmental Effectiveness Incidents of non compliant emission from network. 0 0 Network Tasman Asset Management Plan Page 112
113 Environmental Effectiveness Incidents of contaminant spill from network. 0 0 Safety Staff and Contractor serious harm incidents. 0 0 Safety Public injury incidents. 0 0 Safety Public property damage incidents 0 0 All service levels other than Distribution Transformer Utilisation (Peak demand/kva distribution transformers) are forecast to be in line with targets. The deterioration in distribution transformer utilisation is believed to be due to high levels of incremental rural load, particularly domestic life rural style subdivision developments and dairy farming. Both of these types of load require relatively high and dedicated distribution transformer capacity. The dairy farming load in particular is generally not operating at the times of overall system peak. This tends to add to overall distribution transformer capacity but significantly reduces overall transformer utilisation. Network Tasman Asset Management Plan Page 113
114 9.3 GAP ANALYSIS AND IMPROVEMENT PLANS There have been no significant changes in the AMP environment that are averse to the planning assumptions (refer section 9). Therefore, there has been no required revision of forecast expenditures due to changes in the planning assumptions. Developments in the disruptive technologies of Photovoltaic (PV) distributed generation, consumer based battery storage and electric vehicles are not yet significantly impacting network operations. At higher levels of penetration however, possibly occurring at the end of the ten year planning horizon, the potential for network voltage management issues exists. NTL is at the forefront of PV hosting at present in NZ and it has been actively involved in research and modelling of future uptake scenario s and network conditions. It has identified and taken steps to ensure that the network hosting capacity for disruptive technologies is maximised in a manner that is fair and equitable for all present and future users of the network. Electric Vehicle charging is expected to become a significant new load in the future. Investigative work is being undertaken at present to identify the potential network impacts of this new load type. Older overhead low voltage distribution networks in particular are expected to require capital investment, especially if charging occurs coincident with existing peak loads on these networks. Network Tasman has completed a rollout of advanced electronic meters (smart meters) throughout its network supply area. The advanced electronic meters provide increased capability for Network Tasman to monitor conditions on its network in real time. Potential improvements in customer service arising from this include: Pro-active voltage correction through analysis of voltage information. Reduction in consumer fault callouts through manual polling of voltage at the consumer s meter. Remote data logging capability allowing preliminary voltage enquiry analysis without site visit. Improved back feed management following network outage. Attainment of the network performance and consumer service improvements from the advanced meter deployment will be a key focus for the company over the next two to three years. Development of the network is running in line with load growth and associated development projects as detailed in the plan. High operating efficiency in terms of reduced network losses, reduced faults per 100km and reduced proven voltage complaints are a direct result of the major capital projects completed during the last few years and which are ongoing. Some major capital projects were deferred and others were not started due to contracting resource limitations. Network reliability performance underlying extreme weather or non-repeating events is also generally improving and the operational benefits of recent capital investments into upgraded network capacity are now being realised. Such investments have included the provision of additional backup circuits in the 33kV network and the shortening of 11kV feeders through the provision of additional feeder circuits. Network reliability remains ahead of the national average. The frequency of extreme weather events has increased in recent years. NTL includes all outage events in its reliability reporting. The extreme weather events have therefore impacted reported reliability statistics. When the effects of the extreme weather events are separated out, the reliability statistics reveal a very good network performance. It is neither economically justifiable, practicable or prudent to design and build the distribution network so that it is immune to the effects of major storm events. The long term target for unplanned outages of 75 SAIDI is in line with international best performance for rural primarily radial networks. Improving the inherent reliability beyond this level would be expensive to achieve, Network Tasman Asset Management Plan Page 114
115 as it would require that significant additional supply circuits are built in to the system. Such investment is unlikely to be justified. Reliability analysis by feeder completed during 2006 and annually updated since, shows that the worst performing feeders have been either long overhead 33kV feeders or the longest rural 11kV feeders (refer Appendix J). The analysis also shows steady improvement in inherent network reliability with the completion of the capital works programme. The poorest performing feeders are subject to capital works in the Network Development Plan, the implementation of which will improve the reliability of these feeders. Other strategies to further improve reliability are ongoing. These include installing fault indicators, trefoiling lines etc. These measures are targeted at reducing the outage customer minutes arising from third party incidents such as bird strikes. Overall Quality of Asset Management Planning NTL believes that the asset management planning and processes it has deployed are serving the company and its consumers very well, and that in most areas they follow industry best practice. The condition based maintenance systems that are in place combined with GIS provide comprehensive information that allows maintenance to be scheduled and executed by its works contractor in an efficient manner. The process provides for excellent risk management in that expenditure can be targeted and prioritised to minimise failure risk and optimise network performance. Maintenance expenditure therefore returns very high value. The results have been sustained low rates of faults combined with low cash operating costs when benchmarked against industry peers. The need for end of life renewals of some network components is recognised and the planning and implementation of programmes for these is underway. Failure modes are well understood and there is a good understanding of involved risk. The historical decisions taken to construct the network with long life concrete poles has meant that the requirement for pole replacements is not yet with us and should not be an issue for many years yet. The underground network is also relatively young due to the late entry into underground reticulation. Systems to cater for load growth in the network have performed well. The implementation of the AMP development programme has to date significantly boosted the capacity of the network and provided an appropriate level of security for consumer loads. Growth rates are monitored and further plans are in place to ensure that the network is developed in a logical step by step and cost efficient manner to cater for reasonably expected future growth in the area. Planning takes into account innovations such as distributed generation. The condition of the network and the asset management practises deployed by NTL were independently reviewed by consultants Mitton-Electronet Ltd during This review concluded that the overall network was in good condition and that the asset management processes in place were sound. A number of recommendations for improvement were made and are being implemented. Areas of potential for improvement in asset management processes are based on further improving information systems both in the office and in the field. Developments in the quality of information held and improving ability to access the information will lead to refinements in the timing of asset programmes and improved risk decision making. This should lead to reduced overall asset management cost. Future developments in asset management activity at NTL are therefore now focussed in the information technology area. Network Tasman Asset Management Plan Page 115
116 10 PLANNING ASSUMPTIONS 10.1 SIGNIFICANT ASSUMPTIONS This plan has been prepared in a manner consistent with the existing ownership, structure and business activities of Network Tasman. No changes to the existing business are planned and all information is based on this continuance. The significant assumptions made in this Asset Management Plan that have a material impact on forecast expenditure are identified as follows: Legislative and Regulatory Framework The AMP assumes that there will be no change to the company s obligation to maintain supply to existing consumers, nor any major changes to the existing legislative and regulatory required conditions of supply to consumers during the period of the plan. The Electricity (Continuance of supply) Amendment Bill requires that uneconomic lines are continued to be operated. This assumption has a significant impact on expenditure forecasts for NTL due to the number and extent of uneconomic lines in the NTL network. Since the legislation requires the company to effectively operate and maintain such lines in perpetuity, ongoing maintenance and renewals must be budgeted for. Maintenance includes not only the line hardware but also the line corridor and its access. It is estimated that forward maintenance expenditure projections would be reduced by up to 30% if the requirement to maintain supply through uneconomic lines was discontinued Stakeholder Needs This plan assumes that the desires of the company s stakeholders as identified by stakeholder surveys, do not materially alter for the period of the plan. These needs and desires relate to The specified levels of reliability and quality of electricity supply The specified levels of safety and security of the network. The current pricing policies. The main source of information for developing this assumption is feedback received from consumer surveys. Ref. Appendices K and L. If stakeholders required less reliability and quality of supply, then all projects listed under the category of reliability could be cancelled and some of the system growth category projects would be deferred. This translates to approx. 25% of the forecast capital expenditure. If stakeholders required a greater level of reliability and quality of supply, then the capital expenditures forecast in this plan would be need to be significantly increased Regional Economic Activity The plan assumes that economic activity in the region will continue to be based on primary production, fishing and forestry. The AMP assumes land use development will happen at a steady gradual rate, and that this rate will not significantly deviate from year past trends. Land subdivided for residential development will occur in line with recent trends in terms of density etc. Dairy conversions are assumed to also to continue in line with modern trends ie large automated dairy sheds. Large scale load is not expected for irrigation due to the high water tables in the area. Network Tasman Asset Management Plan Page 116
117 The principal sources of information for developing these assumptions are: Local territorial authorities Industrial customers Local business organisations If regional economic activity were to decrease such that there was no growth in electricity demand, then the forecast expenditures of this plan would decrease by approx. $5.5m per year or 66% Growth Funding The plan assumes that the growth based projects will continue to be funded from the combination of contributions from developers and additional income from increased consumer demand, in line with the company s Capital Contributions Policy. Details of this policy are available on the company website. This assumption is based on the experience to date that the company has with developing its network under a number of capital contribution regimes and on discussions with developers and local authorities with respect to each. The principal sources of information for developing the assumption are: Network costing models including ODV valuations built up by NTL. If growth based projects were not partially funded from developer contributions as under the capital contributions policy, then the forecast capital expenditures of this plan could be expected to increase by approx. $1.2m per annum or 15% Technological Developments in the Electricity Distribution Industry The AMP assumes that during the period of the plan, there will be no significant advances in the core technology of electricity distribution that could render the existing network obsolete. Solar PV generation with battery storage in particular are expected to complement or augment the grid supply but not replace it. Any technological gains adopted are expected to be complimentary to existing equipment and such improvements will operate in addition to the existing equipment. This assumption is based on the technical history of electricity distribution and on ongoing vigilance of industry developments. Principal sources of information from which this assumption has been derived are scientific and electrical engineering journals and publications Distributed Generation The plan assumes that distributed generation will continue to develop in the region, with no significant changes to the rates of uptake experienced to date. This assumption is based government policy statements and current regulations around the connection of distribution generation by consumers. The principal sources of information for developing this assumption are: Government policy statements Electricity Governance Rules Discussions with local suppliers and developers of distributed generation systems and schemes Supply from the National Grid The plan assumes that the existing supply capacity continues to be available at all Transpower GXP s and that future projected demands are available to the Nelson area via the national grid Network Tasman Asset Management Plan Page 117
118 This assumption is based on government policy statements and Transpower network planning and pricing policies. The principal sources of information for developing this assumption are: Government policy statements Electricity Governance Rules Transpower Annual Planning Report 10.2 FACTORS THAT MAY AFFECT AMP OUTCOMES The factors that may lead to a material difference between the prospective information of this plan and the corresponding actual information recorded in future disclosures are: Regulatory requirements may change requiring NTL to achieve different service standards or different design or security standards This may also impact on the availability of funds for asset management. Consumers preferences for supply reliability or willingness to pay for differing levels of service may change. The incidence of natural events such as earthquakes, floods, major wind or snow storms which cause major damage to the network. NTL ownership could change and different owners could have different service and expenditure objectives than those embodied in this AMP. The rate of growth in demand could significantly increase or decrease within the plan period. Load patterns within each GXP region could change resulting in movement from winter to summer peaks and vice versa. Significant embedded generation capacity may be commissioned within the network supply area. Unexpected large loads may appear requiring supply. Existing large consumers may significantly reduce load. There could be major unforeseen equipment failure requiring significant repair or replacement expenditure. More detailed asset management planning undertaken over the next few years may generate development and maintenance requirements which significantly differ from those currently provided for. The assumptions made in relation to these sources of uncertainty are listed in 9.1 above and detailed in the various sections of this plan. The potential effect of these sources of uncertainty on the prospective information in this plan is as follows: Source of Uncertainty Potential Effect of Uncertainty Potential Impact of Uncertainty Regulatory It is unlikely that any of the Requirements will Low Requirements reduce, thus the most likely impact is an increase in forecast expenditure to meet possible increased standards. It is not possible to quantify this possible impact. Ownership Different owners could have different service Medium and expenditure objectives than those embodied in the AMP, resulting in either higher or lower service targets and associated expenditures. Customer Demands Customers could change their demands for service and willingness to pay resulting in either higher or lower service targets and associated expenditures. Medium Natural Disaster Equipment failure and major repairs and replacements required which are not currently provided for Low, Medium High depending on severity Network Tasman Asset Management Plan Page 118
119 Demand Growth Load Profile New Large Loads Load Reductions Equipment Failure Further Detailed Planning Higher or lower demands require greater or lesser capacity across the system as currently projected. The most likely implication is that the existing expenditure forecast is either accelerated or delayed. The magnitude of this potential shift is unlikely to be more than 5 years either way. Seasonal shifts in demand could require planned capacity upgrades to be accelerated or delayed. The magnitude of this potential shift is unlikely to be more than 5 years either way. Large new loads will impact on demand growth. The implications of uncertainty for demand growth are noted above. Specific new investments may also be required to meet large new loads. Reduction in load from large customers generally provides additional capacity for the remainder of the network. Thus existing expenditure projections may be deferred. Equipment failure and major repairs and replacements which are not currently provided for. Development and maintenance requirements differ from those currently predicted for the later five years of the planning period, particularly for the 22kV, 11kV and 400V networks. Low Low Low Low Low due to business continuity planning. Low (applies mainly to years 6-10 of the plan). Network Tasman Asset Management Plan Page 119
120 LIST OF APPENDICES A B C D E F G H I J Network Layout Growth Projection Performance Statistics Capital Expenditure Projection Asset Renewals and Network Development List of Specific Development Projects and Asset Renewal Projects Network Maintenance Expenditure Projection Typical Asset Renewal and Maintenance Activities Design Network Voltage Regulation Zone Substation Risk Assessment and Relative Risk Chart Feeder Reliability Analysis K Customer Engagement 2018 L M N Disaster Readiness and Response Plan Procedure for Recording Outage Information for Regulatory Disclosure Commerce Commission Information Disclosure Template Reports Network Tasman Asset Management Plan Page 120
121 APPENDIX A A. NETWORK LAYOUT Geographic layout - Network Tasman network Geographic layout Stoke Region Geographic layout Motueka Region Geographic layout Golden Bay Region Geographic layout Kikiwa Region Geographic layout Murchison Region 33kV Network Schematic Stoke Region 66kV Network Schematic Network Tasman Asset Management Plan Page 121

122 Network Tasman Asset Management Plan Page 122


123 Network Tasman Asset Management Plan Page 123

124 Network Tasman Asset Management Plan Page 124

125 Network Tasman Asset Management Plan Page 125

126 Network Tasman Asset Management Plan Page 126
127 Network Tasman Asset Management Plan Page 127
128 Network Tasman Asset Management Plan Page 128
129 APPENDIX B B. GROWTH PROJECTION Projections include effects of embedded Generation and Load Management. Projections exclude on supply to Nelson Electricity Ltd. BULK SUPPLY REGION DEMAND PROJECTION (MW) Year Stoke (Stoke GXP) Stoke (Brightwater GXP) Motueka (Motueka Zone Sub) Motueka (Riwaka Zone Sub) Golden Bay Kikiwa Murchison Total Peak ZONE SUBSTATION DEMAND PROJECTIONS (MW) NB Projections include effects of embedded Generation and Load Management STOKE SUPPLY AREA ZONE SUBSTATIONS Year Wakapuaka Founders Annesbrook Songer St Hope Richmond Mapua LQS Eves Valley Brightwater OTAL Peak Network Tasman Asset Management Plan Page 129
130 GOLDEN BAY SUPPLY AREA ZONE SUBSTATIONS Year Upper Takaka Takaka Swamp Rd TOTAL Peak Network Tasman Asset Management Plan Page 130
131 APPENDIX C C. NETWORK PERFORMANCE STATISTICS Network Tasman Asset Management Plan Page 131
132 APPENDIX D D. CAPITAL EXPENDITURE PROJECTION NETWORK DEVELOPMENT & ASSET RENEWAL CAPITAL EXPENDITURE PROJECTION BY ASSET CATEGORY 2019/ / / / / / / / / /29 11kV/22kV Networks $3,170,000 $4,480,000 $7,380,000 $4,550,000 $6,180,000 $6,100,000 $3,500,000 $3,500,000 $2,500,000 $2,500,000 33/66kV Networks $5,150,000 $100,000 $100,000 $4,600,000 $4,600,000 $1,650,000 $1,950,000 $100,000 $100,000 $100, V Networks $240,000 $240,000 $240,000 $240,000 $240,000 $240,000 $240,000 $240,000 $240,000 $240,000 Comms Networks $110,000 $0 $0 $0 $0 $0 $0 $0 $0 $0 Dist Transformers $2,283,260 $2,283,260 $1,833,260 $1,833,260 $1,833,260 $1,833,260 $1,833,260 $1,833,260 $1,833,260 $1,833,260 Generators $460,000 $0 $0 $0 $0 $0 $0 $0 $0 $0 Land Purchases $0 $0 $0 $0 $0 $0 $0 $0 $0 $0 PF Correction $0 $800,000 $0 $0 $500,000 $0 $0 $0 $0 $0 Ripple Plants $0 $0 $0 $0 $450,000 $0 $350,000 $0 $0 $0 SCADA $55,000 $90,000 $0 $0 $0 $0 $0 $0 $0 $0 Substations $2,050,000 $4,400,000 $7,000,000 $500,000 $120,000 $200,000 $4,920,000 $3,700,000 $1,100,000 $0 Switchgear $718,000 $698,000 $373,000 $373,000 $373,000 $373,000 $373,000 $373,000 $373,000 $373,000 Underground Conversion $750,000 $500,000 $500,000 $500,000 $500,000 $500,000 $500,000 $500,000 $500,000 $500,000 TOTAL $14,986,260 $13,591,260 $17,426,260 $12,596,260 $14,796,260 $10,896,260 $13,666,260 $10,246,260 $6,646,260 $5,546,260 BY EXPENDITURE CLASS 2019/ / / / / / / / / /29 System Growth $5,213,000 $5,933,000 $9,643,000 $7,363,000 $9,943,000 $5,963,000 $8,413,000 $5,313,000 $1,713,000 $813,000 Reliability $4,980,000 $1,875,000 $850,000 $1,000,000 $820,000 $700,000 $700,000 $700,000 $700,000 $700,000 Customer Connection $640,260 $640,260 $640,260 $640,260 $640,260 $640,260 $640,260 $640,260 $640,260 $640,260 Relocation $750,000 $500,000 $500,000 $500,000 $500,000 $500,000 $500,000 $500,000 $500,000 $500,000 Renewal $3,403,000 $4,643,000 $5,793,000 $3,093,000 $2,893,000 $3,093,000 $3,413,000 $3,093,000 $3,093,000 $2,893,000 TOTAL $14,986,260 $13,591,260 $17,426,260 $12,596,260 $14,796,260 $10,896,260 $13,666,260 $10,246,260 $6,646,260 $5,546,260 All figures are 2019 dollars. Projected figures are not inflation adjusted. 1 Network Tasman Asset Management Plan Page 132
133 APPENDIX E E. SPECIFIC NETWORK DEVELOPMENT & ASSET RENEWAL PROJECTS Network Enhancement Project Estimated Year Cost Region Expenditure Class 1MVA Generator Replacement 2020 $460, Stoke Reliability 33kV Appleby Straight Bypass Cable 2020 $2,800, Stoke Reliability 33kV cable circuit upgrade Songer St - 600A 2020 $250, Stoke System Growth 33kV Cable Extension Wakapuaka Sub to Glenn turnoff 2020 $2,000, Stoke System Growth Andelect Replacement Merton Pl $10, Stoke Renewal Annesbrook Express Feeder CB and Cable 2020 $600, Stoke System Growth Network Padlocks Upgrade Stage $175, Stoke Reliability New Recloser Appleby Travellers Rest 2020 $20, Stoke Reliability New Recloser at Buller Gorge 2020 $20, Murchison Reliability New Recloser Brooklyn Valley 2020 $20, Motueka Reliability New Recloser Livingston Road 2020 $20, Stoke Reliability New Recloser Longford 2020 $20, Murchison Reliability New Recloser Rockville-Parapara 2020 $20, Golden Bay Reliability New Recloser Ruby Bay 2020 $20, Stoke Reliability New Recloser Shaggery 2020 $20, Motueka Reliability New Zone Substation at Wakapuaka 2020 $1,500, Stoke System Growth Radio Link Takaka Hill to Takaka Substation and Motupipi 2020 $60, Golden Bay Reliability Refurbish 2 x 66/11kV Transformers ex Motueka 2020 $500, Motueka Renewal RTU Takaka Substation 2020 $20, Golden Bay Reliability SCADA Fibre Connection Merton Place 2020 $50, Stoke System Growth SCADA System Resilience Project 2020 $35, Stoke Reliability Transformer Bunding Eves Valley Substation 2020 $20, Stoke Reliability Transformer Bunding Songer St Substation 2020 $30, Stoke Reliability Underground Conversion Ellis St Brightwater 2020 $750, Stoke Relocation Capacitor Bank Motupipi 33kV 5 x 2MVAr 2021 $800, Golden Bay System Growth Feeder Interconnection Switch Croucher St 2021 $60, Stoke Reliability Install 33kV CB's Swamp Road Substation 2021 $400, Golden Bay Reliability Maruia Feeder 11/22kV conversion - Stage $150, Murchison System Growth Motupipi Substation Upgrade Stage $1,600, Golden Bay Renewal Network Padlocks Upgrade Stage $175, Motueka Reliability New 11kV Feeder Cable Hope Substation to Swamp Road 2021 $1,700, Stoke System Growth New Switchboard and New 11kV Feeders Motueka Stage $2,400, Motueka System Growth Replace 11kV Switchboard Relays Motueka Substation 2021 $150, Motueka Renewal RTU Motueka Substation 2021 $60, Motueka Reliability RTU Upper Takaka Substation 2021 $30, Golden Bay Reliability Network Tasman Asset Management Plan Page 133
134 Ruby Bay Feeder Cable 0.5km 2021 $70, Stoke System Growth Underground Conversion Beach Road Tahuna 2021 $0.00 Stoke Relocation Interconnection Cable Tasman Heights to Marsden Valley 2022 $150, Stoke Reliability Longford Feeder reconductor to Ferret 15km 2022 $350, Murchison System Growth Marahau Estuary Cable Replacement 2022 $800, Motueka Renewal Maruia Feeder 11/22kV conversion - Stage $400, Murchison System Growth Motupipi Substation Upgrade Stage $1,600, Golden Bay Renewal Mount Murchison Lower Cable Replacement 2.2km 2022 $500, Murchison Renewal New Switchboard and New 11kV Feeders Motueka Stage $2,400, Motueka System Growth Rockville Feeder 22kV Conversion Stage $1,560, Golden Bay System Growth Underground Conversion Nayland Road 2022 $0.00 Stoke Relocation Underground Conversion Songer St (Nayland to Seaview) 2022 $0.00 Stoke Relocation Upgrade Conductor Higgins Rd 7/080 to Mink 2022 $300, Stoke System Growth Upgrade Conductor Swamp Rd to ABS $500, Golden Bay System Growth Upgrade Hope Substation to 23MVA firm 2022 $3,000, Stoke System Growth Voltage Support Dovedale Feeder 2022 $200, Motueka System Growth Wakapuaka to Hira Store Conductor Upgrades 2022 $120, Stoke System Growth Brightwater GXP 33kV Feeder Cables Stage $4,500, Stoke System Growth Maruia Feeder 11/22kV conversion - Stage $400, Murchison System Growth Protection Relay Upgrades for Arc Flash Detection - Annesbrook 2023 $50, Stoke Reliability Protection Relay Upgrades for Arc Flash Detection - Brightwater 2023 $30, Stoke Reliability Protection Relay Upgrades for Arc Flash Detection - Founders 2023 $30, Stoke Reliability Protection Relay Upgrades for Arc Flash Detection - Lower Queen St 2023 $60, Stoke Reliability Protection Relay Upgrades for Arc Flash Detection - Mapua 2023 $30, Stoke Reliability Protection Relay Upgrades for Arc Flash Detection - Richmond 2023 $50, Stoke Reliability Protection Relay Upgrades for Arc Flash Detection - Songer St 2023 $50, Stoke Reliability Refurbish T1 Transformer Brightwater 2023 $200, Stoke Renewal Rockville Feeder 22kV Conversion Stage $1,650, Golden Bay System Growth Underground Conversion Main Road Riwaka ain Road Riwaka 2023 $0.00 Motueka Relocation Brightwater GXP 33kV Feeder Cables Stage $4,500, Stoke System Growth Brightwater GXP Ripple Injection Plant 2024 $450, Stoke System Growth Capacitor Bank Motueka 2024 $500, Motueka System Growth Korere Feeder 22kV Conversion Stage $1,650, Kikiwa System Growth Longford Feeder 22kV conversion Stage 1 - Mangles 2024 $1,630, Murchison System Growth Maruia Feeder 11/22kV conversion - Stage $400, Murchison System Growth Transformer Differential Protection Relays - Annesbrook, Songer St, Richmond 2024 $120, Stoke Reliability Underground Conversion Aranui Road Mapua 2024 $0.00 Stoke Relocation Collingwood 33kV Feeder Reconductor to Ferret 2025 $700, Golden Bay System Growth Korere Feeder 22kV Conversion Stage $2,000, Kikiwa System Growth Network Tasman Asset Management Plan Page 134
135 Longford Feeder 22kV conversion Stage $1,600, Murchison System Growth Refurbish T1 Transformer Founders 2025 $200, Stoke Renewal Underground Conversion Bolt Road 2025 $0.00 Stoke Relocation Underground Conversion Wakefield Northern Entrance 2025 $0.00 Stoke Relocation Upgrade Conductor Hope 33kV to Brightwater Mink to Weta 7.2km 2025 $850, Stoke System Growth 33kV Cable Extension Neale Ave to Annesbrook Substation 600A 1.1km 2026 $600, Stoke System Growth 66kV Cables Riwaka 2026 $1,000, Motueka System Growth 66kV Zone Substation at Riwaka 2026 $4,500, Motueka System Growth New Ripple Injection Plant Riwaka 2026 $350, Motueka System Growth Pakawau Feeder 22kV conversion Stage $1,000, Golden Bay System Growth Reconductor Marsden Rd 33kV Double Circuit Mink to Single Circuit Cockroach 2026 $100, Stoke Renewal Refurbish T2 Transformer Songer St 2026 $250, Stoke Renewal Replace 33kV Circuit Breakers Songer St Substation 2026 $170, Stoke Renewal Underground Conversion Main Road Stoke (Champion to Saxtons) 2026 $0.00 Stoke Relocation Upgrade Conductor Railway Reserve 33kV Neale Ave to Annesbrook Cockroach 1.1km 2026 $150, Stoke System Growth Pakawau Feeder 22kV conversion Stage $1,000, Golden Bay System Growth Refurbish T2 Transformer Brightwater 2027 $200, Stoke Renewal Underground Conversion Waimea Road (Annesbrook Roundabout to Beatsons Roundabout) 2027 $0.00 Stoke Relocation Upgrade Annesbrook Substation to 34MVA firm 2027 $3,500, Stoke System Growth Refurbish T2 Transformer Founders 2028 $200, Stoke Renewal Upgrade Swamp Road Substation transformers to 2 x 5MVA 2028 $900, Golden Bay System Growth 33kV Cable Extension to Wakefield 2030 $4,500, Stoke System Growth New Zone Substation at Wakefield 2030 $4,000, Stoke System Growth Replace 33kV Circuit Breakers Annesbrook Substation 2030 $170, Stoke Renewal Age based replacement transformers Mapua Substation 2033 $800, Stoke Renewal Network Tasman Asset Management Plan Page 135
136 APPENDIX F F. NETWORK MAINTENANCE AND OPERATIONS EXPENDITURE PROJECTION MAINTENANCE AND OPERATIONS EXPENDITURE All figures 2019 Dollars. Projected figures not inflation adjusted OPERATIONS 2019/ / / / / / / / / /29 Management Fee 508, , , , , , , , , ,102 Training 49,780 50,278 50,781 51,288 51,801 52,319 52,842 53,371 53,905 54,444 Contractor H&S Auditing 60,000 60,600 61,206 61,818 62,436 63,061 63,691 64,328 64,971 65,621 Emergency Stock Management 40,000 40,400 40,804 41,212 41,624 42,040 42,461 42,885 43,314 43,747 System operations and network support 658, , , , , , , , , ,914 Tree Cutting 358, , , , , , , , , ,108 Line Corridors 259, , , , , , , , , ,079 Tree Regulations Removals 351, , , , , , , , , ,408 Fall Distance Tree Removal 179, , , , , , , , , ,426 Vegetation Management 1,149,345 1,160,838 1,172,447 1,184,171 1,196,013 1,207,973 1,220,053 1,232,253 1,244,576 1,257,022 TOTAL OPERATIONS EXPENDITURE 1,807,591 1,825,667 1,843,924 1,862,363 1,880,986 1,899,796 1,918,794 1,937,982 1,957,362 1,976,936 MAINTENANCE 2019/ / / / / / / / / /29 Faults Services - Network 878, , , , , , , , , ,967 Faults Services - Vegetation 50,000 50,500 51,005 51,515 52,030 52,551 53,076 53,607 54,143 54,684 Fault Recoveries (75,000) (75,750) (76,508) (77,273) (78,045) (78,826) (79,614) (80,410) (81,214) (82,026) Portable Generator Costs 15,000 15,150 15,302 15,455 15,609 15,765 15,923 16,082 16,243 16,405 Voltage Support 200, , , , , , , , , ,737 Service Level Payments 3,000 3,030 3,060 3,091 3,122 3,153 3,185 3,216 3,249 3,281 Emergency Maintenance 130, , , , , , , , , ,179 Service interruptions and emergencies 1,201,650 1,213,667 1,225,803 1,238,061 1,250,442 1,262,946 1,275,576 1,288,331 1,301,215 1,314,227 Substation Transformers 58,000 58,580 59,166 59,757 60,355 60,959 61,568 62,184 62,806 63,434 Substation switchgear and fuses 52,000 52,520 53,045 53,576 54,111 54,653 55,199 55,751 56,309 56,872 Substation Buildings & Switchyards 198, , , , , , , , , ,550 Substation SCADA 10,000 10,100 10,201 10,303 10,406 10,510 10,615 10,721 10,829 10,937 SCADA Master Station 2,000 2,020 2,040 2,061 2,081 2,102 2,123 2,144 2,166 2,187 Substation Batteries 21,000 21,210 21,422 21,636 21,853 22,071 22,292 22,515 22,740 22,967 Service Boxes 18,000 18,180 18,362 18,545 18,731 18,918 19,107 19,298 19,491 19,686 Connection Policy Alterations 32,000 32,320 32,643 32,970 33,299 33,632 33,969 34,308 34,651 34,998 O/H Conductor 33kV & 66kV 7,000 7,070 7,141 7,212 7,284 7,357 7,431 7,505 7,580 7,656 U/G Cables 33kV 2,000 2,020 2,040 2,061 2,081 2,102 2,123 2,144 2,166 2,187 Distribution Transformers 210, , , , , , , , , ,674 O/H Conductor 11kV & 22kV 9,000 9,090 9,181 9,273 9,365 9,459 9,554 9,649 9,746 9,843 O/H Conductor 400v 18,000 18,180 18,362 18,545 18,731 18,918 19,107 19,298 19,491 19,686 U/G Cables 11kV & 22kV 34,000 34,340 34,683 35,030 35,381 35,734 36,092 36,453 36,817 37,185 U/G Cables 400v 6,000 6,060 6,121 6,182 6,244 6,306 6,369 6,433 6,497 6,562 Field Switchgear & fuses 47,000 47,470 47,945 48,424 48,908 49,397 49,891 50,390 50,894 51,403 Field regulators 84,000 84,840 85,688 86,545 87,411 88,285 89,168 90,059 90,960 91,870 Field ABS Isolators 32,000 32,320 32,643 32,970 33,299 33,632 33,969 34,308 34,651 34,998 Network Tasman Asset Management Plan Page 136
137 LCP Transmitters 13,000 13,130 13,261 13,394 13,528 13,663 13,800 13,938 14,077 14,218 Communications Networks 17,000 17,170 17,342 17,515 17,690 17,867 18,046 18,226 18,409 18,593 SCADA aand Ripple Plant Backup 18,000 18,180 18,362 18,545 18,731 18,918 19,107 19,298 19,491 19,686 Operations General 126, , , , , , , , , ,804 Line Surveys 113, , , , , , , , , ,586 AR, Reg, Line MDI Reads 57,000 57,570 58,146 58,727 59,314 59,908 60,507 61,112 61,723 62,340 Sub VRR Settings 22,000 22,220 22,442 22,667 22,893 23,122 23,353 23,587 23,823 24,061 Dist Trans MDI Reads & Checks 62,000 62,620 63,246 63,879 64,517 65,163 65,814 66,472 67,137 67,808 Traffic Management Costs 192, , , , , , , , , ,988 Access Tracks 288, , , , , , , , , ,288 Audits 41,000 41,410 41,824 42,242 42,665 43,091 43,522 43,958 44,397 44,841 Audit Recoveries (29,000) (29,290) (29,583) (29,879) (30,178) (30,479) (30,784) (31,092) (31,403) (31,717) Routine and corrective maintenance 1,760,280 1,777,883 1,795,662 1,813,618 1,831,754 1,850,072 1,868,573 1,887,258 1,906,131 1,925,192 All Poles 1,197,000 1,208,970 1,221,060 1,233,270 1,245,603 1,258,059 1,270,640 1,283,346 1,296,179 1,309,141 Distribution Subs 187, , , , , , , , , ,519 Connection Assets 150, , , , , , , , , ,053 Transfomer Changeouts 28,000 28,280 28,563 28,848 29,137 29,428 29,723 30,020 30,320 30,623 Refurbishment & Renewals Maintenance 1,562,000 1,577,620 1,593,396 1,609,330 1,625,423 1,641,678 1,658,094 1,674,675 1,691,422 1,708,336 TOTAL ASSET MAINTENANCE & RENEWALS 4,523,930 4,569,169 4,614,861 4,661,010 4,707,620 4,754,696 4,802,243 4,850,265 4,898,768 4,947,756 TOTAL OPERATIONS AND MAINTENANCE 6,331,521 6,394,836 6,458,785 6,523,372 6,588,606 6,654,492 6,721,037 6,788,247 6,856,130 6,924,691 Network Tasman Asset Management Plan Page 137
138 APPENDIX G G. TYPICAL ASSET MAINTENANCE AND RENEWALS ACTIVITIES REFURBISHMENT/RENEWALS: Poles Line Hardware Conductor Service Boxes 0Underground Cables Distribution Transformers Pole mounted Switchgear Ground mounted switchgear ROUTINE/PREVENTATIVE MAINTENANCE: Pole Structures Line Hardware Conductor 33kV Cables 33kV Distribution Subs Distribution Transformers Conductor 11kV Cables 11kV Conductor 400V Cables 400V Service Boxes Field ABS Isolators Field Switchgear & Line Fuses Field Regulators Connection Assets Access Track Maintenance Tree Cutting Subs Transformers Subs - Switchgear + fuses Subs Buildings Subs SCADA Subs Batteries Load Control Plant Transmitters SCADA Master Station Communications Networks Public Lighting Network Meters FAULTS/EMERGENCY REPAIRS: Pole replacements and complete pole structure replacements Hardware Replacements (inc crossarms) Conductor Replacements Complete service box replacement Complete cable replacement End of life transformer replacements, winding replacement Pole mounted CB replacements Ground mount switch unit replacements Pole Patching, Strengthening pole footings. Tightening hardware. Rebinding, restraining, conductor repairs Cable testing, reterminating Cleaning, testing, hardware tightening, replacing fuses, earthing maintenance Cleaning, tightening connections, oil maintenance, painting, testing Rebinding, restraining, conductor repairs Cable testing, reterminating Rebinding, Restraining, Conductor repairs Cable testing, reterminating Resecuring Lids, Digging Out, Cleaning, fuseboard replacement, relabelling ABS adjustment, connector tightening, AR maintenance and testing. replacing fuse links. Testing, cleaning, painting, oil treatment Fuse link replacement Track clearing, stabilisation, water table maintenance Surveys, Tree clearing Cleaning, painting, pesting, tightening connections, oil treatment Contact adjustment, connection tightening, testing, oil treatment Painting, cleaning, yard spraying Testing, cleaning Testing, cleaning Cleaning, testing, Greasing bearings, Tuning Testing, cleaning, calibration Testing, line hardware tightening, Tuning, RT repairs Cleaning and adjusting fitting, tightening hardware Testing, Cleaning, Calibration Fuse replacements from overloads Fuse replacements from lightning surges Vehicle damage repairs Conductor repairs from bird strikes Storm damage repairs All damage repairs required to restore normal network serviceability. Network Tasman Asset Management Plan Page 138
139 APPENDIX H H. DESIGN NETWORK VOLTAGE REGULATION DESIGN % VOLTAGE DROP ALLOCATIONS - LDC SUBSTATIONS HOPE, FOUNDERS, LOWER QUEEN ST AND MOTUEKA SUSTATIONS Close to Zone Sub Urban Semi Rural Rural Normal Tap Normal Tap 2.5% Tap 5% Tap HV Min Load Volts HV Full Load Volts Distribution T/F Nominal Boost Distribution T/F Fixed Tapping Boost Distribution T/F Full Load Drop LV Distribution Line Min Load Drop LV Distribution Line Full Load Drop HV Swing Total Swing (Max 9.5) Full Load NCP Volts (Min -3.25) Min Load NCP Volts (max 5.25) Centre NCP Volts NOTES 1. Zone Sub LDC assumed set to give 4.0% boost at Full load Zone Sub aiming no load voltage set at 98% Volts 2. Design NCP receive voltage 230V +5%/-3%. (allows 2% max voltage drop in service cable thereby meeting +/- 5% at switchboard) % additional swing allowed for diversity between volt drop maximums DESIGN % VOLTAGE DROP ALLOCATIONS - NON LDC SUBSTATIONS EVES VALLEY, BRIGHTWATER, TAKAKA, SWAMP ROAD, KIKIWA, MURCHISON, ANNESBROOK, SONGER ST Close to Zone Sub Urban Semi Rural Rural Normal Tap Normal Tap 2.5% Tap 5% Tap HV Min Load Volts HV Full Load Volts Distribution T/F Nominal Boost Distribution T/F Fixed Tapping Boost Distribution T/F Full Load Drop LV Distribution Line Min Load Drop LV Distribution Line Full Load Drop HV Swing Total Swing (Max 9.5) Full Load NCP Volts (Min -3.25) Min Load NCP Volts (max 5.25) Centre NCP Volts NOTES 1. Zone Sub has no Line Drop Compensation Zone Sub aiming no load voltage set at 100% Volts 2. Design NCP receive voltage 230V +5%/-3%. (allows 2% max voltage drop in service cable thereby meeting +/- 5% at switchboard) % additional swing allowed for diversity between volt drop maximums Network Tasman Asset Management Plan Page 139
140 APPENDIX I I. ZONE SUBSTATION RISK ASSESSMENT MATRICES Zone Substation Risk Assessment Matrices Motupipi Substation Takaka Substation Brightwater Substation Hope Substation Songer St Substation Annesbrook Substation Lower Queen St Substation Founders Substation Eves Valley Substation Swamp Road Substation Mapua Substation Richmond Substation Network Tasman Asset Management Plan Page 140

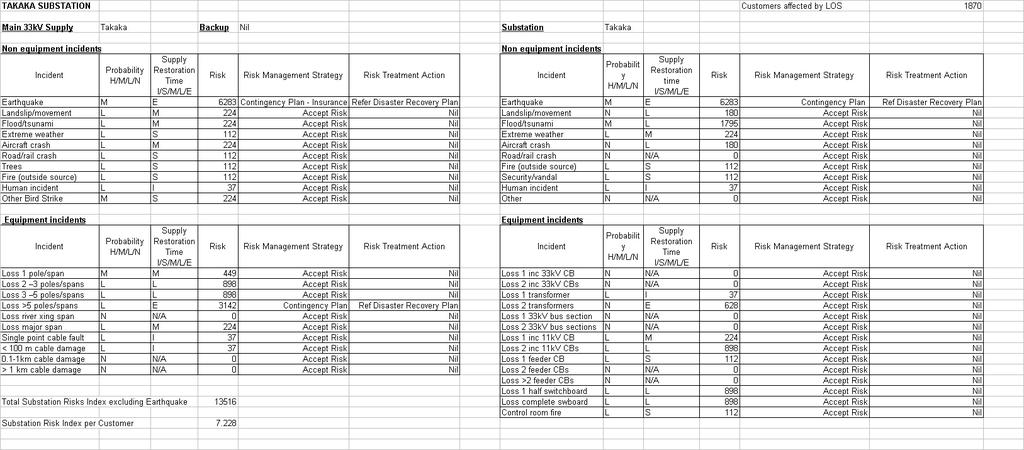
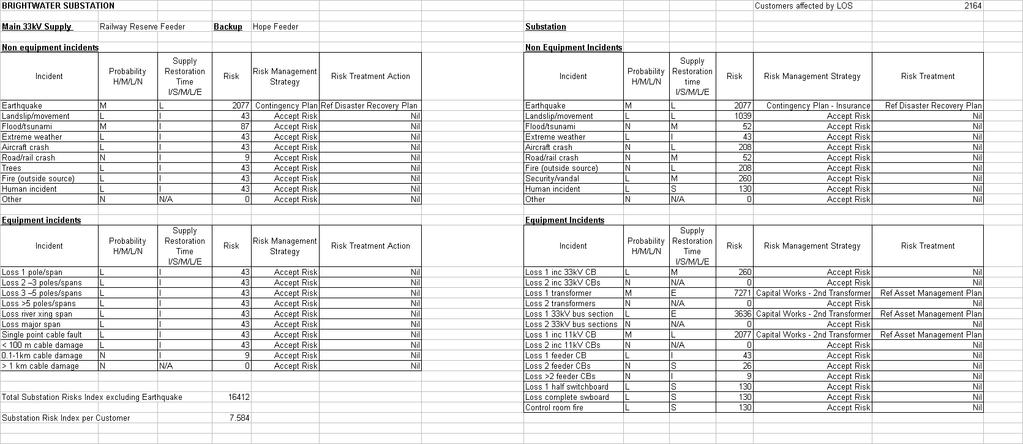
141 Network Tasman Asset Management Plan Page 141

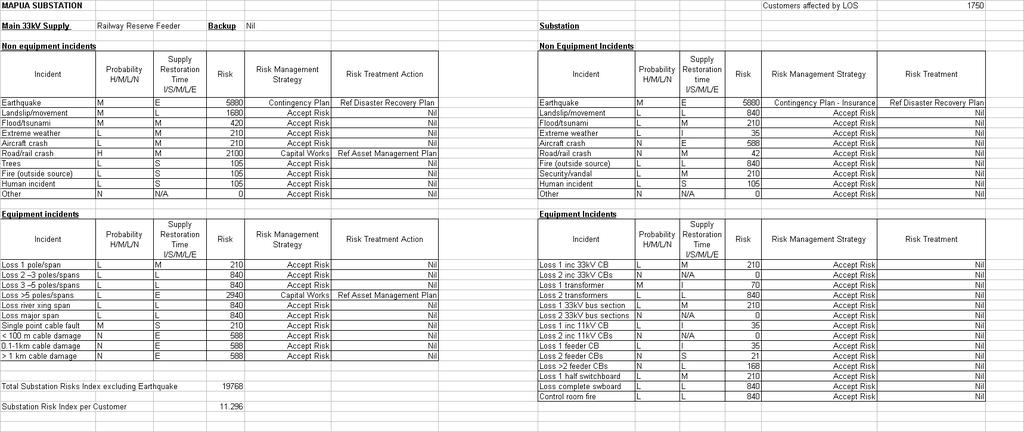
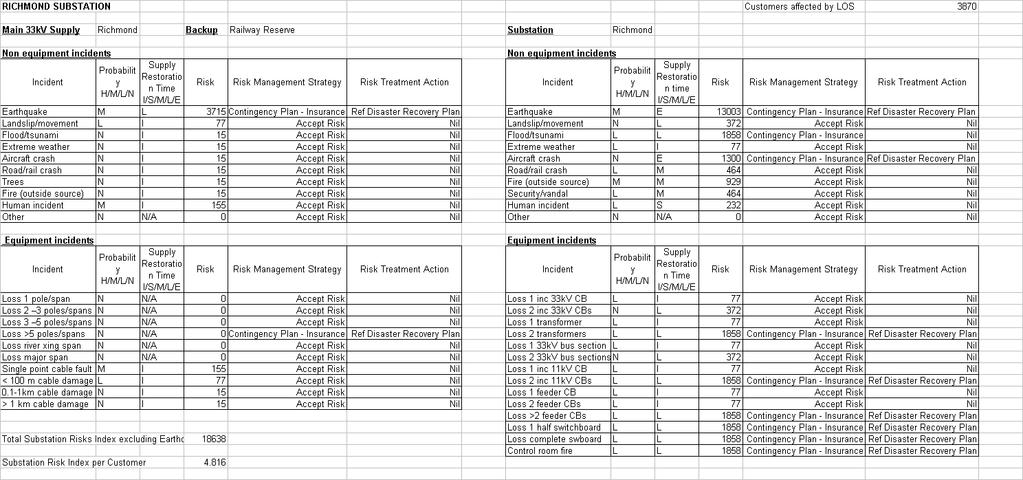
142 Network Tasman Asset Management Plan Page 142

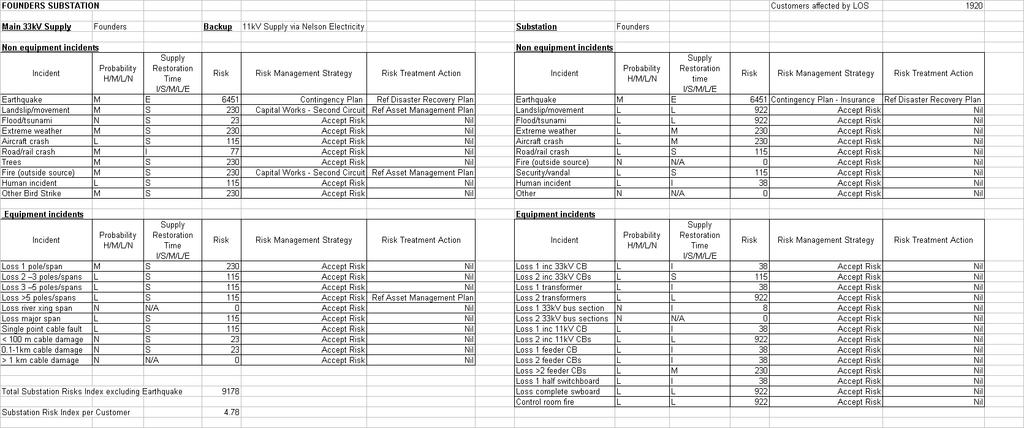
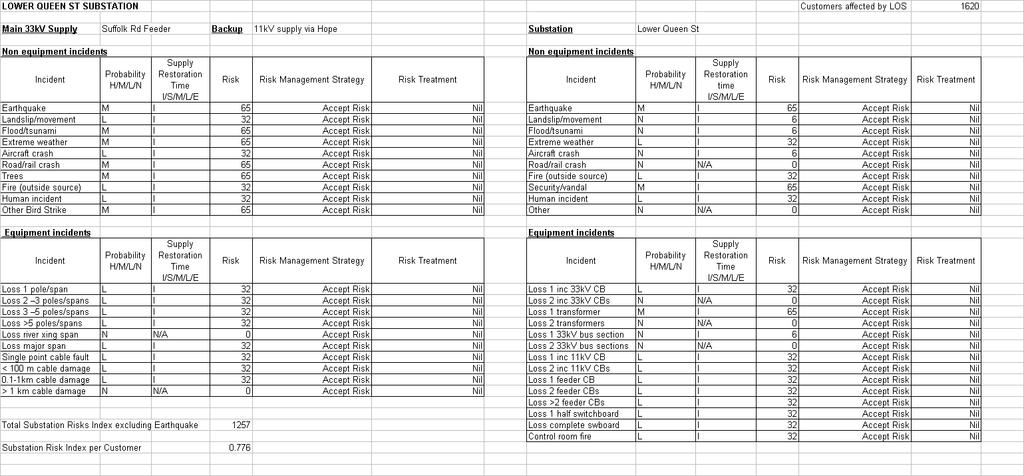
143 Network Tasman Asset Management Plan Page 143

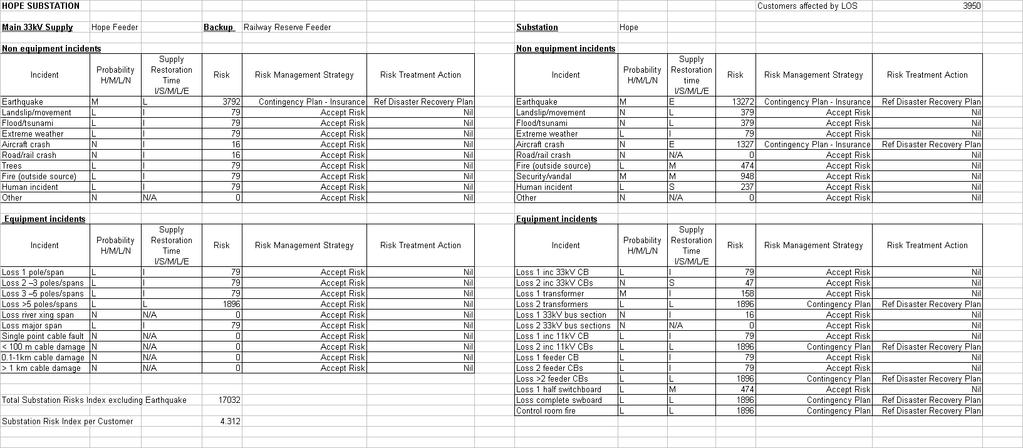
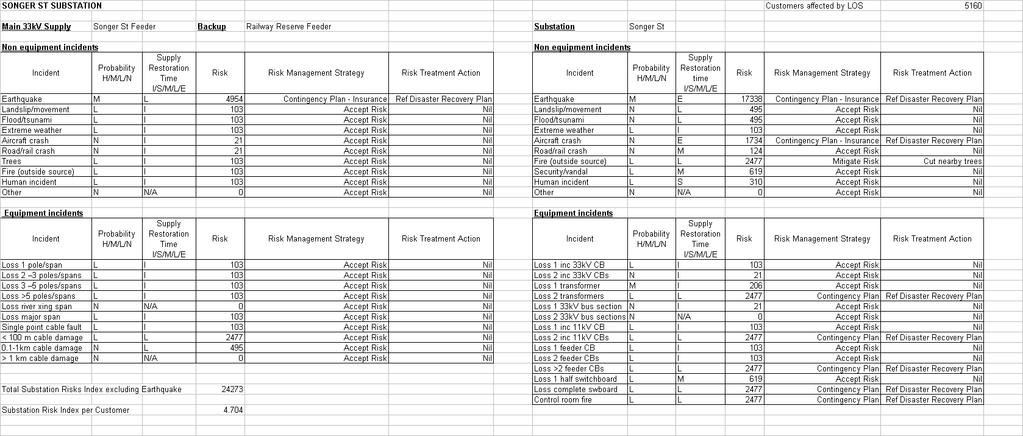
144 Network Tasman Asset Management Plan Page 144
145 NetworkTasman - Relative Network Component Risks (excluding earthquake induced events) Risk of Supply Loss Hope Sub Annesbrook Sub Songer St Sub Founders Sub Lower Queen St Sub Eves Valley Sub Brightwater Sub Takaka Sub Swamp Rd Sub Motupipi Sub Mapua Sub Richmond Network Tasman Asset Management Plan Page 145
146 APPENDIX J J. FEEDER RELIABILITY ANALYSIS Network Tasman Asset Management Plan Page 146
147 APPENDIX K K. CONSUMER SURVEY 2018 Network Tasman Asset Management Plan Page 147


148 Network Tasman Limited SIL Research NOVEMBER 2018 CUSTOMER SURVEY Contact: Dr Virgil Troy or Research is undertaken to the highest possible standards and in accord with the principles detailed in the RANZ Code of Practice which is based on the ESOMAR Code of Conduct for Market Research. All research processes, methodologies, technologies and intellectual properties pertaining to our services are copyright and remain the property of SIL Research. SIL Research Network Tasman CUSTOMER 2018 CUSTOMER SURVEY SURVEY 1
149 Electricity Lines Business Research Toolbox Research Tools for AMP Resource Planning, price quality Threshold Compliance, stakeholder consultation, branding AND STAFF CLIMATE Research SIL Research prides itself on providing timely, cost-effective and relevant research targeted on the specific needs of Electricity Lines Businesses. This research was conducted to consultatively engage with Network Tasman s customers to determine levels of satisfaction and perceptions of Network Tasman s services and deliverables. A survey of n=400 Residential and Commercial Mass Market customers was undertaken in September-October 2018 via CATI data collection. Using Network Tasman s ICP database statistics, a randomly selected sample of 400 surveys across unique, tenanted ICPs, allows for survey results to be reported on with a 95% confidence level of +/- 4-5%. Network Tasman 2018 CUSTOMER SURVEY 2
150 About SIL Established in 2000, SIL Research is a Napier based, full-service research company. We offer both quantitative and qualitative research throughout New Zealand. Our primary focus is the delivery of intelligent business research to assist organisations in making informed strategic, tactical and dayto-day decisions. SIL began working with Electricity Lines Businesses in the early 2000 s and to date has undertaken an extensive range of research projects in this sector. SIL Research is a member of the Research Association of New Zealand (RANZ). Research is undertaken to the highest possible standards and in accord with the principles detailed in the RANZ Code of Practice which is based on the ESOMAR Code of Conduct for Market Research. Disclaimer This report was prepared by SIL Research for Network Tasman Limited. The views presented in the report do not necessarily represent the views of SIL Research or Network Tasman Limited. The information in this report is accurate to the best of the knowledge and belief of SIL Research. Benchmarking SIL Research conducts a representative National survey of Electricity Lines Businesses to establish a series of benchmarks across a range of services. This allows Network Tasman to compare their survey results against a National average. Benchmarking results are reported at 95% confidence level +/- 4-5%. *Excludes Auckland, Wellington, Christchurch and Dunedin While SIL Research has exercised all reasonable skill and care in the preparation of information in this report, SIL Research accepts no liability in contract, tort, or otherwise for any loss, damage, injury or expense, whether direct, indirect, or consequential, arising out of the provision of information in this report. Network Tasman 2018 CUSTOMER SURVEY 3
151 Methodology Background Network Tasman Limited (NTL) owns and operates the electricity distribution network in the wider Nelson and Tasman areas, excluding Nelson Electricity s supply area in Nelson city. The Network Tasman electricity distribution network distributes power to approximately 37,500 consumer connections in an area of 10,800 sq km in the north-western corner of the South Island. SIL Research was asked to address a variety of brand, communications and a standard series of lines industry related questions. Questionnaire: SIL Research together with NTL developed a best practice questionnaire including questions from surveys for comparison. The questionnaire went through several iterations before a final version was tested and agreed to for use. A new set of questions was introduced in 2018: What words would you use to describe Network Tasman Limited? Questions about NTL s communications and safety messages. Project specific factors: SIL Research was provided with the NTL ICP database. Residents were weighted by area and customer segment across NTL s Network region. Customers from 12 NTL/SIL pre-determined areas were randomly selected from the NTL ICP database: Brightwater, Motueka, Takaka, Wakefield, Upper Moutere, Richmond, Murchison, Mapua, St Arnaud & Motupiko, Tapawera, Nelson and Maruia. To introduce a statistically robust sampling methodology, SIL Research ran an analysis on the NTL customer database and determined an appropriate sampling approach. Data collection: 400 NTL customers from across the network were interviewed via a CATI (Computer Assisted Telephone Interviewing) approach in September-October Data analysis: A total of n=400 responses were used in the final analysis. Data was analysed using a variety of statistical tests. Additional statistical variance control tests between demographic groups (segment, age, rural vs. urban, living situation) were also used. Where any differences were identified, they have been mentioned in the findings. Additional data comparison between survey years ( ) was performed were applicable. Percentages may not add up to 100% due to rounding. Additional notes: The data was tested using multiple analyses using various sampling and weighting approaches, there were little to no changes between the unweighted results and supplementary analyses with the exception of Emerging Technologies and some open-ended comments. As a result, Emerging Technologies and open-ended questions (source of fault information, brand perceptions and communication methods) findings are presented weighted by age to reflect district age group proportions as determined by Statistics New Zealand 2013 Census. A sample of n=400 across unique, tenanted ICP s allows for a confidence level +/- 4-5%. Network Tasman 2018 CUSTOMER SURVEY 4

152 Key findings Core questions Overall, 96% of customers were satisfied with Network Tasman performance in 2018, providing ratings 7 and above on a scale from 1 to 10 (average score 8.52). The two most important service deliverables in 2018 were Continuity and Price. The level of importance for Continuity and Communication increased in In 2018, the highest satisfaction was recorded for one of the most important service deliverables (Continuity). The level of satisfaction with Price, Quality, Communication and Accessibility in 2018 improved significantly compared to 2016 results. Three service deliverables showed performance exceeding perceived importance (Quality, Communication and Restoration). The largest underperformance gap in 2018 was recorded for Price. Power quality 92% of customers in 2018 believed their power reliability had stayed the same in the past 12 months. One-quarter of customers in 2018 could not recall any power cuts in the last 12 months. Satisfaction with the number of power cuts experienced was high (4.04 out of 5). Overall, 73% of customers stated any increase in price would be too much to pay for improved power quality. Communications In 2018, 73% of customers could recall any communications or messages on behalf of Network Tasman in relation to safety. Overall, more than two-thirds of customers (68%) believed the current level of safety communications from Network Tasman was about right now. Letter to your home address was the most effective way of communicating this information. One-third of all customers could recall recent communications from Network Tasman. Customers who mentioned seeing or hearing any recent communications from Network Tasman most recalled the Refund & Discount message (41%). Overall, 82% of customers who recalled seeing or hearing any recent communications stated it gave them a positive impression of Network Tasman. Overall brand perceptions In 2018, all customers were asked what words they would use to describe Network Tasman. The results showed an overall positive brand perception ( Good/ No problem followed by Efficient/ Reliable/ Good service ). About half of customers (49%) were not sure who owned Network Tasman; 26% of customers stated it was consumer owned. 59% of customers believed they would still receive their dividend and discount if they changed retailers. 40% of customers preferred Phone as a source of fault information. In 2018, just under one-third of customers (31%) could recall Network Tasman as the fault organisation, and 56% of surveyed customers correctly identified Network Tasman as their lines company. Note: The recent proliferation of electricity retailers has in many regions resulted in a lowering of lines company brand recall. Also, reliable networks typically have more satisfied customers but a resulting lower awareness of who keeps the lights on. Emerging Technologies When asked about investment in Emerging Technologies, over all customers, under one-infive were likely to invest in Solar panels, Electric Vehicles or House Batteries. Cost was the main concern against the investment in all three Emerging Technologies. Network Tasman 2018 CUSTOMER SURVEY 5
153 Benchmark Satisfaction at a glance Price Quality Continuity NTL 2018: 7.45 / 10 NTL 2018: 8.86 / 10 NTL 2018: 8.97 / 10 NTL 2016: 7.08 / 10 NTL 2016: 8.40 / 10 NTL 2016: 8.97 / 10 NZB 2018: 5.43 / 10 NZB 2018: 7.66 / 10 NZB 2018: 7.73 / 10 Restoration Accessibility Communication NTL 2018: 8.49 / 10 NTL 2018: 8.34 / 10 NTL 2018: 7.77 / 10 NTL 2016: 8.47 / 10 NTL 2016: 7.93 / 10 NTL 2016: 6.97 / 10 NZB 2018: 7.31 / 10 NZB 2018: 6.79 / 10 NZB 2018: 6.56 / 10 Overall performance NTL 2018: 8.52 / 10 NTL 2016: 8.45 / 10 NZB 2018: 7.27 / 10 NZB = New Zealand Benchmark Network Tasman 2018 CUSTOMER SURVEY 6
154 Brand survey Outage contact organisation All respondents were asked In the event of a power cut, what organisation would you get in touch with for fault information? 100% 90% 80% 70% 60% 50% Outage contact organisation % 30% 20% 10% 0% 31% Network Tasman 25% 19% 12% 7% Other Don't know Contact Trustpower Genesis Energy 2% 2% 1% 1% 1% Meridian Energy Business 2018 Residential 2018 Total 2018 Mercury Energy Just Energy Pulse Energy In 2018, just under one-third of customers (31%) could recall Network Tasman as the fault organisation. This recall level was slightly higher compared to results. The level of recall was similar between residential (31%) and commercial (35%) customers. In 2018, the percentage of Don t know responses increased. Although there were no statistically significant differences within customer demographic groups, rural customers (34%) were more likely than urban customers (28%) to consider contacting Network Tasman. Outage contact organisation ( , aggregated) 100% 90% 80% 70% 60% 50% 40% 30% 20% 10% 31% 31% 12% 19% 7% 0% Network Tasman Other Contact Energy Dont Know Trustpower Network Tasman 2018 CUSTOMER SURVEY 7
155 Name of Lines company All respondents were asked What's the name of the company that owns and runs the region's electricity power lines? 100% 90% 80% Name of Lines Company % 60% 56% 50% 40% 30% 20% 10% 0% 28% 7% 5% 4% 1% Network Tasman Don't know Trustpower Contact Other Meridian Energy Business 2018 Residential 2018 Total % of surveyed customers correctly identified Network Tasman as their lines company. Identification of Network Tasman as the lines company was significantly lower amongst residential customers in 2018 compared to 2016 (56% in 2018 against 68% in 2016). The decrease in awareness in 2018 corresponded with the increase in Don t know responses; 28% of customers couldn t name their lines company in Both rural and urban customers awareness was similar in 2018 (54% for urban customers and 58% for rural customers). Name of Lines Company ( , aggregated) 100% 90% 80% 70% 60% 56% 50% 40% 30% 28% 20% 10% 0% 5% 5% 7% Network Tasman Dont Know Contact Energy Other Trustpower Network Tasman 2018 CUSTOMER SURVEY 8
156 Network Tasman ownership awareness Respondents indicating awareness of Network Tasman (either prompted or unprompted) were asked Who owns Network Tasman Limited? 100% 90% 80% 70% Network Tasman ownership awareness 60% 50% 40% 30% 20% 10% 0% 49% 26% 15% 5% 4% 1% Don't know Trust Consumer owned Other Council Private ownership Business 2018 Residential 2018 Total 2018 About half of customers (49%) stated they didn t know who owned Network Tasman, which was higher than 2016 (39%). 26% of customers stated it was consumer owned (Note: new option in 2018), whereas only 15% of customers selected Trust (down from 47% in 2016). In 2018, the overall ownership awareness was similar between residential and commercial customers, however more urban customers stated Don t know (54%). Network Tasman ownership awareness ( ) 100% 90% 80% 70% 60% 50% 40% 30% 20% 10% 0% 49% 26% 15% 5% 4% 1% Don't know Trust Consumer owned Other Council Private ownership Network Tasman 2018 CUSTOMER SURVEY 9
157 Rebates and discounts All respondents were asked If you switched electricity retailers do you think you would still receive the dividend and discount? 100% 90% 80% 70% 60% 50% 40% Perceived impact of retailer on rebate and discount % 20% 57% 59% 59% 10% 0% Business 2018 Residential 2018 Total 2018 Yes Don't know/ Not sure No Other 59% of customers believed they would still receive their dividend and discount if they changed retailers. This result was similar between survey years. Perceived impact of retailer on rebate and discount ( ) 100% 90% 80% 70% 60% 50% 40% 30% 20% 54% 59% 59% 10% 0% Yes Don't know/ Not sure No Other Network Tasman 2018 CUSTOMER SURVEY 10
158 Preferred source of fault information All respondents were asked How would you prefer to source fault information? Note: results were weighted. 1% Facebook Radio An app on the phone 4% 6% 6% Don't know/ Just wait 13% Website Other 18% 19% Phone 40% 0% 5% 10% 15% 20% 25% 30% 35% 40% 45% 50% Total 2018 Business 2018 Residential % of customers preferred Phone as a source of fault information. Although the preferred method to source fault information varied by year, the nature of responses could change as well. Of the 19% of Other responses in 2018, 38% referred to Mobile, cell phone, online without additional specialisation. Of of 40% of respondents who stated Phone, the majority did not specify landline or mobile/smart phone. Source of fault information by year 1% 2% Facebook Radio An app on the phone 4% 6% 6% 19% 16% 39% Don't know/ Just wait 0% 13% Website 18% 46% Other 4% 19% Phone 15% 40% 0% 5% 10% 15% 20% 25% 30% 35% 40% 45% 50% Totals may exceed 100% owing to multiple responses for each respondent Network Tasman 2018 CUSTOMER SURVEY 11
159 Brand perceptions *NEW in All respondents were asked What words would you use to describe Network Tasman Limited? (openended comments aggregated into categories). Note: results were weighted. Expensive Wholesaler Local/ Community focused 0% 1% 1% Keep informed/ Prompt response/ Good to deal with No answer Power supplier/ Power company/ Maintain lines Other Generous/ Give discount 5% 6% 7% 8% 10% Efficient/ Reliable/ Good service Don't know/ Nothing 17% 20% Good/ No problem 32% 0% 5% 10% 15% 20% 25% 30% 35% 40% 45% 50% In 2018, all customers were asked what words they would use to describe Network Tasman. The results showed an overall positive brand perception. 32% of customers described Network Tasman as Good/ No problem followed by Efficient/ Reliable/ Good service, at 17%. While one-in-five (20%) couldn t provide a specific answer ( Don t know/ Nothing ), very few provided a negative response. Totals may exceed 100% owing to multiple responses for each respondent Network Tasman 2018 CUSTOMER SURVEY 12
160 Core survey Service deliverable importance All respondents were asked On a scale of 1 to 10 (where 1 is totally unimportant and 10 is very important) how important are the following electricity performance areas? (Price) Keeping costs down (Continuity) Keeping the power on (Quality) Keeping flickering or dimming lights to a minimum (Communication) Keeping you informed of Network Tasman works, sponsorships, business (Restoration) Reducing Length of time power is off (Accessibility) easy to contact if need arises Business 2018 Residential 2018 Total 2018 The two most important service deliverables in 2018 were Continuity ( Keeping the power on, 9.32 out of 10) and Price ( Keeping costs down, 9.17 out of 10). The overall rank order of performance areas was generally consistent year-onyear, however with statistical significance, the level of importance for Continuity and Communication increased in Urban customers placed significantly higher importance on all six service deliverables, compared to rural customers (Price) Keeping costs down (Continuity) Keeping the power on (Quality) Keeping flickering or dimming lights to a minimum (Communication) Keeping you informed of Network Tasman works, sponsorships, business (Restoration) Reducing Length of time power is off (Accessibility) easy to contact if need arises Scale: 1=totally unimportant and 10=very important. Don t know excluded from the analysis Network Tasman 2018 CUSTOMER SURVEY 13
161 Service deliverable performance All respondents were asked On a scale of 1 to 10 (where 1 is poorest and 10 is highest) how would you rate your electricity lines company s performance in the following areas? (Price) Keeping costs down (Continuity) Keeping the power on (Quality) Keeping flickering or dimming lights to a minimum (Communication) Keeping you informed of Network Tasman works, sponsorships, business Business 2018 Residential 2018 Total (Restoration) Reducing Length of time power is off (Accessibility) easy to contact if need arises In 2018, the highest satisfaction (8.97) was recorded for one of the most important service deliverables (Continuity). The level of satisfaction with Price, Quality, Communication and Accessibility in 2018 improved significantly compared to 2016 results. With statistical significance, younger customers aged were less satisfied with Price, whereas customers aged were the least satisfied with Continuity, Communication and Restoration. Rural customers were significantly less satisfied with Continuity, Quality and Restoration (Price) Keeping costs down 8.97 (Continuity) Keeping the power on (Quality) Keeping flickering or dimming lights to a minimum (Communication) Keeping you informed of Network Tasman works, sponsorships, business (Restoration) Reducing Length of time power is off (Accessibility) easy to contact if need arises Scale: 1=very poor and 10=very good. Don t know excluded from the analysis Network Tasman 2018 CUSTOMER SURVEY 14
162 Importance vs. Performance Drawing on the data presented in the previous two charts (performance and importance ratings) this chart presents a perceptual map by combining average ratings across the two dimensions 10 9 (Restoration) Reducing Length of time power is off (Quality) Keeping flickering or dimming lights to a minimum 8 7 (Communication) Keeping you informed of Network Tasman works, sponsorships, business (Accessibility) easy to contact if need arises Performance (Price) Keeping costs down (Continuity) Keeping the power on Importance All average performance ratings were within quadrant 4 indicating good performance compared to high importance levels. Three service deliverables showed performance exceeding perceived importance (Quality, Communication and Restoration. The largest underperformance gap in 2018 was recorded for Price. Network Tasman 2018 CUSTOMER SURVEY 15
163 Overall performance satisfaction All respondents were asked Taking into account all of the areas of performance (price, continuity, quality, communication, restoration and accessibility) how would you rate Network Tasman s overall performance? 10 Overall Network Tasman performance Business 2018 Residential 2018 Urban Rural Overall, 96% of customers were satisfied with Network Tasman performance in 2018, providing ratings 7 and above on a scale from 1 to 10 (average score 8.52). The overall satisfaction with Network Tasman performance was slightly higher in 2018 compared to 2016 (91%, average score 8.45) % % 0% 10% 20% 30% 40% 50% 60% 70% 80% 90% 100% Scale: 1=very poor and 10=very good. Don t know excluded from the analysis Network Tasman 2018 CUSTOMER SURVEY 16

164 Factors influencing overall performance ratings Regression analysis provides a statistical test to predict which of Network Tasman s service deliverables exert the greatest influence on overall performance. 100% 100% 100% % 74% % (Price) Keeping costs down (Accessibility) easy to (Quality) Keeping (Continuity) contact if need arisesflickering or dimming Keeping the power lights to a minimum on (Restoration) Reducing Length of time power is off (Communication) Keeping you informed of Network Tasman works, sponsorships, business Gap between importance and performance Strength of influence Across all customers, three of the six attributes were found to have a statistically significant association with customer s overall performance satisfaction (Price, Accessibility and Quality). With differences in scores between importance and performance, one service deliverable represented the greatest improvement potential: o Price Keeping costs down. Improvements in other areas (particularly Accessibility and Quality) will have a positive impact on overall satisfaction, but also to a lesser extent than changes in Price. Network Tasman 2018 CUSTOMER SURVEY 17
165 Power quality Perceptions of better vs. worse supply All respondents were asked Thinking about the quality of your power supply, over the past 12 months do you feel your power supply has improved or declined? Total % Residential % Business % 0% 10% 20% 30% 40% 50% 60% 70% 80% 90% 100% Got much worse Got worse Stayed the same Improved Improved significantly Don't Know 92% of customers in 2018 believed their power reliability had stayed the same in the past 12 months (against 79% in 2016). Very few felt (1%) it got worse. Power quality results were similar between customer segments and demographic groups. Although fewer customers in 2018 stated their power had improved, there were no Don t know responses and fewer indications of power getting worse % % 0% 10% 20% 30% 40% 50% 60% 70% 80% 90% 100% Got much worse Got worse Stayed the same Improved Improved significantly Don't Know Network Tasman 2018 CUSTOMER SURVEY 18
166 Outage frequency All respondents were asked Thinking now about the last 12 months, how many power cuts can you recall? and In your opinion, how satisfied were you with the number of outages you experienced? 100% 90% 80% 70% 60% 50% 40% 65% 62% 62% 5 4 In your opinion how satisfied were you with the number of power cuts you experienced last year % 20% 10% 0% 24% 25% 25% Business 2018 Residential 2018 Total Zero power cuts 1-3 power cuts 4-8 power cuts 9 or more power cuts Don't know 1 Business Residential One-quarter (25%) of customers in 2018 could not recall any power cuts in the last 12 months (down from 34% in 2016). In 2018, more urban customers recalled no any power cuts (35%) compared to rural customers (13%). Despite the increase in power cut recall in 2018, satisfaction with the number of power cuts experienced was high (4.04 out of 5) and similar to 2016 results (4.01). 100% 90% 80% 70% 60% 50% 40% 51% 62% 5 4 In your opinion how satisfied were you with the number of power cuts you experienced last year % 3 20% 34% 10% 25% 2 0% Zero power cuts 1-3 power cuts 4-8 power cuts 9 or more power cuts Don't know Scale: 1=very dissatisfied and 5=very satisfied. Don t know excluded from the analysis Network Tasman 2018 CUSTOMER SURVEY 19
167 Outages duration All respondents were asked Thinking your last outage, how long were you without power? and With regards to the most recent power cut, in your opinion how satisfied were you with the amount of time it took to restore power? 100% 90% 80% 70% 12% 17% 17% 38% 29% 30% In your opinion how satisfied were you with the amount of time it took to restore power? 60% 5 50% 40% 15% 27% 26% % 12% 20% 10% 0% 15% 15% 19% 11% 12% Business 2018 Residential 2018 Total Less than a minute Between 1 to 30 minutes 30 minutes to 1hr 1-3hrs Over 3hrs Don't know [aggregated) 1 Business Residential On par with the power disruptions in 2018 the reported time it took to restore power also increased. 30% of customers stated it took over 3hrs to restore the power during the most recent power cut (against 14% in 2016). At the same time the number of Don t know responses decreased in In 2018, customers were somewhat satisfied (3.97 out of 5) with the length of time it took to restore power (up from 3.87 in 2016). 100% 90% 80% 70% 60% 31% 14% 17% 30% 5 In your opinion how satisfied were you with the amount of time it took to restore power? 50% 40% 26% 26% % 20% 10% 0% 11% 15% 16% 12% Less than a minute Between 1 to 30 minutes 30 minutes to 1hr 1 1-3hrs Over 3hrs Don't know [aggregated) Scale: 1=very dissatisfied and 5=very satisfied. Don t know excluded from the analysis Network Tasman 2018 CUSTOMER SURVEY 20
168 Willingness to pay for improved power quality All respondents were asked Your current line charges ensure the lights stay on most of the time with limited interruptions or power fluctuations. To improve your power quality even further what price would you be prepared to pay on top of your current charges? 100% 90% 80% 70% 60% 68% 73% 73% 66 % 50% 40% 30% 20% 10% 0% Business 2018 Residential 2018 Total 2018 Other An extra $25 /year An extra $50 / year An extra $100 / year An extra $200 / year An extra $300 / year Any increase would be too much Total 2016 Overall, 73% of customers stated any increase in price would be too much to pay for improved power quality. In 2018, willingness to pay extra on top of the current charges decreased slightly (66% in 2016); there were more customers satisfied with their power supply in There was no statistically significant difference in willingness to pay extra based on outage experience. 100% 90% 80% 70% 60% 50% 40% 30% 20% 10% 0% 77% 71% No outages or d/k Experienced an outage Other An extra $25 /year An extra $50 / year An extra $100 / year An extra $200 / year An extra $300 / year Any increase would be too much Network Tasman 2018 CUSTOMER SURVEY 21
169 Communication Safety messages awareness *NEW in All respondents were asked Are you aware of any communications or messages on behalf of your electricity lines company in relation to safety such as taking care around power lines, buried electricity cables and keeping trees away from powerlines? Total % Rural 80% Urban 67% Residential 73% Business 70% 0% 10% 20% 30% 40% 50% 60% 70% 80% 90% 100% Yes No In 2018, 73% of customers could recall any communications or messages on behalf of Network Tasman in relation to safety (such as taking care around power lines, buried electricity cables and keeping trees away from powerlines). With statistical significance, rural customers were more likely to recall Network Tasman s safety messages (80%). Network Tasman 2018 CUSTOMER SURVEY 22
170 Perceived level of safety communications *NEW in All respondents were asked How do you feel about the current level of these safety communications from your electricity lines company? Total % 15% Rural 76% 16% Urban 62% 15% Residential 68% 15% Business 73% 22% 0% 10% 20% 30% 40% 50% 60% 70% 80% 90% 100% There's far too much of it There's a little too much It's about right now A little more could be done A lot more could be done Don't know Overall, more than two-thirds of customers (68%) believed the current level of safety communications from Network Tasman was about right now. Around one-in-five customers (19%) felt that more could be done to communicate safety messages. Urban customers (who had lower awareness of safety messages) were less sure about the level of communications overall (17% Don t know ) and therefore less likely to feel it was about right now (62%). Network Tasman 2018 CUSTOMER SURVEY 23
171 Communication method *NEW in All respondents were asked What do you believe is the most effective way of Network Tasman communicating information to you? Note: results were weighted. Community meetings/workshops 0% Network Tasman internet site 1% Facebook 3% Local radio 3% Other 5% Phone 5% Text to your cell phone 7% Local newspapers 12% Flyer to your home address 22% 32% Letter to your home address 44% 0% 5% 10% 15% 20% 25% 30% 35% 40% 45% 50% When asked what would be the most effective way of communicating information, Letter to your home address was the first choice (44%). (32%) and Flyer to your home address (22%) were also common responses. Fewer customers considered traditional media most effective (12% Local newspapers, 3% Local radio ). Network Tasman 2018 CUSTOMER SURVEY 24
172 Most recent communication *NEW in All respondents were asked Have you seen or heard any recent communications or messages from Network Tasman? Total % Rural 36% Urban 30% Residential 33% Business 27% 0% 10% 20% 30% 40% 50% 60% 70% 80% 90% 100% One-third of all customers could recall any recent communications from Network Tasman. Yes No Customers who mentioned seeing or hearing any recent communications from Network Tasman most recalled the Refund & Discount message (41%). Communication recall Tree trimming 8% Board election 8% General maintainance 11% Outage notification 18% Other 18% Refund & Discount 41% 0% 5% 10% 15% 20% 25% 30% 35% 40% 45% 50% Totals may exceed 100% owing to multiple responses for each respondent Network Tasman 2018 CUSTOMER SURVEY 25
173 Impression of Network Tasman Respondents who mentioned seeing or hearing any recent communications or messages from Network Tasman were asked What impression of Network Tasman did it give you? Total % 23% Rural 63% 23% Urban 55% 22% Residential 57% 24% Business 80% 10% 0% 10% 20% 30% 40% 50% 60% 70% 80% 90% 100% A very negative impression A somewhat negative impression No impression either way A somewhat positive impression A very positive impression Overall, 82% of customers who recalled seeing or hearing any recent communications stated it gave them a positive impression of Network Tasman. There were no statistically significant differences between customer segments and demographic groups. Network Tasman 2018 CUSTOMER SURVEY 26
174 Emerging Technologies Solar panels All respondents were asked In the next 2 years, how likely is it that you will invest in Solar Electricity Panels? and Why did you give that rating? Note: results were weighted. Total % 13% 23% Total % 17% 17% Rural 67% 17% 16% Urban 64% 18% 18% Residential 64% 18% 18% Business 82% 6% 12% 0% 10% 20% 30% 40% 50% 60% 70% 80% 90% 100% Unlikely Neutral Likely When asked about investment in Solar panels, over all customers, 17% were likely to invest in Solar panels. 66% were unlikely to adopt this technology. The most common reason for lack of willingness to invest in Solar panels was Expensive/ Not cost efficient. 9% of customers stated they already had Solar panels. Reasons for rating Bad idea/ No benefits 0% Don't Know 1% No answer 2% Technical issues/ Have another source 2% Good idea/ Save costs 4% Other 7% Want to install 8% Don't want/ No benefits 9% Already have 9% I'm too old 9% Renting/ Will not Invest in the current house 17% Expensive/ Not cost efficient 39% 0% 5% 10% 15% 20% 25% 30% 35% 40% 45% 50% Totals may exceed 100% owing to multiple responses for each respondent Network Tasman 2018 CUSTOMER SURVEY 27
175 Electric Vehicles All respondents were asked In the next 2 years, how likely is it that you will invest in Electric Vehicles? and Why did you give that rating? Note: results were weighted. Total % 10% 11% Total % 6% 16% Rural 78% 8% 14% Urban 78% 5% 17% Residential 78% 7% 15% Business 76% 24% 0% 10% 20% 30% 40% 50% 60% 70% 80% 90% 100% Unlikely Neutral Likely 16% of customers would consider investing in an Electric Vehicle in the next 2 years. 2% stated they already had an Electric Vehicle. As with Solar panels, most customers in 2018 (78%) were unlikely to invest in Electric Vehicles. The most common reason for unwillingness to invest in Electric Vehicles was Too expensive. Reasons for rating Don't know 1% Petrol prices 2% Already have 2% Technology concern 3% Other 3% Not applicable 4% No answer 4% I'm too old 5% Want to purchase 10% Rural location/ No power outlets/ Distance 15% Unlikely to have/ Don't need/ Don't like 20% Too expensive 39% 0% 5% 10% 15% 20% 25% 30% 35% 40% 45% 50% Totals may exceed 100% owing to multiple responses for each respondent Network Tasman 2018 CUSTOMER SURVEY 28
176 House Batteries All respondents were asked In the next 2 years, how likely is it that you will invest in House Batteries? and Why did you give that rating? Note: results were weighted. Total % 14% 19% Total % 12% 17% Rural 68% 13% 19% Urban 72% 12% 16% Residential 69% 13% 18% Business 82% 3% 15% 0% 10% 20% 30% 40% 50% 60% 70% 80% 90% 100% Unlikely Neutral Likely 17% of customers were considering investing in House Batteries in the next 2 years. Again, most customers in 2018 (70%) were unlikely to invest in House Batteries. The most common reason for unwillingness to invest in House Batteries was Too expensive as well. Reasons for rating Already have 1% Not interested 1% Other 2% Technology concern 4% Don't know 5% No benefits/ Don't need 6% I'm too old 7% Renting/ Will not invest in the current house 8% No Solar panel 10% Want to purchase/ Good idea/ Will buy if go Solar 12% No answer 19% Too expensive 30% 0% 5% 10% 15% 20% 25% 30% 35% 40% 45% 50% Totals may exceed 100% owing to multiple responses for each respondent Network Tasman 2018 CUSTOMER SURVEY 29
177 Peak vs. Off-peak All respondents were asked How interested would you be in going to peak vs. off-peak plan where you pay more for usage during network peak periods such as morning and evening and less during off-peak periods? and How much would you need to save each month for this to be worth doing? Total % 32% 31% Rural 36% 32% 33% Urban 39% 32% 29% Residential 36% 33% 31% Business 56% 22% 22% 0% 10% 20% 30% 40% 50% 60% 70% 80% 90% 100% Disinterested Neutral Interested 31% of customers said they were interested in the peak vs. off-peak plan against 37% who were not interested in this plan. Commercial customers were less interested in the peak vs. off-peak plan (56% disinterested). 21% of all customers indicated they need to save $21-$50 each month for them to believe it was worth doing. 20% of all customers stated Don t need/ Not viable/ Won t change/ Low user. How much would need to save A lot $ >$100 $0-20 Other Any savings or a little 0-50% of the current bill Already on the plan No answer Don't know Don't need/ Not viable/ Won't change/ Low user $ % 1% 3% 3% 4% 5% 7% 8% 12% 16% 20% 21% 0% 5% 10% 15% 20% 25% 30% 35% 40% 45% 50% Totals may exceed 100% owing to multiple responses for each respondent Network Tasman 2018 CUSTOMER SURVEY 30
178 APPENDIX L L. DISASTER READINESS AND RESPONSE PLAN DISASTER READINESS AND RESPONSE PLAN DMS January 2018 Network Tasman Asset Management Plan Page 148
179 1. EXECUTIVE SUMMARY This plan outlines Network Tasman s disaster readiness and response strategy both for natural disasters and catastrophic events on either the NTL distribution network or the TransPower transmission network. A major earthquake with an epicentre near Nelson City is potentially the worst case natural disaster to plan for. A high probability exists that a major event will occur in the Nelson region within the next 50 years. Response plans provide for alternate control centre, communication, media, resources, and priorities. The worst case catastrophic event on the Network Tasman distribution network would be for the total loss of a zone substation from multiple transformer failures. The worst case catastrophic events on the TransPower transmission network are considered to be multiple transformer failures, and 220kV transmission tower failures. Either of these will have a major impact on supply availability to the Nelson region. Significant restrictions or total loss of supply for up to 3 days could result. Effective media communication and coordination with TransPower will be required. Network Tasman is required to have a Rolling Feeder Outage Plan for significant events on the grid or loss of national generation. This plan is posted on Network Tasman s website. Under a declared civil defence emergency significantly impacting on electricity supplies, or major catastrophic events to the distribution or transmission networks an emergency management team would be formed to coordinate Network Tasman s response and recovery. The appendices detail essential services, communication details, contractor resources, emergency stock, alternative equipment and material suppliers. Key elements in any disaster response plan will be to establish: Resource and manpower requirements if an extended loss of supply over several days is likely Effective media liaison Retailer communication Coordination of recovery activities. 2. INTRODUCTION 2.1 Network Tasman Network Tasman is an electricity distribution company that owns, manages, and operates the distribution network in the Nelson Region excluding that of Nelson Electricity. The network is made up of overhead lines and underground cables, substations, switches and connection assets that distribute electricity from four TransPower bulk supply points located at Stoke, Kikiwa and Murchison. The operational headquarters of Network Tasman is based in Richmond, and includes the management of all activities making up the operation and management of an electricity distribution network including maintenance, development and extensions for load growth and supply restoration after faults. 2.2 Purpose of Plan The purpose of this plan is to set out and document clearly established readiness and response plans relating to Network Tasman s distribution network to be implemented in the event of either natural disasters or catastrophic events related to the failure of the distribution network or the TransPower transmission network. Network Tasman Asset Management Plan Page 149
180 3. EMERGENCY EVENTS 3.1 Natural Disasters Expected natural disasters are outlined below. Event Likelihood Impact Comments Earthquake 87% probability of mm force 7 in next 50yrs, and 67% mm 8 in next 100yrs High Most serious natural disaster for Network Tasman to prepare and respond to. Liquefaction in Nelson Port and Airport likely Cyclone Medium Medium Would result in a large number of lines down Lightning Storm Medium Medium Would most likely affect a large number of rural transformers. Possible damage to zone substations Landslide Medium Low Likely to be localised Forest Fire Medium Low Could affect Nelson Nth 33kV feeder and other 11kV supplies Flooding High Low Relatively low impact on the electricity network- flooding may restrict restoration Other Less Likely Events Tornadoes Unlikely Medium Only relatively small tornadoes known to have occurred historically. A large tornado would cause major localised damage Eruptions Unlikely Low No active volcanoes but ash from eruption could impact on overhead lines and transmission lines to the Nelson region Meteorites Unlikely High To date none known to have fallen in the Nelson region. Tsunami Unlikely Medium Highest recorded in Nelson area 1.5m and would affect low lying areas 3.2 Network Tasman Distribution Network The following events are considered to be of a major and catastrophic nature: Event Likelihood Impact Comments Multiple Zone Transformer Failure Low High Refer to contingency plan Zone 33 or 11kV Bus Failure Low High Refer to contingency plan Multiple underground 33 or 11kV cable failures Low High Refer to contingency plan Zone substation fire Low High Refer to contingency plan Sabotage Low High Refer to contingency plan Major oil spill Low Medium Refer to contingency plan Network Tasman Asset Management Plan Page 150
181 3.3 Transpower Transmission Network The following events are considered to be of a major and catastrophic nature: Event Likelihood Impact Comments Multiple transformer failures at GXP s Low High Emergency Generation Likely rolling blackouts Liaison with Transpower NZ Possible Civil Emergency. 220kV tower failures Low High Emergency Generation Likely rolling blackouts Liaison with Transpower NZ Possible Civil Emergency Substation bus failure- Stoke, Kikiwa, and Islington Low High Emergency Generation Likely rolling blackouts Liaison with Transpower NZ Possible Civil Emergency 3.4 Generation The following events are considered to be of a major and catastrophic nature: Event Likelihood Impact Comments Low SI Generation Medium Medium Possible prolonged hot water cutting and rolling blackouts Maui Gas Failure Low High Maximum HVDC transfer likely may limit available capacity in South Island Total system collapse Low High Civil Emergency Network Tasman Asset Management Plan Page 151
182 4. CIVIL DEFENCE 4.1 Regional Plan The Nelson Tasman Emergency Plan details the priorities and responsibilities for emergency, welfare, and utility services in the event of a Civil Defence Emergencies. During a civil defence emergency, Network Tasman will carry out its restoration procedures in accordance with this plan and normal operating practices, with priority to essential services, unless instructed otherwise by Nelson Tasman Civil Defence. Regular updates on the status of electricity supplies in the emergency area and restoration planning are provided to civil defence through the civil defence liaison person. Where access to disaster areas is controlled by civil defence, and is required by Network Tasman for the purposes of supply restoration then access permission will be requested from civil defence. Civil Defence may at any time take control of Network Tasman s resources or order alteration to its restoration priorities. 4.2 National Plan The National Civil Defence Emergency Management Plan 2006 details the principles, priorities, and responsibilities of regional, and local Emergency Management plans as well as generators, transmission, and distribution companies. 4.3 Network Tasman Obligations and Participation Network Tasman is a Lifelines Utility with responsibilities under the Civil Defence Emergency Management Act (CDEM). These include: Functioning to the fullest possible extent during and after an emergency. Having plans for continuity. Participating in CDEM Planning Providing technical advice. 4.4 Essential Services Some services such as water, sewer and health care facilities are essential for public health and well-being. Services such as petrol stations and super markets also become essential in the days immediately following an event. Appendix 1 details essential services provided with line function services either directly or indirectly by Network Tasman. The extent of local or portable generation available for continuity of the service is detailed in Appendix 11. In addition to the essential services, there are consumers such as the port and airport, communication providers and radio stations that become critical to response and recovery efforts. Appendix 2 details critical customers provided with line function services either directly or indirectly by Network Tasman. The extent of local or portable generation available for continuity of the service is detailed in Appendix 11. Essential services will receive priority in restoration of service or alternatively the provision of standby generators (authorised by Civil Defence) in the event of either Civil defence warning Declared civil defence emergency Major or catastrophic events related to either the Network Tasman or TransPower networks Network Tasman Asset Management Plan Page 152
183 4.5 Liaison In the event of a declared Civil Defence Emergency or warning impacting on electricity supply, Network Tasman will provide a liaison officer at civil defence HQ. This person will act as the interface between Civil Defence and Network Tasman. Network Tasman Asset Management Plan Page 153
184 5. DISASTER MANAGEMENT AND CONTROL 5.1 Emergency Management Team For major events an Emergency Management Team will be formed with the prime objective of determining and establishing appropriate strategies, action plans and communication plans for response and recovery. Human resource required to carry out the action and communications plans may be drawn from available NTL staff members. Meetings are to be held as required and directed by the team leader with minutes of meetings distributed to team members on a timely basis. The Emergency Management Team will comprise: CEO (Team Leader) Network Manager Operations Manager An appointed Communications Officer Chairman TransPower representative (as appropriate) Retailer representatives (as appropriate) Civil Defence or/and Local Body representatives (as appropriate) Events for which the Emergency Management Team is to be formed include: a) Civil Defence warnings or declared emergencies likely to result in a major loss of electricity supplies in the Nelson region for an extended period; b) Major or catastrophic events on either the Network Tasman or TransPower network likely to result in loss of electricity supplies in the Nelson region for an extended period; c) Multiple generator failure likely to result in a loss of electricity supplies in the Nelson region for an extended period. 5.2 Control Operator The control operator controls fault restoration and electricity network disaster recovery operations in the field. Control operators are fully trained in the operation of electricity networks and familiar with the layout and configuration of the Network Tasman system. The control operator under all expected normal outage conditions controls supply restoration, and manages public safety under the direction of the Operations Manager or Network Manager. Communication with the media is the responsibility of the CEO or Operations Manager. Network Tasman maintains 24 hour availability of control operator staff who remain within 20 minutes of the control centre at all times. 5.3 Control Centre Electricity supply network operations are controlled from the control centre based at 52 Main Road Hope. This control centre is set up with sufficient communication and information resources to allow one or more system operators to diagnose and direct restoration procedures to field staff throughout the entire Network Tasman supply area. Alternate Control Centre options and issues are discussed in section 5.4. At the control centre the schematic representation of the high voltage distribution network in the area is represented by a system mimic diagram. This mimic is a paper based plan that is laid out on a cork tiled wall in Network Tasman Asset Management Plan Page 154
185 the control room. All lines switches and major substations are represented on this mimic diagram and the status of all field switches and connections are recorded on the mimic through the use of indicator pins. All switch operations in the field are matched by corresponding indicator pin movements on the system mimic board. In this way the up to date status of the power system is continuously maintained by the control operator. All field switch operations are also logged with timestamps in the control room operations log book. As the power system in the area is effectively made up of five separate networks, then the mimic is in five separate parts, one mimic for each network. The master for the system mimic is a CAD drawing file that is stored on the company s computer fileserver. As new lines are added to the system, the mimic is updated by ink markups. On an approximately six monthly basis these ink alterations are copied back into the CAD master file. Other copies of the mimic may be printed out as required as hardcopy backups to the control room mimic or as portable schematics. The control room 230V power is backed up by a 100kW diesel generator so that the control room may continue to operate on an indefinite basis in the event of major and protracted loss of electricity supply. The generator and UPS system are tested on a weekly basis. 5.4 Alternate Control Centre Control centre operations are set up so that they may continue to function following partial or even total loss of the existing control centre facilities. SCADA and PC network based systems operate as parallel information systems rather than essential series elements in the fault restoration operation. They are therefore not absolutely essential for ongoing fault restoration operations. They are important tools however and significantly aid efficient network control operations, particularly under widespread outage conditions. Wherever possible, SCADA services to should be made available to the control room. The absolute minimum resources required for the operation of the control room are: 1. One telephone or cellphone operating on the public switched telephone network. 2. One repeater based radio telephone base set. 3. One system mimic covering the bulk area to be managed, mounted on a wall. 4. One laptop or PC running GIS viewer software with a copy of current Network Tasman GIS data files. An alternate control centre containing the above items as a minimum, has been set up in a relocatable airconditioned portacom building. This building is kept at Network Tasman s yard at 24 Main Rd Hope. The mimic within this building is regularly updated. GIS software and data is held on at least two laptop PC s within the company that are generally held physically separate from the existing control centre. Access to the SCADA system in the alternate control centre is preferred and can be set up by using a laptop based SCADA client connected in to the SCADA system fibre communications loop switch at various sites. Possible alternate control centre locations with access to the SCADA fibre loop are as follows: Network Tasman Main Rd Hope yard. Nelson Electricity Haven Road Network Tasman Substations Annesbrook, Richmond or Songer St TransPower Stoke Refer Appendix 15 for Alternate Control Centre response plan. Network Tasman Asset Management Plan Page 155
186 6. COMMUNICATION 6.1 Radio Telephone Network Network Tasman operates an extensive network of VHF voice radio telephone channels that give two way half duplex voice coverage between the Richmond Control centre and mobile units moving around almost all points on the power supply network. There are four repeater sites in the region as listed below: Fringed Hill Nelson Mt Murchison Mt Campbell Mt Burnett Channel 1 - Half Duplex FM Channel 2 - Half Duplex FM Channel 3 - Half Duplex FM Channel 4 - Half Duplex FM In addition to the above the company operates a simplex radio telephone channel allowing communication between mobiles within close proximity. The repeater sites are operated and maintained under contract by Mt Campbell Communications Ltd. Contracted services include emergency repairs to the radio systems and regular performance monitoring. All repeaters have a minimum of 12 hours reserve battery capacity in the event of power supply failure to the sites. At the Richmond Control Centre a radio base station gives the operators simultaneous access to all radio telephone channels. By assigning the use of the radio channels to specific geographic areas and assigning control room operators the update rights of individual mimics, control room operations can be split to handle simultaneous faults in different supply areas if required. In addition to the fixed radio repeaters at the sites detailed above, there is a spare repeater unit and antennas that can be programmed with appropriate frequencies for the temporary erection of an alternative radio repeater on another hilltop should one of the fixed repeaters become out of service and inaccessible. Other equipment needed to erect an emergency repeater is a 12V car battery, a portable generator, battery charger and poles on which to mount antennas. This spare equipment is held by Mt Campbell Communications Ltd. 6.2 Telephone Fault calls are normally received by contract fault call centres, operated under contract to Network Tasman, and are switched in and out on a timetable basis to give a continuous availability. The call centre operations timetable is as follows: Business Weekdays 08:00 17:00 Delta Utility Services Richmond All other times Call Care - Blenheim Both call centres are equipped to handle many simultaneous incoming calls and although under normal conditions they operate with a minimum number of two operators, they have the capability to expand to eight operators as demand requires. The Call Centre operators are trained to receive fault calls recording sufficient details for the caller to be individually identified and located, and carry out a small amount of fault symptom diagnosis in order to pass on the fault details to the correct field personnel. The Call Centres have direct line telephone contact with the Richmond Control Room via an unlisted telephone line into the control room. All calls from the entire Network Tasman supply area are received by the call centres. A free phone number is advertised for all electricity related faults. The Chorus public switched telephone network is the sole carrier of all fault calls from customers to Network Tasman. The Call centres are both remote from the supply area and therefore the telephone network is heavily relied upon not only within the Nelson region but also for its links to these remote centres as well. Network Tasman Asset Management Plan Page 156
187 In the event of a major telephone network failure radio advertising would be used to notify customers of alternative arrangements for reporting faults depending on circumstances and communication systems available. 6.3 Cellphone A number of cellphones are available for use in the event that the telephone network is down and the cellphone system is still operational. 6.4 Satellite Telephone A satellite telephone is available for use in the event that the telephone network is down and the cellphone system is heavily loaded. This is located in the Hope control room. 6.5 Key Communication Numbers Key communication numbers are detailed in Appendix 3. Network Tasman Asset Management Plan Page 157
188 7. INFORMATION SYSTEMS 7.1 GIS Geographic Information on the electricity distribution system is at the main office IT centre with access to this from within the control room. The GIS system contains comprehensive and accurate information on the location and electrical parameters of all components of the network including all poles and points of connection to all customers. Being in computerised form, the information can be queried and searched on any basis including geographic area. The location and contact details of all individual customers are stored in the system also. This system runs on PC screen s throughout the company s main office and in the control room. The system is therefore a valuable information store and information processing resource for the system operator. The GIS system is updated on a daily basis and therefore represents the most current record held by the company. View only copies of the GIS system are maintained on the control operator s laptop and on other company laptops. 7.2 SCADA Network Tasman has a computer based SCADA system (supervisory control and data acquisition system). This system has a master station located at the Richmond Control centre and remote terminal units located at the company s major zone substations and ripple injection plants. Communication to the outstations is by fibre optic landline and VHF radio. The SCADA system provides remote monitoring of substation loads and remote control of substation switchgear and voltage regulators. Instantaneous access to conditions at various substations facilitates the safe and controlled transfer of load around the network without loss of supply or adverse affect on customers. The SCADA system records and time tags all automatic switch operations at substations and also outputs alarms to the system operator whenever abnormal conditions exist at a substation. Unauthorised entry to a substation can also be reported via the SCADA system. If the SCADA system were unavailable for any reason then the operator may carry out fault restoration procedures using the VHF radio telephone and the system mimic only. 7.3 Operating Manuals, Procedures, and Reference Manuals Copies of the instruction manuals for all types of automatic high voltage switchgear and voltage regulators that are used on the network are kept on file in the control room. Also sets of recent photographs of field plant and equipment are available in the control room for reference. Access to the settings of control and protection equipment is available through a spreadsheet file on the PC network - G:\ENGINEER\NETWORK PROTECTION\SETTINGS.XLS. The HV faults database may also be used for historical reference and is available via the PC network - G:\ENGINEER\ACCESS\ACCESS DATABASES\OUTAGES.MDB Network Tasman Asset Management Plan Page 158
189 8. RESOURCES 8.1 Network Tasman After ensuring for the security and safety of family, Network Tasman operations staff will be requested to report to the Control Centre following a declared natural disaster such as an earthquake. In the event that they cannot reach the Control Centre they are to report to the nearest civil defence sector and await transport to Network Tasman. Clear identification and authorisation will be required by all staff under a declared Civil Defence Emergency. Staff will be assigned tasks as required. 8.2 Delta Utilities Ltd Delta Utilities holds the contract for primary field response to all fault outages and can provide up to approximately 30 field staff. Contract services include: Provision of first and second level fault response staff on continuous basis Provision of fault vehicles to minimum Network Tasman specification All personnel performing fault response activities on the network are class approved for these functions by Network Tasman and are required to keep current safety training as per industry standards. All front line fault staff are trained to Network Tasman standards in the operation of all network equipment, and in the fault logging and reporting procedures. The faultmen are controlled by the Network Tasman Control Operator. Generally the contracted resources of Delta Utility Services Ltd could maintain a continuous emergency repair operation for up to 48 hours. Further repair work beyond this time could be carried on a 9-10 hour day basis only. If 24 hour operation was still required then labour resource and possibly materials resource would need to be brought in to the job from outside NTL and Delta Utility Services. Early assessment and appraisal of resource requirements is essential to prevent overload and to manage response 24 to 48 hours following an event. In the event of a major earthquake it is likely that only about 50% of available resources will be available. 8.3 Electronet Transmission Ltd 8.4 Other Approved Contractors There are a number of contractors in the greater Nelson area who have approvals to work on the distribution network. These contractors can be found in the AHC matrix in the company document management system (DMS) public folder AHC Matrix Detail. The largest alternative lines contractor is PowerTech Nelson. At the time of writing, Powertech has 12 approved staff that could be called upon in an emergency: 4 linesmen, 3 cable jointers, 3 electricians and 2 inspectors. 8.5 Lines Companies Mutual Aid Agreement Network Tasman has an operating agreement with other South Island lines companies to share resources during emergencies as and when available. Refer to DMS file Other Resources Network Tasman Asset Management Plan Page 159
190 Use of local non-power system electrical contractors may also be required for customer installation requirements (cost allocation issues) or for assistance with other recovery teams. Appendix 8 details local electrical contractors. In some instances the resources of civil contractors may be required to assist in the repair of pole foundations, cable trenching and in pole erection. Local civil contractors who may be able to respond are detailed in Appendix Emergency Stock A list of emergency material stocks such as poles, transformers, line hardware etc is specified by Network Tasman. This list not only specifies the items and stock levels of each required but it also specifies at which location these stocks are to be situated. This regional list takes into account the type of construction in each supply area, and also the possibility that road access to some areas could be blocked under certain crisis conditions. Stock levels are set around that level needed for a typical continuous restoration exercise lasting up to three days. This period being the expected maximum delay before stocks could be brought in to the area from sources outside the region. Given such a crisis it would be expected that external overload contracting resource would also be required. Spares for one off critical items in the network such as large distribution transformers, voltage regulators and ripple injection plant equipment are included in the list. The Network Emergency Stock list is included as Appendix 12. Additional equipment and materials may be obtained from suppliers as detailed in Appendix Vehicles Appendix 16 details the availability and location of vehicles. Network Tasman Asset Management Plan Page 160
191 9. PUBLIC AND MEDIA COMMUNICATION 9.1 Standard Procedure communication to the local radio stations under standard operating procedures is available to the control operator via the control centre PC. In the event of failure of the PC network, a fax machine with separate telephone connection is also located in the control room, together with copies of proforma media facsimile forms for manual transmission of faxes to the radio stations and newspaper. 9.2 Civil Defence and Catastrophic Network Events In the event of a declared civil defence emergency or a major catastrophic event on either the Network Tasman or TransPower network, media and public relations communication will be handled by the appointed Communications Officer under the Emergency Management Team. In the event of a failure of normal communication systems, media communication will be via radio telephone from the control centre to Civil Defence HQ either to the Network Tasman liaison officer or direct to the media at Civil Defence HQ. All media inquiries are to be routed to the Network Tasman Communications Officer under declared civil defence emergencies or major catastrophic events. Network Tasman Asset Management Plan Page 161
192 10. FINANCIAL 10.1 Implications Civil defence or major catastrophic events affecting the Network Tasman network are likely to have major financial implications. The Emergency Management Team is to document and assess the likely impact and notify the Chairman and directors as soon as possible of the implications Authority Limits Under Civil Defence or major catastrophic events prompt decision making will be essential. The following delegated authority limits will apply: Chairman & CEO $1,000,000 Deputy CEO $500,000 Network Manager $100,000 Operations Manager $50, Declared Civil Defence Emergencies It is unlikely that in the event of a declared civil defence emergency any funding will be available from central or local government directly for restoration of the distribution network. Refer to Section 26 of the National CDEM Plan Financial Records The Operations Manager is to ensure records of all contractual services or material requested from external organisations that have a financial implication are documented and recorded along with the estimated commitment. Network Tasman Asset Management Plan Page 162
193 11. RESPONSE PLAN- NATURAL DISASTERS 11.1 Event, Expected Effects, and Response Plan Event Expected Effects Response Plan Earthquake O/H lines down due to land movement/subsidence Pole mounted transformers down 1. Network Field Survey of 33kV Lines Cables Zone Substations11kV Feeders Distribution Transformers UG cable fracture due to land movement/subsidence 2. Forward planning of field manpower and materials resources Damaged pole mounted substations Zone Substation damage: 3. Forward planning of control room operator roster. 11kV Switchboards Transformer Bushings 4. Liaison with TransPower to ascertain Supply availability Feeder Cable fractures at building 5. Liaison with Civil Defence entry points Control Centre destroyed or damaged 6. Restoration to take into account critical customer priority Computer network unavailable TransPower transmission line failure 7. Possible relocation of Control Centre or setup second remote control room at alternate location substation failure 8. Repair priorities by Network Hierarchy. Cyclone Major Flood Snow Storm Trees over lines Lines blown over Pole mounted transformers down Drop Leads off OH Transformers Lateral movement of poles near parallel ditches/cuttings Zone Substation outdoor bus damage from flying debris Pole Flooding (see Flooding) Pole washouts particularly near rivers Padmounts and service box failure Particularly susceptible areas: Central Takaka Annesbrook Tahuna TransPower Stoke Sub Stoke Ripple Plant Possible limitation of Bulk Supply (TransPower 220kV lines affected) Damage to 11kV OH Feeders: Broken Poles Broken crossarms Broken Conductors Feeder tripping due to snow unloading 1. Consider holding off field work until storm abates. 2. Network Survey of affected OH lines by Helicopter 3. Forward planning of field manpower and materials resources 4. Forward planning of control room operator roster. 5. Liaison with TransPower to ascertain supply availability 6. Liaison with Civil Defence 7. Restoration to take into account Critical Customers 8. Restoration to take into account critical customer priority 9. Repair priorities by Network hierarchy 1. Network Survey by Helicopter - assess access as well as network damage. 2. Possible forward resource and manpower planning if damage widespread. 3. Possible switch off HV Feeders if padmounts flooded. 4. Liaison with Civil Defence 5. Repair priorities by Network Hierarchy. 1. Consider holding off field work until storm abates. 2. Network Survey of affected OH lines by Helicopter 3. Forward planning of field manpower and materials resources. 4. Forward planning of control room operator manning. Network Tasman Asset Management Plan Page 163
194 Lightning Storm Landslips Large Forest Fire Overhanging trees Susceptible Areas Murchison Kikiwa Takaka Hill Mt Campbell Zone Substation Damage 33kV Bus Insulators and Arresters Possible Zone Substation Transformer breakdown Large number of distribution sub fuses blown Some damaged distribution transformers 11kV cable terminations at overhead line connection points. Loss of 33kV OH supply to Founders and Nelson Electricity Loss of Bulk Supply Loss of Hope 33kV Circuit Damage to Stoke Substation 33kV Bus Damage to Stoke Ripple Plant. Loss of HV feeder lines through crossarm fire, pole damage, melted conductors, carbon contamination Loss of Distribution transformers Loss of Bulk supply through EHV transmission circuit damage Susceptible Areas: Brook St Maitai - 33kV to Founders Atawhai 11kV Feeders Dovedale Motueka Valley 11kV Feeders Richmond Hills 11kV Spur lines Mahana - 11kV Feeders Golden Downs - 11kV Feeders 5. Liaison with TransPower to ascertain supply availability 6. All Field Vehicles to be 4WD. 7. Special requirements for food and clothing of Field Staff. 8. Possible delayed restoration if storm ongoing. 1. Consider holding off field work until storm abates. 2. Centralise control in control room. 3. Possible split operation geographically. 3. Consider transfer of call reception to control room. 4. Forward planning of field manpower and materials resources. 5. Forward planning of control room operator manning. 6. Monitor stocks of Fuse links and distribution transformers. 1. Restoration of 33kV via alternative routes where available. 2. Emergency reconstruction of OH line possibly on new route. 3. Use helicopter for line survey on back hill country feeder routes. 1. Liaise with Civil Defence if necessary 2. Liaise with rural fire network during fire control operations. May require feeder shutdowns 3. Reinforce control of information releases and field staff comment. 4. Restoration may be delayed due to access constraints. 5. Possible restoration by constructing bypass line route. Network Tasman Asset Management Plan Page 164
195 12. RESPONSE PLAN - MAJOR OR MULTIPLE NETWORK FAILURE 12.1 Standard Procedure Standard Operating Fault Management The fault restoration management procedures and systems are designed to handle all expected faults from simple single contingency incidents to multiple simultaneous faults spread out over the entire network area. Basic procedures are followed in all incidents, but operations are split and resources added as demand requires. The control centre has the capability to operate to restore faults in three supply areas simultaneously. If further geographic splits are necessary or faults occur in all supply areas simultaneously then additional temporary control rooms (including the alternate control centre) can be setup. Under typical network fault procedures, if a fault affecting the HV network or a major section of LV network is encountered, then the rostered control operator is notified and he immediately makes his way to the control centre. Once in the control centre the control operator takes full charge of the fault identification, isolation and restoration process, informing call centres and media of outage area and restoration progress, and calling in and dispatching field resources as required. Restoration Priorities Where a large number of network faults have occurred or in situations where the supply capacity has been limited and is likely to remain limited for more than 12 hours, then restoration activities are prioritised to restoring power supply to essential services and critical customers as determined in cooperation with Nelson Tasman Civil Defence. Following restoration of supply to essential services priority will be given to critical customers and then network hierarchy detailed below. Methods of restoration of supply to such customers may be via the distribution network if an 11kV feeder supply is available or by dedicated 11kV supply under conditions of limited power supply availability. Alternatively, temporary on site generation may be utilised. Generators may be supplied by either the customer themselves or by Network Tasman. A list of known portable generation for hire is included as Appendix 11 of this document. Under normal conditions restoration procedures are based on the following network hierarchy 1) 33kV Feeders 2) Zone Substations 3) 11kV Feeder Lines/Cables 4) Distribution Substations 12.2 Catastrophic Events Major Zone Substation Failures The Network Tasman network generally has n-1 security in the transformers at each of its zone substations. This means that no interruption of supply other than that required for switching would be required for the following: Loss of single transformer Loss of one side of 33kV busbar Loss of one side of 11kV indoor switchboard. The network is not designed to provide full supply availability immediately after the following events: Loss of two transformers at a zone substation Network Tasman Asset Management Plan Page 165
196 Total loss of 11kV switchboard Total loss of 33kV Busbar Total loss of entire substation. The fault events above have a very low probability of occurrence, however they could result from a deliberate act such as sabotage or arson, from a major circuit breaker malfunction, or from an act of God such as a massive earthquake or direct lightning strike. In general, the network is not designed to be able to provide backup for either the loss of an entire 11kV indoor switchboard or the total loss of a zone substation, and as a result loss of supply to some customers would be inevitable in these cases until repairs were effected. Where possible, supply would be made to the area via neighbouring substations. Load control and or rolling shutdowns to ration available capacity would then be effected in the remaining area. In the event of total loss of a zone substation restoration efforts would focus on rebuilding a make shift substation utilising a transformer from a substation that was not carrying abnormal load. The make shift substation would have a single transformer with single 33kV circuit breaker on overhead 33kV bus. The 11kV feeder cables would be re-terminated onto two new temporary ground mounted oil switchgear units Extensible ABB SD3. These 11kV switch units are held in emergency stock at the Hope depot. Each of these switch units would be directly connected to the transformer. Earth fault protection would be effected via the transformer NCT and a relay tripping the 33kV circuit breaker. Overload protection would be set at 400A (8MVA) for each transformer. Substation load beyond 16MVA would be temporarily switched away to adjoining substations. The estimated time to complete this work is 72 hours. In the event of the loss of an indoor 11kV switchboard at a major zone substation, two ABB type SD3+SD oil switch units would be installed in the substation switchyard with each of the available transformers connected to them, and operating under split bus solo transformer operation. The earth fault protection would be by means of the transformer NCT directly tripping the 33kV CB. Overload protection would be set at 400A (8MVA) for each transformer. Substation load beyond 16MVA would be temporarily switched away to adjoining substations. The estimated time to complete this work is 48 hours. During the emergency repair operations, localised load limiting would be necessary. The steps in this process of 3.1 above would be followed. Regular media reports would also be made. Appendix 13 details the response plan procedure, equipment and resource requirements and procurement details. Multiple Underground Feeder Failure In the event of multiple underground feeder failure, supply would be restored via available alternative circuits where possible. Repair efforts would then focus on locating and repairing the faulted cables. Typically, a fault location and cable repair exercise will take 12 hrs. One crew would be assigned to each faulted cable section. Simultaneous cable failures may require resource external to Delta Utilities to be deployed. During the period of the repair operations, localised load limiting may be necessary. The steps in this process of 3.1 above would be followed. Regular media reports would also be made. Ripple Injection Plant Failure Network Tasman operates one ripple injection transmitter in each bulk supply region. These are used to switch storage type loads such as domestic and commercial water heaters and space heaters. They are also used in some areas for meter tariff register switching. The worst case scenario is failure of a plant after it has operated to switch off all controllable loads. Network Tasman Asset Management Plan Page 166
197 In the event of a failure at a plant immediate activity would be focussed on finding and rectifying the fault in the existing equipment. Limited spares are held for all plants. A spare transmitter is held by supplier, Landis and Gyr, in Auckland. Limited spares are available for the coupling cells. Ripple control receivers are generally programmed to switch to the on state if they have not received a valid ripple control signal for 24 hours. A media message however would inform customers that they may run out of hot water or that their night storage heaters may go cold within the next hours, and that they should telephone in if that occurred. Energy retailers would also be informed that meters might not have been switched. Recovery efforts would be focussed on re-establishing the ripple control plant with the supplier Landis and Gyr. Fire - Special Procedures In the event of fire, special procedures are needed supplementing normal outage restoration activities. These may include the following: Isolation of the affected area. Liaison with fire control officers to allow fire control. Restoration of affected supplies not in the fire area via alternative routes where possible. Field assessment of damage to network equipment. Formulate repair plans, considering new line routes if fire area likely to be inaccessible for extended period. Oil Spill - Special Procedures In the event of oil spill, field resources will be deployed. Activities will focus on the following priorities: 1. Shutting off the source of spilt oil. 2. Containment of spilled oil. 3. Removal of contaminated soils. 4. Reporting to local authorities. Where oil has been spilled into waterways, professional help may be employed to control oil movement and effect clean-up operations. Appendix 14 details the response plan procedure, equipment, material and resource requirements and procurement details. Network Tasman Asset Management Plan Page 167
198 13. RESPONSE PLAN- TRANSPOWER BULK SUPPLY FAILURE Situations may arise where the supply capacity into the distribution network is constrained. These may be due to one or more of the following: 1. Component failure on the TransPower transmission network 2. Unavailability of generation 3. Reduced capacity at a TransPower bulk supply substation. Specific credible incidences that may cause this are as follows: Event Bulk Supply Areas Affected Repair Time % Capacity Available Loss of 220kV Transmission Tower Kikiwa - Stoke Stoke 48 hrs 20 Loss of double circuit Transmission Tower Islington Kikiwa Stoke, Motueka, Motupipi 48 hrs 70 In these situations, NTL is in the position of managing the total electrical load on the local electricity network to within the supply capacity available. The task reverts to a supply allocation and consumer communications exercise. Generic tasks would include the following: 1) Shutdown all controllable load (typically water heating via ripple control) 2) Activate Rolling Outage Plan to prioritise available supply to feeders with essential services and critical customers. Refer Network Tasman Participant Outage Plan Network Tasman website under Disclosures. (DMS189385) 3) Negotiate with large customers to shutdown or reduce load. 4) Run media campaign for conservation of electricity 5) System Operator to act in advisory capacity with Emergency Management Team Network Tasman Asset Management Plan Page 168
199 14. REFERENCES 14.1 Emergency Plans Nelson Tasman Emergency Management Plan The National Civil Defence Plan 14.2 Network Tasman Asset Management Plan Reliability and Risk Management Plan Use of System Agreements Distribution Code Network Tasman Policies Network Tasman Procedures Network Tasman Design and Construction Standards Network Tasman Participant Outage Plan 14.3 TransPower 14.4 Other NZ Power Companies Directory Network Tasman Asset Management Plan Page 169
200 APPENDIX M M. PROCEDURES FOR RECORDING OUTAGE INFORMATION FOR REGULATORY DISCLOSURE Reliability Recording Policies and Procedures For the purposes of compiling annual SAIDI and SAIFI data: a high voltage outage on the distribution network is defined as an event resulting in loss of supply to any number of consumers for a duration of more than one minute only high voltage outages (6.6kV and above) resulting from de-energisation of any high voltage feeder or conductor are included in SAIDI & SAIFI statistics both planned and unplanned events are included within high voltage outage statistics all high voltage outages are managed through NTL s control room by a qualified NTL system operator the faults and maintenance contract between the company and its faults contractor, Delta, obligates both parties to manage all outage events centrally through the control room. All HV fault switching operations are recorded by the system operator in the control room log at the time the activity takes place. This provides a detailed record of the switching events for future reference. Customers affected by operation of a distribution system high voltage protection device can be divided into: 1. Those within the core fault area (i.e. who won t have supply restored until the necessary line repairs are completed) 2. Those outside the immediate fault area (i.e. who can have power restored through co-ordinated switching activity) To calculate the customer minutes lost under each fault event, each event is approximated as a maximum two step restoration process. This is in keeping with the philosophy of fault restoration which relies on the following a sequential process for supply restoration: 1. Identification, isolation and minimisation of the core fault area. 2. Restoration, through switching, of supply to areas not immediately within the core fault area 3. Making repairs and restoration of the core fault area. The switching and recording process is managed by a NTL system operator using NTL s Geographical Information System (GIS). To record outage data, the operator draws geographical selection polygons around all sections of the high voltage line affected by the fault event. The software is then used to select and identify all the distribution transformers within the fault area. A query is then made into NTL s customer connection database to find and list all customers connected to those transformers affected by the fault event. This data is then used in the following formula to calculate the total customer minutes for a fault event: Total No. of customers initially affected x (Time Unfaulted Area restored Time of Initial Interruption) + No. of Fault area customers x (Time Fault Area restored Time Unfaulted Area restored) Planned and unplanned events use essentially the same recording process however by nature, planned interruptions can be identified to a set of consumers and a known area in advance. The total customer minutes for a planned interruption are thus calculated using the following formula: Total No. of customers interrupted x (Time Interrupted Area restored Time of Initial Interruption) The system operator records detail of all outage events in the NTL Outage Database. This is an access database that remains on line in the control room. Each planned or unplanned event forms a one record entry into the database. The Outages Database is subject to NTL s normal electronic file backup and security protocols. The Outage Database records the following data fields for each event: 1. Date 2. ID number of the protective device that has operated (allows identification of the HV feeder and area affected) Network Tasman Asset Management Plan Page 170
201 3. Area: (Text description of area affected) 4. Description; (Text description of fault cause and type recorded once known) 5. Outage type (Shutdown or Fault) 6. Area Class (Urban or Rural) 7. Fault Class (Overhead or Underground) 8. Fault Voltage (6.6, 11, 33kV) 9. Outage Region (Stoke, Motueka, Golden Bay, Kikiwa, Murchison) 10. Time of Initial Interruption 11. Time Unfaulted Area Restored 12. Time Fault area restored 13. Customers (ICP s) in Total Area (recorded post event) 14. Customers (ICP s) in Fault area (recorded post event) Unless otherwise stated all data is recorded on line by the system operator at the time of the event. The outage database is queried on an as needed basis by NTL s Network and Operations Managers and summary outage statistics are prepared and provided to NTL s CEO and Board of Directors on a monthly basis. Annual outage statistics are prepared and independently audited for regulatory reporting purposes. The summary statistics are recorded on a cumulative basis and are used for comparative analysis and form a key input into NTL annual Asset Management Planning process. Annual data is also reported against NTL s SCI reliability targets. These targets are negotiated annually with the Network Tasman Trust. Network Tasman Asset Management Plan Page 171
202 APPENDIX N N. INFORMATION DISCLOSURE SCHEDULES Schedule 11a Report on Forecast Capital Expenditure Schedule 11b Report on Forecast Operational Expenditure Schedule 12a Report on Asset Condition Schedule 12b Report on Forecast Capacity Schedule 12c Report on Forecast Network Demand Schedule 12d Report on Forecast Interruptions and Duration Schedule 13 Report on Asset Management Maturity Network Tasman Asset Management Plan Page 172
 1 April 2019 Templates for Schedules 11a 13 (Asset Management Plan) Template Version 4.1. Prepared 21 December 2017 AMP Sch11-13 2019 1 CoverSheet")
203 Commerce Commission Information Disclosure Template EDB Information Disclosure Requirements Information Templates for Schedules 11a 13 Company Name Network Tasman Limited Disclosure Date 31 March 2019 AMP Planning Period Start Date (first day) 1 April 2019 Templates for Schedules 11a 13 (Asset Management Plan) Template Version 4.1. Prepared 21 December 2017 AMP Sch CoverSheet
204 Commerce Commission Information Disclosure Template Table of Contents Information disclosure asset management plan schedules Schedule Schedule name 11a REPORT ON FORECAST CAPITAL EXPENDITURE 11b REPORT ON FORECAST OPERATIONAL EXPENDITURE 12a REPORT ON ASSET CONDITION 12b REPORT ON FORECAST CAPACITY 12c REPORT ON FORECAST NETWORK DEMAND 12d REPORT FORECAST INTERRUPTIONS AND DURATION 13 REPORT ON ASSET MANAGEMENT MATURITY AMP Sch TOC
205 Commerce Commission Information Disclosure Template Disclosure Template Instructions These templates have been prepared for use by EDBs when making disclosures under subclauses 2.6.1(1)(d), 2.6.1(1)(e), 2.6.1(2), 2.6.5(6), 2.6.6(1) and 2.6.6(2) of the Electricity Distribution Information Disclosure Determination The EDB may include a completed Schedule 13: Report on Asset Management Maturity table with its disclosures made under subclause 2.6.6(1) and 2.6.6(2), but this is not required. Schedule 13 tables that are not completed should be removed from disclosures made under subclause 2.6.6(1) and 2.6.6(2). Company Name and Dates To prepare the templates for disclosure, the supplier's company name should be entered in cell C8, the date of the first day of the 10 year planning period should be entered in cell C12, and the date on which the information is disclosed should be entered in cell C10 of the CoverSheet worksheet. The cell C12 entry (planning period start date) is used to calculate disclosure years in the column headings that show above some of the tables. It is also used to calculate the AMP planning period dates in the template title blocks (the title blocks are the light green shaded areas at the top of each template). The cell C8 entry (company name ) is used in the template title blocks. Dates should be entered in day/month/year order (Example -"1 April 2013"). Data Entry Cells and Calculated Cells Data entered into this workbook may be entered only into the data entry cells. Data entry cells are the bordered, unshaded areas (white cells) in each template. Under no circumstances should data be entered into the workbook outside a data entry cell. In some cases, where the information for disclosure is able to be ascertained from disclosures elsewhere in the workbook, such information is disclosed in a calculated cell. Validation Settings on Data Entry Cells To maintain a consistency of format and to guard against errors in data entry, some data entry cells test entries for validity and accept only a limited range of values. For example, entries may be limited to a list of category names or to values between 0% and 100%. Where this occurs, a validation message will appear when data is being entered. Conditional Formatting Settings on Data Entry Cells Schedule 12a columns G to K contains conditional formatting. The cells will change colour if the row totals do not add to 100%. Inserting Additional Rows The templates for schedules 11a, 12b and 12c may require additional rows to be inserted in tables marked 'include additional rows if needed'. Additional rows must not be inserted directly above the first row or below the last row of a table. This is to ensure that entries made in the new row are included in the totals. For schedule 12b the formula for column J (Utilisation of Installed Firm Capacity %) will need to be copied into the inserted row(s). Column A schedule references should not be entered in additional rows. Schedule References The references labelled 'sch ref' in the leftmost column of each template are consistent with the row references in the Electricity Distribution ID Determination 2012 (as issued on 21 December 2017). They provide a common reference between the rows in the determination and the template. Description of Calculation References Calculation cell formulas contain links to other cells within the same template or elsewhere in the workbook. Key cell references are described in a column to the right of each template. These descriptions are provided to assist data entry. Cell references refer to the row of the template and not the schedule reference. AMP Sch Instructions
206 Commerce Commission Information Disclosure Template SCHEDULE 11a: REPORT ON FORECAST CAPITAL EXPENDITURE sch ref Company Name AMP Planning Period Network Tasman Limited 1 April March 2029 This schedule requires a breakdown of forecast expenditure on assets for the current disclosure year and a 10 year planning period. The forecasts should be consistent with the supporting information set out in the AMP. The forecast is to be expressed in both constant price and nominal dollar terms. Also required is a forecast of the value of commissioned assets (i.e., the value of RAB additions) EDBs must provide explanatory comment on the difference between constant price and nominal dollar forecasts of expenditure on assets in Schedule 14a (Mandatory Explanatory Notes). This information is not part of audited disclosure information. 7 Current Year CY CY+1 CY+2 CY+3 CY+4 CY+5 CY+6 CY+7 CY+8 CY+9 CY+10 8 for year ended 31 Mar Mar Mar Mar Mar Mar Mar Mar Mar Mar Mar a(i): Expenditure on Assets Forecast $000 (in nominal dollars) 10 Consumer connection System growth 5,860 5,213 6,052 10,033 7,814 10,763 6,584 9,474 6,103 2, Asset replacement and renewal 2,614 3,403 4,736 6,027 3,282 3,131 3,415 3,844 3,553 3,624 3, Asset relocations Reliability, safety and environment: 15 Quality of supply 429 3, Legislative and regulatory Other reliability, safety and environment Total reliability, safety and environment 1,031 4,980 1, , Expenditure on network assets 11,219 14,986 13,864 18,130 13,367 16,016 12,031 15,390 11,769 7,787 6, Expenditure on non-network assets Expenditure on assets 12,177 15,502 14,477 18,738 13,996 16,653 12,683 16,054 12,447 8,478 7, plus Cost of financing less Value of capital contributions plus Value of vested assets Capital expenditure forecast 12,356 15,593 14,511 18,712 14,076 16,729 12,841 16,203 12,724 8,898 7, Assets commissioned 8,328 17,262 11,861 15,303 12,366 14,218 11,587 13,638 11,228 8,430 7, Current Year CY CY+1 CY+2 CY+3 CY+4 CY+5 CY+6 CY+7 CY+8 CY+9 CY for year ended 31 Mar Mar Mar Mar Mar Mar Mar Mar Mar Mar Mar $000 (in constant prices) 33 Consumer connection System growth 5,859 5,213 5,933 9,643 7,363 9,943 5,963 8,413 5,313 1, Asset replacement and renewal 2,614 3,403 4,643 5,793 3,093 2,893 3,093 3,413 3,093 3,093 2, Asset relocations Reliability, safety and environment: 38 Quality of supply 429 3, Legislative and regulatory Other reliability, safety and environment Total reliability, safety and environment 1,031 4,980 1, , Expenditure on network assets 11,218 14,986 13,591 17,426 12,596 14,796 10,896 13,666 10,246 6,646 5, Expenditure on non-network assets Expenditure on assets 12,176 15,502 14,192 18,011 13,189 15,385 11,487 14,256 10,836 7,236 6, Subcomponents of expenditure on assets (where known) 47 Energy efficiency and demand side management, reduction of energy losses Overhead to underground conversion Research and development Current Year CY CY+1 CY+2 CY+3 CY+4 CY+5 CY+6 CY+7 CY+8 CY+9 CY for year ended 31 Mar Mar Mar Mar Mar Mar Mar Mar Mar Mar Mar Difference between nominal and constant price forecasts $ Consumer connection System growth , Asset replacement and renewal Asset relocations AMP Sch S11a.Capex Forecast
207 Commerce Commission Information Disclosure Template SCHEDULE 11a: REPORT ON FORECAST CAPITAL EXPENDITURE Company Name AMP Planning Period Network Tasman Limited 1 April March 2029 This schedule requires a breakdown of forecast expenditure on assets for the current disclosure year and a 10 year planning period. The forecasts should be consistent with the supporting information set out in the AMP. The forecast is to be expressed in both constant price and nominal dollar terms. Also required is a forecast of the value of commissioned assets (i.e., the value of RAB additions) EDBs must provide explanatory comment on the difference between constant price and nominal dollar forecasts of expenditure on assets in Schedule 14a (Mandatory Explanatory Notes). This information is not part of audited disclosure information. sch ref 58 Reliability, safety and environment: 59 Quality of supply Legislative and regulatory Other reliability, safety and environment Total reliability, safety and environment Expenditure on network assets ,220 1,135 1,724 1,523 1,141 1, Expenditure on non-network assets Expenditure on assets ,268 1,196 1,798 1,611 1,242 1, Current Year CY CY+1 CY+2 CY+3 CY+4 CY+5 for year ended 31 Mar Mar Mar Mar Mar Mar a(ii): Consumer Connection 69 Consumer types defined by EDB* $000 (in constant prices) 70 Consumers 20kVA and less Consumers greater than 20kVA *include additional rows if needed 76 Consumer connection expenditure less Capital contributions funding consumer connection Consumer connection less capital contributions a(iii): System Growth 80 Subtransmission 3 2, ,500 4, Zone substations 4,621 1,500 2,400 5, Distribution and LV lines ,630 2,250 3, Distribution and LV cables , Distribution substations and transformers Distribution switchgear Other network assets System growth expenditure 5,859 5,213 5,933 9,643 7,363 9, less Capital contributions funding system growth System growth less capital contributions 5,859 5,163 5,885 9,586 7,264 9, Current Year CY CY+1 CY+2 CY+3 CY+4 CY+5 92 for year ended 31 Mar Mar Mar Mar Mar Mar a(iv): Asset Replacement and Renewal $000 (in constant prices) 94 Subtransmission Zone substations ,600 1, Distribution and LV lines 696 1,940 1,940 1,940 1,940 1, Distribution and LV cables , Distribution substations and transformers Distribution switchgear 1, Other network assets Asset replacement and renewal expenditure 2,614 3,403 4,643 5,793 3,093 2, less Capital contributions funding asset replacement and renewal Asset replacement and renewal less capital contributions 2,488 3,239 4,419 5,514 2,944 2, Current Year CY CY+1 CY+2 CY+3 CY+4 CY for year ended 31 Mar Mar Mar Mar Mar Mar a(v): Asset Relocations AMP Sch S11a.Capex Forecast
208 Commerce Commission Information Disclosure Template SCHEDULE 11a: REPORT ON FORECAST CAPITAL EXPENDITURE sch ref 108 Project or programme* $000 (in constant prices) 109 Undergrounding High St Mot Undergrounding Bateup Road Underground Ellis St Brightwater *include additional rows if needed 115 All other project or programmes - asset relocations Asset relocations expenditure less Capital contributions funding asset relocations Asset relocations less capital contributions Company Name AMP Planning Period Network Tasman Limited 1 April March 2029 This schedule requires a breakdown of forecast expenditure on assets for the current disclosure year and a 10 year planning period. The forecasts should be consistent with the supporting information set out in the AMP. The forecast is to be expressed in both constant price and nominal dollar terms. Also required is a forecast of the value of commissioned assets (i.e., the value of RAB additions) EDBs must provide explanatory comment on the difference between constant price and nominal dollar forecasts of expenditure on assets in Schedule 14a (Mandatory Explanatory Notes). This information is not part of audited disclosure information Current Year CY CY+1 CY+2 CY+3 CY+4 CY for year ended 31 Mar Mar Mar Mar Mar Mar a(vi): Quality of Supply 123 Project or programme* $000 (in constant prices) 124 Portable Generators /66kV Networks 7 2, Switchgear New Reclosers kV interconnections *include additional rows if needed 130 All other projects or programmes - quality of supply Quality of supply expenditure 429 3, less Capital contributions funding quality of supply Quality of supply less capital contributions 429 3, Current Year CY CY+1 CY+2 CY+3 CY+4 CY for year ended 31 Mar Mar Mar Mar Mar Mar a(vii): Legislative and Regulatory 138 Project or programme* $000 (in constant prices) 139 Platform Transformer to Padmount Conversions *include additional rows if needed 145 All other projects or programmes - legislative and regulatory Legislative and regulatory expenditure less Capital contributions funding legislative and regulatory Legislative and regulatory less capital contributions Current Year CY CY+1 CY+2 CY+3 CY+4 CY+5 for year ended 31 Mar Mar Mar Mar Mar Mar a(viii): Other Reliability, Safety and Environment 152 Project or programme* $000 (in constant prices) 153 Transformer Bunding Platform Transformer Seismic Strengthening Relay Upgrades *include additional rows if needed AMP Sch S11a.Capex Forecast
209 Commerce Commission Information Disclosure Template SCHEDULE 11a: REPORT ON FORECAST CAPITAL EXPENDITURE Company Name AMP Planning Period Network Tasman Limited 1 April March 2029 This schedule requires a breakdown of forecast expenditure on assets for the current disclosure year and a 10 year planning period. The forecasts should be consistent with the supporting information set out in the AMP. The forecast is to be expressed in both constant price and nominal dollar terms. Also required is a forecast of the value of commissioned assets (i.e., the value of RAB additions) EDBs must provide explanatory comment on the difference between constant price and nominal dollar forecasts of expenditure on assets in Schedule 14a (Mandatory Explanatory Notes). This information is not part of audited disclosure information. sch ref 159 All other projects or programmes - other reliability, safety and environment Other reliability, safety and environment expenditure less Capital contributions funding other reliability, safety and environment Other reliability, safety and environment less capital contributions Current Year CY CY+1 CY+2 CY+3 CY+4 CY for year ended 31 Mar Mar Mar Mar Mar Mar a(ix): Non-Network Assets 167 Routine expenditure 168 Project or programme* $000 (in constant prices) *include additional rows if needed 175 All other projects or programmes - routine expenditure Routine expenditure Atypical expenditure 178 Project or programme* *include additional rows if needed 185 All other projects or programmes - atypical expenditure Atypical expenditure Expenditure on non-network assets AMP Sch S11a.Capex Forecast
210 Commerce Commission Information Disclosure Template SCHEDULE 11b: REPORT ON FORECAST OPERATIONAL EXPENDITURE sch ref Company Name AMP Planning Period Network Tasman Limited 1 April March 2029 This schedule requires a breakdown of forecast operational expenditure for the disclosure year and a 10 year planning period. The forecasts should be consistent with the supporting information set out in the AMP. The forecast is to be expressed in both constant price and nominal dollar terms. EDBs must provide explanatory comment on the difference between constant price and nominal dollar operational expenditure forecasts in Schedule 14a (Mandatory Explanatory Notes). This information is not part of audited disclosure information. 7 Current Year CY CY+1 CY+2 CY+3 CY+4 CY+5 CY+6 CY+7 CY+8 CY+9 CY+10 8 for year ended 31 Mar Mar Mar Mar Mar Mar Mar Mar Mar Mar Mar 29 9 Operational Expenditure Forecast $000 (in nominal dollars) 10 Service interruptions and emergencies 1,024 1,100 1,133 1,167 1,203 1,239 1,276 1,315 1,355 1,396 1, Vegetation management 1,106 1,149 1,184 1,220 1,257 1,295 1,334 1,374 1,415 1,458 1, Routine and corrective maintenance and inspection 1,981 2,153 2,218 2,285 2,354 2,425 2,498 2,573 2,651 2,731 2, Asset replacement and renewal 1,664 1,715 1,767 1,820 1,875 1,932 1,990 2,050 2,112 2,176 2, Network Opex 5,775 6,117 6,302 6,492 6,689 6,891 7,098 7,312 7,533 7,761 7, System operations and network support 2,166 2,446 2,519 2,596 2,674 2,755 2,838 2,924 3,012 3,103 3, Business support 2,581 2,773 2,857 2,943 3,032 3,124 3,218 3,315 3,415 3,518 3, Non-network opex 4,747 5,219 5,376 5,539 5,706 5,879 6,056 6,239 6,427 6,621 6, Operational expenditure 10,522 11,336 11,678 12,031 12,395 12,770 13,154 13,551 13,960 14,382 14, Current Year CY CY+1 CY+2 CY+3 CY+4 CY+5 CY+6 CY+7 CY+8 CY+9 CY for year ended 31 Mar Mar Mar Mar Mar Mar Mar Mar Mar Mar Mar $000 (in constant prices) 22 Service interruptions and emergencies 1,024 1,100 1,111 1,122 1,133 1,145 1,156 1,168 1,179 1,191 1, Vegetation management 1,106 1,149 1,161 1,172 1,184 1,196 1,208 1,220 1,232 1,245 1, Routine and corrective maintenance and inspection 1,981 2,153 2,174 2,196 2,218 2,240 2,262 2,285 2,308 2,331 2, Asset replacement and renewal 1,664 1,715 1,732 1,750 1,767 1,785 1,803 1,821 1,839 1,857 1, Network Opex 5,775 6,117 6,178 6,240 6,302 6,366 6,429 6,494 6,558 6,624 6, System operations and network support 2,166 2,446 2,470 2,495 2,520 2,545 2,570 2,596 2,622 2,648 2, Business support 2,581 2,773 2,801 2,829 2,857 2,886 2,915 2,944 2,973 3,003 3, Non-network opex 4,747 5,219 5,271 5,324 5,377 5,431 5,485 5,540 5,595 5,651 5, Operational expenditure 10,522 11,336 11,449 11,564 11,679 11,797 11,914 12,034 12,153 12,275 12, Subcomponents of operational expenditure (where known) Energy efficiency and demand side management, reduction of energy losses Direct billing* Research and Development Insurance * Direct billing expenditure by suppliers that direct bill the majority of their consumers Current Year CY CY+1 CY+2 CY+3 CY+4 CY+5 CY+6 CY+7 CY+8 CY+9 CY for year ended 31 Mar Mar Mar Mar Mar Mar Mar Mar Mar Mar Mar Difference between nominal and real forecasts $ Service interruptions and emergencies Vegetation management Routine and corrective maintenance and inspection Asset replacement and renewal Network Opex ,137 1, System operations and network support Business support Non-network opex , Operational expenditure ,240 1,517 1,807 2,107 2,420 AMP Sch S11b.Opex Forecast
211 Commerce Commission Information Disclosure Template SCHEDULE 12a: REPORT ON ASSET CONDITION Company Name AMP Planning Period Network Tasman Limited 1 April March 2029 This schedule requires a breakdown of asset condition by asset class as at the start of the forecast year. The data accuracy assessment relates to the percentage values disclosed in the asset condition columns. Also required is a forecast of the percentage of units to be replaced in the next 5 years. All information should be consistent with the information provided in the AMP and the expenditure on assets forecast in Schedule 11a. All units relating to cable and line assets, that are expressed in km, refer to circuit lengths. sch ref Voltage Asset category Asset class Units H1 H2 H3 H4 H5 Grade unknown Data accuracy (1 4) 10 All Overhead Line Concrete poles / steel structure No % 19.00% 70.00% 10.00% % 11 All Overhead Line Wood poles No % 50.00% All Overhead Line Other pole types No % 40.00% % 13 HV Subtransmission Line Subtransmission OH up to 66kV conductor km % 90.00% HV Subtransmission Line Subtransmission OH 110kV+ conductor km N/A N/A N/A N/A N/A N/A N/A N/A 15 HV Subtransmission Cable Subtransmission UG up to 66kV (XLPE) km % 20.00% 4 16 HV Subtransmission Cable Subtransmission UG up to 66kV (Oil pressurised) km N/A N/A N/A N/A N/A N/A N/A N/A 17 HV Subtransmission Cable Subtransmission UG up to 66kV (Gas pressurised) km N/A N/A N/A N/A N/A N/A N/A N/A 18 HV Subtransmission Cable Subtransmission UG up to 66kV (PILC) km % HV Subtransmission Cable Subtransmission UG 110kV+ (XLPE) km N/A N/A N/A N/A N/A N/A N/A N/A 20 HV Subtransmission Cable Subtransmission UG 110kV+ (Oil pressurised) km N/A N/A N/A N/A N/A N/A N/A N/A 21 HV Subtransmission Cable Subtransmission UG 110kV+ (Gas Pressurised) km N/A N/A N/A N/A N/A N/A N/A N/A 22 HV Subtransmission Cable Subtransmission UG 110kV+ (PILC) km N/A N/A N/A N/A N/A N/A N/A N/A 23 HV Subtransmission Cable Subtransmission submarine cable km N/A N/A N/A N/A N/A N/A N/A N/A 24 HV Zone substation Buildings Zone substations up to 66kV No % 72.00% 21.00% % 25 HV Zone substation Buildings Zone substations 110kV+ No. N/A N/A N/A N/A N/A N/A N/A N/A 26 HV Zone substation switchgear 22/33kV CB (Indoor) No % HV Zone substation switchgear 22/33kV CB (Outdoor) No % 90.00% % 28 HV Zone substation switchgear 33kV Switch (Ground Mounted) No. N/A N/A N/A N/A N/A N/A N/A N/A 29 HV Zone substation switchgear 33kV Switch (Pole Mounted) No % HV Zone substation switchgear 33kV RMU No. N/A N/A N/A N/A N/A N/A N/A N/A 31 HV Zone substation switchgear 50/66/110kV CB (Indoor) No. N/A N/A N/A N/A N/A N/A N/A N/A 32 HV Zone substation switchgear 50/66/110kV CB (Outdoor) No % 11.00% HV Zone substation switchgear 3.3/6.6/11/22kV CB (ground mounted) No % 87.00% HV Zone substation switchgear 3.3/6.6/11/22kV CB (pole mounted) No % 50.00% Asset condition at start of planning period (percentage of units by grade) Asset condition at start of planning period (percentage of units by grade) Voltage Asset category Asset class Units H1 H2 H3 H4 H5 Grade unknown Data accuracy (1 4) 39 HV Zone Substation Transformer Zone Substation Transformers No % 16.00% % 40 HV Distribution Line Distribution OH Open Wire Conductor km 4.00% 12.00% 84.00% % 41 HV Distribution Line Distribution OH Aerial Cable Conductor km N/A N/A N/A N/A N/A N/A N/A N/A 42 HV Distribution Line SWER conductor km N/A N/A N/A N/A N/A N/A N/A N/A % of asset forecast to be replaced in next 5 years % of asset forecast to be replaced in next 5 years 43 HV Distribution Cable Distribution UG XLPE or PVC km % HV Distribution Cable Distribution UG PILC km % 12.00% 85.00% % AMP Sch S12a.Asset Condition
212 Commerce Commission Information Disclosure Template SCHEDULE 12a: REPORT ON ASSET CONDITION Company Name AMP Planning Period Network Tasman Limited 1 April March 2029 This schedule requires a breakdown of asset condition by asset class as at the start of the forecast year. The data accuracy assessment relates to the percentage values disclosed in the asset condition columns. Also required is a forecast of the percentage of units to be replaced in the next 5 years. All information should be consistent with the information provided in the AMP and the expenditure on assets forecast in Schedule 11a. All units relating to cable and line assets, that are expressed in km, refer to circuit lengths. sch ref 45 HV Distribution Cable Distribution Submarine Cable km % 60.00% HV Distribution switchgear 3.3/6.6/11/22kV CB (pole mounted) - reclosers and sectionalisers No % 9.00% HV Distribution switchgear 3.3/6.6/11/22kV CB (Indoor) No. N/A N/A N/A N/A N/A N/A N/A N/A 48 HV Distribution switchgear 3.3/6.6/11/22kV Switches and fuses (pole mounted) No % 25.00% 60.00% 5.00% % 49 HV Distribution switchgear 3.3/6.6/11/22kV Switch (ground mounted) - except RMU No % HV Distribution switchgear 3.3/6.6/11/22kV RMU No % 5.00% HV Distribution Transformer Pole Mounted Transformer No % 34.00% 60.00% 3.00% % 52 HV Distribution Transformer Ground Mounted Transformer No % 82.00% 2.00% HV Distribution Transformer Voltage regulators No % HV Distribution Substations Ground Mounted Substation Housing No % LV LV Line LV OH Conductor km 5.00% 35.00% 60.00% % 56 LV LV Cable LV UG Cable km % 90.00% LV LV Streetlighting LV OH/UG Streetlight circuit km N/A N/A N/A N/A N/A N/A N/A N/A 58 LV Connections OH/UG consumer service connections No. 5.00% 25.00% 65.00% 5.00% % 59 All Protection Protection relays (electromechanical, solid state and numeric) No % 80.00% 10.00% % 60 All SCADA and communications SCADA and communications equipment operating as a single system Lot % All Capacitor Banks Capacitors including controls No % All Load Control Centralised plant Lot % All Load Control Relays No. N/A N/A N/A N/A N/A N/A N/A N/A 64 All Civils Cable Tunnels km N/A N/A N/A N/A N/A N/A N/A N/A AMP Sch S12a.Asset Condition
213 Commerce Commission Information Disclosure Template SCHEDULE 12b: REPORT ON FORECAST CAPACITY Company Name This schedule requires a breakdown of current and forecast capacity and utilisation for each zone substation and current distribution transformer capacity. The data provided should be consistent with the information provided in the AMP. Information provided in this table should relate to the operation of the network in its normal steady state configuration. Network Tasman Limited AMP Planning Period 1 April March 2029 sch ref 7 12b(i): System Growth - Zone Substations 8 Existing Zone Substations Current Peak Load (MVA) Installed Firm Capacity (MVA) Security of Supply Classification (type) Transfer Capacity (MVA) Utilisation of Installed Firm Capacity % Installed Firm Capacity +5 years (MVA) Utilisation of Installed Firm Capacity + 5yrs % Installed Firm Capacity Constraint +5 years (cause) 9 Founders 7 15 N % 15 33% No constraint within +5 years 10 Annesbrook N % 23 87% No constraint within +5 years 11 Songer St N % 23 89% No constraint within +5 years 12 Richmond N % 23 89% No constraint within +5 years 13 Hope 9 10 N % 23 50% Transformer Transformer Upgrade to 23MVA firm in Mapua 5 10 N 4 54% 10 58% Subtransmission circuit Subtransmssion circuit has N security only 15 Brightwater 7 15 N % 15 65% No constraint within +5 years 16 Eves Valley 4 5 N % 5 76% No constraint within +5 years 17 Takaka 5 8 N - 64% 8 66% Subtransmission circuit Subtransmssion circuit has N security only 18 Swamp Road 3 3 N 1 87% 3 93% Subtransmission circuit Subtransmssion circuit has N security only 19 Lower Queen St N - 63% 30 63% Subtransmission circuit Industrial customer only requires N security in Subtransmission 20 Motueka N % 23 96% No constraint within +5 years 21 Upper Takaka 1 6 N % 6 15% No constraint within +5 years ¹ Extend forecast capacity table as necessary to disclose all capacity by each zone substation Explanation AMP Sch S12b.Capacity Forecast
214 Commerce Commission Information Disclosure Template SCHEDULE 12C: REPORT ON FORECAST NETWORK DEMAND Company Name AMP Planning Period Network Tasman Limited 1 April March 2029 This schedule requires a forecast of new connections (by consumer type), peak demand and energy volumes for the disclosure year and a 5 year planning period. The forecasts should be consistent with the supporting information set out in the AMP as well as the assumptions used in developing the expenditure forecasts in Schedule 11a and Schedule 11b and the capacity and utilisation forecasts in Schedule 12b. sch ref 7 12c(i): Consumer Connections 8 Number of ICPs connected in year by consumer type Number of connections 9 Current Year CY CY+1 CY+2 CY+3 CY+4 CY+5 10 for year ended 31 Mar Mar Mar Mar Mar Mar Consumer types defined by EDB* 12 Group Group Group Group Group Connections total *include additional rows if needed 19 Distributed generation 20 Number of connections Capacity of distributed generation installed in year (MVA) c(ii) System Demand 23 Current Year CY CY+1 CY+2 CY+3 CY+4 CY+5 24 Maximum coincident system demand (MW) for year ended 31 Mar Mar Mar Mar Mar Mar GXP demand plus Distributed generation output at HV and above Maximum coincident system demand less Net transfers to (from) other EDBs at HV and above Demand on system for supply to consumers' connection points Electricity volumes carried (GWh) 31 Electricity supplied from GXPs less Electricity exports to GXPs plus Electricity supplied from distributed generation less Net electricity supplied to (from) other EDBs Electricity entering system for supply to ICPs less Total energy delivered to ICPs Losses Load factor 68% 62% 60% 59% 60% 60% 40 Loss ratio 5.8% 5.8% 5.9% 5.8% 5.8% 5.8% AMP Sch S12c.Demand Forecast
215 Commerce Commission Information Disclosure Template SCHEDULE 12d: REPORT FORECAST INTERRUPTIONS AND DURATION sch ref Company Name AMP Planning Period Network / Sub-network Name Network Tasman Limited 1 April March 2029 This schedule requires a forecast of SAIFI and SAIDI for disclosure and a 5 year planning period. The forecasts should be consistent with the supporting information set out in the AMP as well as the assumed impact of planned and unplanned SAIFI and SAIDI on the expenditures forecast provided in Schedule 11a and Schedule 11b. 8 Current Year CY CY+1 CY+2 CY+3 CY+4 CY+5 9 for year ended 31 Mar Mar Mar Mar Mar Mar SAIDI 11 Class B (planned interruptions on the network) Class C (unplanned interruptions on the network) SAIFI 14 Class B (planned interruptions on the network) Class C (unplanned interruptions on the network) AMP Sch S12d.Reliability Forecast
216 Commerce Commission Information Disclosure Template SCHEDULE 13: REPORT ON ASSET MANAGEMENT MATURITY This schedule requires information on the EDB S self-assessment of the maturity of its asset management practices. Company Name AMP Planning Period Asset Management Standard Applied Network Tasman Limited 1 April March 2029 Question No. Function Question Score Evidence Summary User Guidance Why Who Record/documented Information 3 Asset management policy Top management. The management team that has overall responsibility for asset management. To what extent has an asset management policy been documented, authorised and communicated? 3 Although there is no specific AM Policy, chapter 2.2 of the AMP embodies the key elements of an AM Policy (systematic asset investment driven by customer preferences for supply reliability and price). Board sign-off of the AMP can be considered authorisation of these policy elements. Network manager noted that chapter 6.2 of the AMP includes replacement policies for individual asset categories. Widely used AM practice standards require an organisation to document, authorise and communicate its asset management policy (eg, as required in PAS 55 para 4.2 i). A key pre-requisite of any robust policy is that the organisation's top management must be seen to endorse and fully support it. Also vital to the effective implementation of the policy, is to tell the appropriate people of its content and their obligations under it. Where an organisation outsources some of its asset-related activities, then these people and their organisations must equally be made aware of the policy's content. Also, there may be other stakeholders, such as regulatory authorities and shareholders who should be made aware of it. The organisation's asset management policy, its organisational strategic plan, documents indicating how the asset management policy was based upon the needs of the organisation and evidence of communication. 10 Asset management strategy What has the organisation done to ensure that its asset management strategy is consistent with other appropriate organisational policies and strategies, and the needs of stakeholders? 3 Chapter 2.2 of the AMP sets out a range of stakeholder goals (eg. delivering supply reliability and prices aligned to customer consultation results etc) that drive the AM Strategy. Network manager noted that the latest (Nov 2018) customer consultation recorded a 90% satisfaction including a strong preference for paying about the same to have about the same reliability. In setting an organisation's asset management strategy, it is important that it is consistent with any other policies and strategies that the organisation has and has taken into account the requirements of relevant stakeholders. This question examines to what extent the asset management strategy is consistent with other organisational policies and strategies (eg, as required by PAS 55 para b) and has taken account of stakeholder requirements as required by PAS 55 para c). Generally, this will take into account the same polices, strategies and stakeholder requirements as covered in drafting the asset management policy but at a greater level of detail. Top management. The organisation's strategic planning team. The management team that has overall responsibility for asset management. The organisation's asset management strategy document and other related organisational policies and strategies. Other than the organisation's strategic plan, these could include those relating to health and safety, environmental, etc. Results of stakeholder consultation. 11 Asset management strategy In what way does the organisation's asset management strategy take account of the lifecycle of the assets, asset types and asset systems over which the organisation has stewardship? 3 Chapters 6.1 and 6.2 of the AMP clearly recognise asset classes, and recognise the deterioration of assets over time. Chapter 6.6 of the AMP sets out the lifecycle tactics for each asset class. Good asset stewardship is the hallmark of an organisation compliant with widely used AM standards. A key component of this is the need to take account of the lifecycle of the assets, asset types and asset systems. (For example, this requirement is recognised in d) of PAS 55). This question explores what an organisation has done to take lifecycle into account in its asset management strategy. Top management. People in the organisation with expert knowledge of the assets, asset types, asset systems and their associated life-cycles. The management team that has overall responsibility for asset management. Those responsible for developing and adopting methods and processes used in asset management The organisation's documented asset management strategy and supporting working documents. 26 Asset management plan(s) How does the organisation establish and document its asset management plan(s) across the life cycle activities of its assets and asset systems? 3 Chapter 6.6 of the AMP sets out the lifecycle management policies and tactics for major asset classes. It is noted that the Design Standards, the Construction Standards and the Material Specifications are a key driver of lifecycle performance. Network manager noted that the Design Standards can be amended as a result of performance and faults. The asset management strategy need to be translated into practical plan(s) so that all parties know how the objectives will be achieved. The development of plan(s) will need to identify the specific tasks and activities required to optimize costs, risks and performance of the assets and/or asset system(s), when they are to be carried out and the resources required. The management team with overall responsibility for the asset management system. Operations, maintenance and engineering managers. The organisation's asset management plan(s). AMP Sch S13.AMMAT
217 Commerce Commission Information Disclosure Template SCHEDULE 13: REPORT ON ASSET MANAGEMENT MATURITY (cont) Company Name AMP Planning Period Asset Management Standard Applied Network Tasman Limited 1 April March 2029 Question No. Function Question Maturity Level 0 Maturity Level 1 Maturity Level 2 Maturity Level 3 Maturity Level 4 3 Asset management policy The organisation does not have a documented asset management policy. To what extent has an asset management policy been documented, authorised and communicated? The organisation has an asset management policy, but it has not been authorised by top management, or it is not influencing the management of the assets. The organisation has an asset management policy, which has been authorised by top management, but it has had limited circulation. It may be in use to influence development of strategy and planning but its effect is limited. The asset management policy is authorised by top management, is widely and effectively communicated to all relevant employees and stakeholders, and used to make these persons aware of their asset related obligations. The organisation's process(es) surpass the standard required to comply with requirements set out in a recognised standard. The assessor is advised to note in the Evidence section why this is the case and the evidence seen. 10 Asset management strategy What has the organisation done to ensure that its asset management strategy is consistent with other appropriate organisational policies and strategies, and the needs of stakeholders? The organisation has not considered the need to ensure that its asset management strategy is appropriately aligned with the organisation's other organisational policies and strategies or with stakeholder requirements. OR The organisation does not have an asset management strategy. The need to align the asset management strategy with other organisational policies and strategies as well as stakeholder requirements is understood and work has started to identify the linkages or to incorporate them in the drafting of asset management strategy. Some of the linkages between the longterm asset management strategy and other organisational policies, strategies and stakeholder requirements are defined but the work is fairly well advanced but still incomplete. All linkages are in place and evidence is available to demonstrate that, where appropriate, the organisation's asset management strategy is consistent with its other organisational policies and strategies. The organisation has also identified and considered the requirements of relevant stakeholders. The organisation's process(es) surpass the standard required to comply with requirements set out in a recognised standard. The assessor is advised to note in the Evidence section why this is the case and the evidence seen. 11 Asset management strategy In what way does the organisation's asset management strategy take account of the lifecycle of the assets, asset types and asset systems over which the organisation has stewardship? The organisation has not considered the need to ensure that its asset management strategy is produced with due regard to the lifecycle of the assets, asset types or asset systems that it manages. OR The organisation does not have an asset management strategy. The need is understood, and the organisation is drafting its asset management strategy to address the lifecycle of its assets, asset types and asset systems. The long-term asset management strategy takes account of the lifecycle of some, but not all, of its assets, asset types and asset systems. The asset management strategy takes account of the lifecycle of all of its assets, asset types and asset systems. The organisation's process(es) surpass the standard required to comply with requirements set out in a recognised standard. The assessor is advised to note in the Evidence section why this is the case and the evidence seen. 26 Asset management plan(s) How does the organisation establish and document its asset management plan(s) across the life cycle activities of its assets and asset systems? The organisation does not have an identifiable asset management plan(s) covering asset systems and critical assets. The organisation has asset management plan(s) but they are not aligned with the asset management strategy and objectives and do not take into consideration the full asset life cycle (including asset creation, acquisition, enhancement, utilisation, maintenance decommissioning and disposal). The organisation is in the process of putting in place comprehensive, documented asset management plan(s) that cover all life cycle activities, clearly aligned to asset management objectives and the asset management strategy. Asset management plan(s) are established, documented, implemented and maintained for asset systems and critical assets to achieve the asset management strategy and asset management objectives across all life cycle phases. The organisation's process(es) surpass the standard required to comply with requirements set out in a recognised standard. The assessor is advised to note in the Evidence section why this is the case and the evidence seen. AMP Sch S13.AMMAT
218 Commerce Commission Information Disclosure Template SCHEDULE 13: REPORT ON ASSET MANAGEMENT MATURITY This schedule requires information on the EDB S self-assessment of the maturity of its asset management practices. Company Name AMP Planning Period Asset Management Standard Applied Network Tasman Limited 1 April March 2029 SCHEDULE 13: REPORT ON ASSET MANAGEMENT MATURITY (cont) Company Name AMP Planning Period Asset Management Standard Applied Network Tasman Limited 1 April March 2029 Question No. Function Question Score Evidence Summary User Guidance Why Who Record/documented Information 27 Asset management plan(s) The management team with overall responsibility for the asset management system. Delivery functions and suppliers. Distribution lists for plan(s). Documents derived from plan(s) which detail the receivers role in plan delivery. Evidence of communication. 29 Asset management plan(s) How has the organisation communicated its plan(s) to all relevant parties to a level of detail appropriate to the receiver's role in their delivery? How are designated responsibilities for delivery of asset plan actions documented? 3 In addition to the AMP being publically disclosed on the web, chapter 2.5 of the AMP describes the key stakeholder engagements that includes individual major customers, retailers and representative community groups such as Federate Farmers. The process of setting the SCI targets requires the 3 Chapter 2.6 of the AMP sets out the responsibilities of all NTL staff, and in particular delinates the responsibilities of the Operations Manager and the Network Manager. The Network Manager is responsible for the cost and performance outcomes of the Delta contract. Contractor GM said the AMP signals the long-term view, and on an annual basis year-ahead work is signalled about December from which work packs are compiled. Corporate Services manager clarified that the Operations Manager is responsible for the maintenance and tree trimming component of the Delta contract. Plans will be ineffective unless they are communicated to all those, including contracted suppliers and those who undertake enabling function(s). The plan(s) need to be communicated in a way that is relevant to those who need to use them. The implementation of asset management plan(s) relies on (1) actions being clearly identified, (2) an owner allocated and (3) that owner having sufficient delegated responsibility and authority to carry out the work required. It also requires alignment of actions across the organisation. This question explores how well the plan(s) set out responsibility for delivery of asset plan actions. The management team with overall responsibility for the asset management system. Operations, maintenance and engineering managers. If appropriate, the performance management team. The organisation's asset management plan(s). Documentation defining roles and responsibilities of individuals and organisational departments. 31 Asset management plan(s) What has the organisation done to ensure that appropriate arrangements are made available for the efficient and cost effective implementation of the plan(s)? (Note this is about resources and enabling support) 3 From a financial perspective, the AMP sets out 10 year forecasts which are approved by the Board. The Chief Executive has confirmed that the AMP spend forecasts are the primary driver of revenue, cashflow and pricing. Contractor GM commented that the market for good people is tight, but Nelson is an attractive location. About 10% of the workforce are trainees. It is essential that the plan(s) are realistic and can be implemented, which requires appropriate resources to be available and enabling mechanisms in place. This question explores how well this is achieved. The plan(s) not only need to consider the resources directly required and timescales, but also the enabling activities, including for example, training requirements, supply chain capability and procurement timescales. The management team with overall responsibility for the asset management system. Operations, maintenance and engineering managers. If appropriate, the performance management team. If appropriate, the performance management team. Where appropriate the procurement team and service providers working on the organisation's assetrelated activities. The organisation's asset management plan(s). Documented processes and procedures for the delivery of the asset management plan. 33 Contingency planning What plan(s) and procedure(s) does the organisation have for identifying and responding to incidents and emergency situations and ensuring continuity of critical asset management activities? Chapter 2.6 of the AMP notes that the Delta contract includes a fault response service. A comprehensive disaster response plan is set out in Appendix L of the AMP which considers an appropriate range of natural disaster and asset failure scenarios. Network manager noted that the disaster recovery plan was externally reviewed by Mitton ElectroNet, for which some recommendations for improvement were made and which have been adopted. One of those recommendarions that is being implemented is to interconnect the 66kV from Cobb to the 33kV in Nelson. Widely used AM practice standards require that an organisation has plan(s) to identify and respond to emergency situations. Emergency plan(s) should outline the actions to be taken to respond to specified emergency situations and ensure continuity of critical asset management activities including the communication to, and involvement of, external agencies. This question assesses if, and how well, these plan(s) triggered, implemented and resolved in the event of an incident. The plan(s) should be appropriate to the level of risk as determined by the organisation's risk assessment methodology. It is also a requirement that relevant personnel are competent and trained. The manager with responsibility for developing emergency plan(s). The organisation's risk assessment team. People with designated duties within the plan(s) and procedure(s) for dealing with incidents and emergency situations. The organisation's plan(s) and procedure(s) for dealing with emergencies. The organisation's risk assessments and risk registers. AMP Sch S13.AMMAT
219 Commerce Commission Information Disclosure Template SCHEDULE 13: REPORT ON ASSET MANAGEMENT MATURITY (cont) Company Name AMP Planning Period Asset Management Standard Applied Network Tasman Limited 1 April March 2029 SCHEDULE 13: REPORT ON ASSET MANAGEMENT MATURITY (cont) Company Name AMP Planning Period Asset Management Standard Applied Network Tasman Limited 1 April March 2029 Question No. Function Question Maturity Level 0 Maturity Level 1 Maturity Level 2 Maturity Level 3 Maturity Level 4 27 Asset management plan(s) The organisation does not have plan(s) or their distribution is limited to the authors. How has the organisation communicated its plan(s) to all relevant parties to a level of detail appropriate to the receiver's role in their delivery? The plan(s) are communicated to some of those responsible for delivery of the plan(s). OR Communicated to those responsible for delivery is either irregular or adhoc. The plan(s) are communicated to most of those responsible for delivery but there are weaknesses in identifying relevant parties resulting in incomplete or inappropriate communication. The organisation recognises improvement is needed as is working towards resolution. The plan(s) are communicated to all relevant employees, stakeholders and contracted service providers to a level of detail appropriate to their participation or business interests in the delivery of the plan(s) and there is confirmation that they are being used effectively. The organisation's process(es) surpass the standard required to comply with requirements set out in a recognised standard. The assessor is advised to note in the Evidence section why this is the case and the evidence seen. 29 Asset management plan(s) How are designated responsibilities for delivery of asset plan actions documented? The organisation has not documented responsibilities for delivery of asset plan actions. Asset management plan(s) inconsistently document responsibilities for delivery of plan actions and activities and/or responsibilities and authorities for implementation inadequate and/or delegation level inadequate to ensure effective delivery and/or contain misalignments with organisational accountability. Asset management plan(s) consistently document responsibilities for the delivery of actions but responsibility/authority levels are inappropriate/ inadequate, and/or there are misalignments within the organisation. Asset management plan(s) consistently document responsibilities for the delivery actions and there is adequate detail to enable delivery of actions. Designated responsibility and authority for achievement of asset plan actions is appropriate. The organisation's process(es) surpass the standard required to comply with requirements set out in a recognised standard. The assessor is advised to note in the Evidence section why this is the case and the evidence seen. 31 Asset management plan(s) What has the organisation done to ensure that appropriate arrangements are made available for the efficient and cost effective implementation of the plan(s)? (Note this is about resources and enabling support) The organisation has not considered the arrangements needed for the effective implementation of plan(s). The organisation recognises the need to ensure appropriate arrangements are in place for implementation of asset management plan(s) and is in the process of determining an appropriate approach for achieving this. The organisation has arrangements in place for the implementation of asset management plan(s) but the arrangements are not yet adequately efficient and/or effective. The organisation is working to resolve existing weaknesses. The organisation's arrangements fully cover all the requirements for the efficient and cost effective implementation of asset management plan(s) and realistically address the resources and timescales required, and any changes needed to functional policies, standards, processes and the asset management information system. The organisation's process(es) surpass the standard required to comply with requirements set out in a recognised standard. The assessor is advised to note in the Evidence section why this is the case and the evidence seen. 33 Contingency planning What plan(s) and procedure(s) does the organisation have for identifying and responding to incidents and emergency situations and ensuring continuity of critical asset management activities? The organisation has not considered the need to establish plan(s) and procedure(s) to identify and respond to incidents and emergency situations. The organisation has some ad-hoc arrangements to deal with incidents and emergency situations, but these have been developed on a reactive basis in response to specific events that have occurred in the past. Most credible incidents and emergency situations are identified. Either appropriate plan(s) and procedure(s) are incomplete for critical activities or they are inadequate. Training/ external alignment may be incomplete. Appropriate emergency plan(s) and procedure(s) are in place to respond to credible incidents and manage continuity of critical asset management activities consistent with policies and asset management objectives. Training and external agency alignment is in place. The organisation's process(es) surpass the standard required to comply with requirements set out in a recognised standard. The assessor is advised to note in the Evidence section why this is the case and the evidence seen. AMP Sch S13.AMMAT
220 Commerce Commission Information Disclosure Template SCHEDULE 13: REPORT ON ASSET MANAGEMENT MATURITY This schedule requires information on the EDB S self-assessment of the maturity of its asset management practices. Company Name AMP Planning Period Asset Management Standard Applied Network Tasman Limited 1 April March 2029 SCHEDULE 13: REPORT ON ASSET MANAGEMENT MATURITY (cont) Company Name AMP Planning Period Asset Management Standard Applied Network Tasman Limited 1 April March 2029 Question No. Function Question Score Evidence Summary User Guidance Why Who Record/documented Information 37 Structure, authority and responsibilities What has the organisation done to appoint member(s) of its management team to be responsible for ensuring that the organisation's assets deliver the requirements of the asset management strategy, objectives and plan(s)? 3 Chapter 2.6 of the AMP sets out clear responsibilities for the Operations Manager and the Network Manager. The delegated authorities set out in the AMP requires CEO approval for spend over $20,000. Network Manager commented that NTL's structure and contracting out arrangement emphasises the separation of Own, Think and Do. In order to ensure that the organisation's assets and asset systems deliver the requirements of the asset management policy, strategy and objectives responsibilities need to be allocated to appropriate people who have the necessary authority to fulfil their responsibilities. (This question, relates to the organisation's assets eg, para b), s of PAS 55, making it therefore distinct from the requirement contained in para a), s of PAS 55). Top management. People with management responsibility for the delivery of asset management policy, strategy, objectives and plan(s). People working on asset-related activities. Evidence that managers with responsibility for the delivery of asset management policy, strategy, objectives and plan(s) have been appointed and have assumed their responsibilities. Evidence may include the organisation's documents relating to its asset management system, organisational charts, job descriptions of post-holders, annual targets/objectives and personal development plan(s) of post-holders as appropriate. 40 Structure, authority and responsibilities 42 Structure, authority and responsibilities 45 Outsourcing of asset management activities What evidence can the organisation's top management provide to demonstrate that sufficient resources are available for asset management? To what degree does the organisation's top management communicate the importance of meeting its asset management requirements? Where the organisation has outsourced some of its asset management activities, how has it ensured that appropriate controls are in place to ensure the compliant delivery of its organisational strategic plan, and its asset management policy and strategy? 3 CEO confirmed that the 10 year AMP spend forecasts are the primary driver of NTL's cashflow requirements, which in turn drives pricing (within the constraints of the DPP) - it is noted operating cashflows are strong enough to fund all forecast works, eliminating the need for capital funding. Suitable land for zone 3 The importance of meeting asset management outcomes of safety, supply reliability and cost (price) are communicated in increasing detail from the Trust to the Board (via the SCI), from the Board to the CEO (via his KPI's, and through the AMP sign-off) from the CEO to the 3 NTL has Design Standards and Construction Standards in place to minimise the likely nonconformity of work. Delta understand these requirements and regularly engage with NTL to ensure conformity. Telecommunications and Metering manager commented as one outside of the electricity line services activity that asset management outcomes and performance are regularly talked about. Contractor GM confirmed that Delta observe trends and recommend changes back to NTL. Optimal asset management requires top management to ensure sufficient resources are available. In this context the term 'resources' includes manpower, materials, funding and service provider support. Widely used AM practice standards require an organisation to communicate the importance of meeting its asset management requirements such that personnel fully understand, take ownership of, and are fully engaged in the delivery of the asset management requirements (eg, PAS 55 s g). Where an organisation chooses to outsource some of its asset management activities, the organisation must ensure that these outsourced process(es) are under appropriate control to ensure that all the requirements of widely used AM standards (eg, PAS 55) are in place, and the asset management policy, strategy objectives and plan(s) are delivered. This includes ensuring capabilities and resources across a time span aligned to life cycle management. The organisation must put arrangements in place to control the outsourced activities, whether it be to external providers or to other in-house departments. This question explores what the organisation does in this regard. Top management. The management team that has overall responsibility for asset management. Risk management team. The organisation's managers involved in day-to-day supervision of asset-related activities, such as frontline managers, engineers, foremen and chargehands as appropriate. Top management. The management team that has overall responsibility for asset management. People involved in the delivery of the asset management requirements. Top management. The management team that has overall responsibility for asset management. The manager(s) responsible for the monitoring and management of the outsourced activities. People involved with the procurement of outsourced activities. The people within the organisations that are performing the outsourced activities. The people impacted by the outsourced activity. Evidence demonstrating that asset management plan(s) and/or the process(es) for asset management plan implementation consider the provision of adequate resources in both the short and long term. Resources include funding, materials, equipment, services provided by third parties and personnel (internal and service providers) with appropriate skills competencies and knowledge. Evidence of such activities as road shows, written bulletins, workshops, team talks and management walk-abouts would assist an organisation to demonstrate it is meeting this requirement of PAS 55. The organisation's arrangements that detail the compliance required of the outsourced activities. For example, this this could form part of a contract or service level agreement between the organisation and the suppliers of its outsourced activities. Evidence that the organisation has demonstrated to itself that it has assurance of compliance of outsourced activities. AMP Sch S13.AMMAT
221 Commerce Commission Information Disclosure Template SCHEDULE 13: REPORT ON ASSET MANAGEMENT MATURITY (cont) Company Name AMP Planning Period Asset Management Standard Applied Network Tasman Limited 1 April March 2029 SCHEDULE 13: REPORT ON ASSET MANAGEMENT MATURITY (cont) Company Name AMP Planning Period Asset Management Standard Applied Network Tasman Limited 1 April March 2029 Question No. Function Question Maturity Level 0 Maturity Level 1 Maturity Level 2 Maturity Level 3 Maturity Level 4 37 Structure, authority and responsibilities What has the organisation done to appoint member(s) of its management team to be responsible for ensuring that the organisation's assets deliver the requirements of the asset management strategy, objectives and plan(s)? Top management has not considered the need to appoint a person or persons to ensure that the organisation's assets deliver the requirements of the asset management strategy, objectives and plan(s). Top management understands the need to appoint a person or persons to ensure that the organisation's assets deliver the requirements of the asset management strategy, objectives and plan(s). Top management has appointed an appropriate people to ensure the assets deliver the requirements of the asset management strategy, objectives and plan(s) but their areas of responsibility are not fully defined and/or they have insufficient delegated authority to fully execute their responsibilities. The appointed person or persons have full responsibility for ensuring that the organisation's assets deliver the requirements of the asset management strategy, objectives and plan(s). They have been given the necessary authority to achieve this. The organisation's process(es) surpass the standard required to comply with requirements set out in a recognised standard. The assessor is advised to note in the Evidence section why this is the case and the evidence seen. 40 Structure, authority and responsibilities What evidence can the organisation's top management provide to demonstrate that sufficient resources are available for asset management? The organisation's top management has not considered the resources required to deliver asset management. The organisations top management understands the need for sufficient resources but there are no effective mechanisms in place to ensure this is the case. A process exists for determining what resources are required for its asset management activities and in most cases these are available but in some instances resources remain insufficient. An effective process exists for determining the resources needed for asset management and sufficient resources are available. It can be demonstrated that resources are matched to asset management requirements. The organisation's process(es) surpass the standard required to comply with requirements set out in a recognised standard. The assessor is advised to note in the Evidence section why this is the case and the evidence seen. 42 Structure, authority and responsibilities To what degree does the organisation's top management communicate the importance of meeting its asset management requirements? The organisation's top management has not considered the need to communicate the importance of meeting asset management requirements. The organisations top management understands the need to communicate the importance of meeting its asset management requirements but does not do so. Top management communicates the importance of meeting its asset management requirements but only to parts of the organisation. Top management communicates the importance of meeting its asset management requirements to all relevant parts of the organisation. The organisation's process(es) surpass the standard required to comply with requirements set out in a recognised standard. The assessor is advised to note in the Evidence section why this is the case and the evidence seen. 45 Outsourcing of asset management activities Where the organisation has outsourced some of its asset management activities, how has it ensured that appropriate controls are in place to ensure the compliant delivery of its organisational strategic plan, and its asset management policy and strategy? The organisation has not considered the need to put controls in place. The organisation controls its outsourced activities on an ad-hoc basis, with little regard for ensuring for the compliant delivery of the organisational strategic plan and/or its asset management policy and strategy. Controls systematically considered but currently only provide for the compliant delivery of some, but not all, aspects of the organisational strategic plan and/or its asset management policy and strategy. Gaps exist. Evidence exists to demonstrate that outsourced activities are appropriately controlled to provide for the compliant delivery of the organisational strategic plan, asset management policy and strategy, and that these controls are integrated into the asset management system The organisation's process(es) surpass the standard required to comply with requirements set out in a recognised standard. The assessor is advised to note in the Evidence section why this is the case and the evidence seen. AMP Sch S13.AMMAT
222 Commerce Commission Information Disclosure Template SCHEDULE 13: REPORT ON ASSET MANAGEMENT MATURITY This schedule requires information on the EDB S self-assessment of the maturity of its asset management practices. Company Name AMP Planning Period Asset Management Standard Applied Network Tasman Limited 1 April March 2029 SCHEDULE 13: REPORT ON ASSET MANAGEMENT MATURITY (cont) Company Name AMP Planning Period Asset Management Standard Applied Network Tasman Limited 1 April March 2029 Question No. Function Question Score Evidence Summary User Guidance Why Who Record/documented Information 48 Training, awareness and competence How does the organisation develop plan(s) for the human resources required to undertake asset management activities - including the development and delivery of asset management strategy, process(es), objectives and plan(s)? 2 Network manager confirmed that recruitment and development is driven by the AMP forecast work volumes and competencies eg. an aging cable fleet will require more cable jointers, NTL's planned replacement of copper conductor requires additional staff. Delta are recruiting based on NTL's forecasts. There is a need for an organisation to demonstrate that it has considered what resources are required to develop and implement its asset management system. There is also a need for the organisation to demonstrate that it has assessed what development plan(s) are required to provide its human resources with the skills and competencies to develop and implement its asset management systems. The timescales over which the plan(s) are relevant should be commensurate with the planning horizons within the asset management strategy considers e.g. if the asset management strategy considers 5, 10 and 15 year time scales then the human resources development plan(s) should align with these. Resources include both 'in house' and external resources who undertake asset management activities. Senior management responsible for agreement of plan(s). Managers responsible for developing asset management strategy and plan(s). Managers with responsibility for development and recruitment of staff (including HR functions). Staff responsible for training. Procurement officers. Contracted service providers. Evidence of analysis of future work load plan(s) in terms of human resources. Document(s) containing analysis of the organisation's own direct resources and contractors resource capability over suitable timescales. Evidence, such as minutes of meetings, that suitable management forums are monitoring human resource development plan(s). Training plan(s), personal development plan(s), contract and service level agreements. 49 Training, awareness and competence How does the organisation identify competency requirements and then plan, provide and record the training necessary to achieve the competencies? 3 Contractor GM confirmed that competencies tend to be driven by EDB's choice of assets, and contractors need to demonstrate those competencies. It was confirmed that almost all NTL work fits within Delta's competencies. Widely used AM standards require that organisations to undertake a systematic identification of the asset management awareness and competencies required at each level and function within the organisation. Once identified the training required to provide the necessary competencies should be planned for delivery in a timely and systematic way. Any training provided must be recorded and maintained in a suitable format. Where an organisation has contracted service providers in place then it should have a means to demonstrate that this requirement is being met for their employees. (eg, PAS 55 refers to frameworks suitable for identifying competency requirements). Senior management responsible for agreement of plan(s). Managers responsible for developing asset management strategy and plan(s). Managers with responsibility for development and recruitment of staff (including HR functions). Staff responsible for training. Procurement officers. Contracted service providers. Evidence of an established and applied competency requirements assessment process and plan(s) in place to deliver the required training. Evidence that the training programme is part of a wider, coordinated asset management activities training and competency programme. Evidence that training activities are recorded and that records are readily available (for both direct and contracted service provider staff) e.g. via organisation wide information system or local records database. AMP Sch S13.AMMAT
223 Commerce Commission Information Disclosure Template SCHEDULE 13: REPORT ON ASSET MANAGEMENT MATURITY This schedule requires information on the EDB S self-assessment of the maturity of its asset management practices. Company Name AMP Planning Period Asset Management Standard Applied Network Tasman Limited 1 April March Training, awareness and competence How does the organization ensure that persons under its direct control undertaking asset management related activities have an appropriate level of competence in terms of education, training or experience? Contractor GM confirmed that Delta's HR strategy follows EDB's requirements, including 10% as trainees. In particular safety is systematically managed to a very high level. A critical success factor for the effective development and implementation of an asset management system is the competence of persons undertaking these activities. organisations should have effective means in place for ensuring the competence of employees to carry out their designated asset management function(s). Where an organisation has contracted service providers undertaking elements of its asset management system then the organisation shall assure itself that the outsourced service provider also has suitable arrangements in place to manage the competencies of its employees. The organisation should ensure that the individual and corporate competencies it requires are in place and actively monitor, develop and maintain an appropriate balance of these competencies. Managers, supervisors, persons responsible for developing training programmes. Staff responsible for procurement and service agreements. HR staff and those responsible for recruitment. Evidence of a competency assessment framework that aligns with established frameworks such as the asset management Competencies Requirements Framework (Version 2.0); National Occupational Standards for Management and Leadership; UK Standard for Professional Engineering Competence, Engineering Council, AMP Sch S13.AMMAT
224 Commerce Commission Information Disclosure Template SCHEDULE 13: REPORT ON ASSET MANAGEMENT MATURITY (cont) Company Name AMP Planning Period Asset Management Standard Applied Network Tasman Limited 1 April March 2029 SCHEDULE 13: REPORT ON ASSET MANAGEMENT MATURITY (cont) Company Name AMP Planning Period Asset Management Standard Applied Network Tasman Limited 1 April March 2029 Question No. Function Question Maturity Level 0 Maturity Level 1 Maturity Level 2 Maturity Level 3 Maturity Level 4 48 Training, awareness and competence How does the organisation develop plan(s) for the human resources required to undertake asset management activities - including the development and delivery of asset management strategy, process(es), objectives and plan(s)? The organisation has not recognised the need for assessing human resources requirements to develop and implement its asset management system. The organisation has recognised the need to assess its human resources requirements and to develop a plan(s). There is limited recognition of the need to align these with the development and implementation of its asset management system. The organisation has developed a strategic approach to aligning competencies and human resources to the asset management system including the asset management plan but the work is incomplete or has not been consistently implemented. The organisation can demonstrate that plan(s) are in place and effective in matching competencies and capabilities to the asset management system including the plan for both internal and contracted activities. Plans are reviewed integral to asset management system process(es). The organisation's process(es) surpass the standard required to comply with requirements set out in a recognised standard. The assessor is advised to note in the Evidence section why this is the case and the evidence seen. 49 Training, awareness and competence How does the organisation identify competency requirements and then plan, provide and record the training necessary to achieve the competencies? The organisation does not have any means in place to identify competency requirements. The organisation has recognised the need to identify competency requirements and then plan, provide and record the training necessary to achieve the competencies. The organisation is the process of identifying competency requirements aligned to the asset management plan(s) and then plan, provide and record appropriate training. It is incomplete or inconsistently applied. Competency requirements are in place and aligned with asset management plan(s). Plans are in place and effective in providing the training necessary to achieve the competencies. A structured means of recording the competencies achieved is in place. The organisation's process(es) surpass the standard required to comply with requirements set out in a recognised standard. The assessor is advised to note in the Evidence section why this is the case and the evidence seen. AMP Sch S13.AMMAT
225 Commerce Commission Information Disclosure Template SCHEDULE 13: REPORT ON ASSET MANAGEMENT MATURITY (cont) Company Name AMP Planning Period Asset Management Standard Applied Network Tasman Limited 1 April March Training, awareness and competence How does the organization ensure that persons under its direct control undertaking asset management related activities have an appropriate level of competence in terms of education, training or experience? The organization has not recognised the need to assess the competence of person(s) undertaking asset management related activities. Competency of staff undertaking asset management related activities is not managed or assessed in a structured way, other than formal requirements for legal compliance and safety management. The organization is in the process of putting in place a means for assessing the competence of person(s) involved in asset management activities including contractors. There are gaps and inconsistencies. Competency requirements are identified and assessed for all persons carrying out asset management related activities - internal and contracted. Requirements are reviewed and staff reassessed at appropriate intervals aligned to asset management requirements. The organisation's process(es) surpass the standard required to comply with requirements set out in a recognised standard. The assessor is advised to note in the Evidence section why this is the case and the evidence seen. AMP Sch S13.AMMAT
226 Commerce Commission Information Disclosure Template SCHEDULE 13: REPORT ON ASSET MANAGEMENT MATURITY This schedule requires information on the EDB S self-assessment of the maturity of its asset management practices. Company Name AMP Planning Period Asset Management Standard Applied Network Tasman Limited 1 April March 2029 SCHEDULE 13: REPORT ON ASSET MANAGEMENT MATURITY (cont) Company Name AMP Planning Period Asset Management Standard Applied Network Tasman Limited 1 April March 2029 Question No. Function Question Score Evidence Summary User Guidance Why Who Record/documented Information 53 Communication, participation and consultation How does the organisation ensure that pertinent asset management information is effectively communicated to and from employees and other stakeholders, including contracted service providers? 3 In addition to the AMP formally communicating conceptual asset management requirements, AM information is also informally commuicated by various means that range from asset condition inspections through to meetings with Delta. The Network Manager also meets with Delta to ensure that the Contract is meeting agreed performance and cost targets. Contractor GM confirmed that the AMP and annual work plans are used to communicate longterm trends and annual work volumes to Delta. Murray added that larger projects are signalled to both Delta and to other contractors thru the AMP being available. Widely used AM practice standards require that pertinent asset management information is effectively communicated to and from employees and other stakeholders including contracted service providers. Pertinent information refers to information required in order to effectively and efficiently comply with and deliver asset management strategy, plan(s) and objectives. This will include for example the communication of the asset management policy, asset performance information, and planning information as appropriate to contractors. Top management and senior management representative(s), employee's representative(s), employee's trade union representative(s); contracted service provider management and employee representative(s); representative(s) from the organisation's Health, Safety and Environmental team. Key stakeholder representative(s). Asset management policy statement prominently displayed on notice boards, intranet and internet; use of organisation's website for displaying asset performance data; evidence of formal briefings to employees, stakeholders and contracted service providers; evidence of inclusion of asset management issues in team meetings and contracted service provider contract meetings; newsletters, etc. 59 Asset Management System documentation What documentation has the organisation established to describe the main elements of its asset management system and interactions between them? 2 Chapter 1.4 of the AMP summarises NTL's main information repositories, whilst Figure 3 at chapter 2.10 shows how these repositories feed into the maintenance and renewals plan, the development plan and ultimately the AMP. Widely used AM practice standards require an organisation maintain up to date documentation that ensures that its asset management systems (ie, the systems the organisation has in place to meet the standards) can be understood, communicated and operated. (eg, s 4.5 of PAS 55 requires the maintenance of up to date documentation of the asset management system requirements specified throughout s 4 of PAS 55). The management team that has overall responsibility for asset management. Managers engaged in asset management activities. The documented information describing the main elements of the asset management system (process(es)) and their interaction. 62 Information management What has the organisation done to determine what its asset management information system(s) should contain in order to support its asset management system? 3 Network manager confirmed that failure modes of individual asset categories (eg. copper conductor vibration and annealling) are a key driver of the classes of asset information captured and stored. Effective asset management requires appropriate information to be available. Widely used AM standards therefore require the organisation to identify the asset management information it requires in order to support its asset management system. Some of the information required may be held by suppliers. The organisation's strategic planning team. The management team that has overall responsibility for asset management. Information management team. Operations, maintenance and engineering managers Details of the process the organisation has employed to determine what its asset information system should contain in order to support its asset management system. Evidence that this has been effectively implemented. The maintenance and development of asset management information systems is a poorly understood specialist activity that is akin to IT management but different from IT management. This group of questions provides some indications as to whether the capability is available and applied. Note: To be effective, an asset information management system requires the mobilisation of technology, people and process(es) that create, secure, make available and destroy the information required to support the asset management system. AMP Sch S13.AMMAT
227 Commerce Commission Information Disclosure Template SCHEDULE 13: REPORT ON ASSET MANAGEMENT MATURITY This schedule requires information on the EDB S self-assessment of the maturity of its asset management practices. Company Name AMP Planning Period Asset Management Standard Applied Network Tasman Limited 1 April March Information management How does the organisation maintain its asset management information system(s) and ensure that the data held within it (them) is of the requisite quality and accuracy and is consistent? 3 Network manager indicated that the core is asset condition databased derived from network inspections. The key measure of the quality of asset condition inspection data is the reconciling of internal condition of removed assets with the decision to renew. Feedback mechanisms exist to inspect removed components to The response to the questions is progressive. A higher scale cannot be awarded without achieving the requirements of the lower scale. This question explores how the organisation ensures that information management meets widely used AM practice requirements (eg, s (a), (c) and (d) of PAS 55). The management team that has overall responsibility for asset management. Users of the organisational information systems. The asset management information system, together with the policies, procedure(s), improvement initiatives and audits regarding information controls. AMP Sch S13.AMMAT
228 Commerce Commission Information Disclosure Template SCHEDULE 13: REPORT ON ASSET MANAGEMENT MATURITY (cont) Company Name AMP Planning Period Asset Management Standard Applied Network Tasman Limited 1 April March 2029 SCHEDULE 13: REPORT ON ASSET MANAGEMENT MATURITY (cont) Company Name AMP Planning Period Asset Management Standard Applied Network Tasman Limited 1 April March 2029 Question No. Function Question Maturity Level 0 Maturity Level 1 Maturity Level 2 Maturity Level 3 Maturity Level 4 53 Communication, participation and consultation The organisation has not recognised the need to formally communicate any asset management information. How does the organisation ensure that pertinent asset management information is effectively communicated to and from employees and other stakeholders, including contracted service providers? There is evidence that the pertinent asset management information to be shared along with those to share it with is being determined. The organisation has determined pertinent information and relevant parties. Some effective two way communication is in place but as yet not all relevant parties are clear on their roles and responsibilities with respect to asset management information. Two way communication is in place between all relevant parties, ensuring that information is effectively communicated to match the requirements of asset management strategy, plan(s) and process(es). Pertinent asset information requirements are regularly reviewed. The organisation's process(es) surpass the standard required to comply with requirements set out in a recognised standard. The assessor is advised to note in the Evidence section why this is the case and the evidence seen. 59 Asset Management System documentation What documentation has the organisation established to describe the main elements of its asset management system and interactions between them? The organisation has not established documentation that describes the main elements of the asset management system. The organisation is aware of the need to put documentation in place and is in the process of determining how to document the main elements of its asset management system. The organisation in the process of documenting its asset management system and has documentation in place that describes some, but not all, of the main elements of its asset management system and their interaction. The organisation has established documentation that comprehensively describes all the main elements of its asset management system and the interactions between them. The documentation is kept up to date. The organisation's process(es) surpass the standard required to comply with requirements set out in a recognised standard. The assessor is advised to note in the Evidence section why this is the case and the evidence seen. 62 Information management What has the organisation done to determine what its asset management information system(s) should contain in order to support its asset management system? The organisation has not considered what asset management information is required. The organisation is aware of the need to determine in a structured manner what its asset information system should contain in order to support its asset management system and is in the process of deciding how to do this. The organisation has developed a structured process to determine what its asset information system should contain in order to support its asset management system and has commenced implementation of the process. The organisation has determined what its asset information system should contain in order to support its asset management system. The requirements relate to the whole life cycle and cover information originating from both internal and external sources. The organisation's process(es) surpass the standard required to comply with requirements set out in a recognised standard. The assessor is advised to note in the Evidence section why this is the case and the evidence seen. AMP Sch S13.AMMAT
229 Commerce Commission Information Disclosure Template SCHEDULE 13: REPORT ON ASSET MANAGEMENT MATURITY (cont) Company Name AMP Planning Period Asset Management Standard Applied Network Tasman Limited 1 April March Information management How does the organisation maintain its asset management information system(s) and ensure that the data held within it (them) is of the requisite quality and accuracy and is consistent? There are no formal controls in place or controls are extremely limited in scope and/or effectiveness. The organisation is aware of the need for effective controls and is in the process of developing an appropriate control process(es). The organisation has developed a controls that will ensure the data held is of the requisite quality and accuracy and is consistent and is in the process of implementing them. The organisation has effective controls in place that ensure the data held is of the requisite quality and accuracy and is consistent. The controls are regularly reviewed and improved where necessary. The organisation's process(es) surpass the standard required to comply with requirements set out in a recognised standard. The assessor is advised to note in the Evidence section why this is the case and the evidence seen. AMP Sch S13.AMMAT
230 Commerce Commission Information Disclosure Template SCHEDULE 13: REPORT ON ASSET MANAGEMENT MATURITY This schedule requires information on the EDB S self-assessment of the maturity of its asset management practices. Company Name AMP Planning Period Asset Management Standard Applied Network Tasman Limited 1 April March 2029 SCHEDULE 13: REPORT ON ASSET MANAGEMENT MATURITY (cont) Company Name AMP Planning Period Asset Management Standard Applied Network Tasman Limited 1 April March 2029 Question No. Function Question Score Evidence Summary User Guidance Why Who Record/documented Information 64 Information management How has the organisation's ensured its asset management information system is relevant to its needs? 3 The primary evidence that the AM system set out in chapter 2.10 of the AMP is adequate and relevant to NTL's needs is the safe and reliable operation of the network as evidenced by a range of recurring and one-off inspection activities. Network manager also confirmed that the asset condition information requirements are linked to condition drivers and failure modes, citing the recent concrete pole report compiled by the Univesity of Canterbury. Widely used AM standards need not be prescriptive about the form of the asset management information system, but simply require that the asset management information system is appropriate to the organisations needs, can be effectively used and can supply information which is consistent and of the requisite quality and accuracy. The organisation's strategic planning team. The management team that has overall responsibility for asset management. Information management team. Users of the organisational information systems. The documented process the organisation employs to ensure its asset management information system aligns with its asset management requirements. Minutes of information systems review meetings involving users. 69 Risk management process(es) 79 Use and maintenance of asset risk information How has the organisation documented process(es) and/or procedure(s) for the identification and assessment of asset and asset management related risks throughout the asset life cycle? How does the organisation ensure that the results of risk assessments provide input into the identification of adequate resources and training and competency needs? 2 NTL addresses risk through the asset lifecyle primarily by using Design Standards and Construction Standards to minimse non-conformance at the start of the assets life, and then uses various inspection methods to assess asset condition through its life. These inspections inform the maintenance and renewals plan (chapter 2.10 of the AMP). There are slso several external overlays to NTL's own lifecylce risk management which include the PSMS audit, inspection of 3 Network manager confirmed that various feedback loops are in place to optimise the risk of in-service failure. Risk management is an important foundation for proactive asset management. Its overall purpose is to understand the cause, effect and likelihood of adverse events occurring, to optimally manage such risks to an acceptable level, and to provide an audit trail for the management of risks. Widely used standards require the organisation to have process(es) and/or procedure(s) in place that set out how the organisation identifies and assesses asset and asset management related risks. The risks have to be considered across the four phases of the asset lifecycle (eg, para of PAS 55). Widely used AM standards require that the output from risk assessments are considered and that adequate resource (including staff) and training is identified to match the requirements. It is a further requirement that the effects of the control measures are considered, as there may be implications in resources and training required to achieve other objectives. The top management team in conjunction with the organisation's senior risk management representatives. There may also be input from the organisation's Safety, Health and Environment team. Staff who carry out risk identification and assessment. Staff responsible for risk assessment and those responsible for developing and approving resource and training plan(s). There may also be input from the organisation's Safety, Health and Environment team. The organisation's risk management framework and/or evidence of specific process(es) and/ or procedure(s) that deal with risk control mechanisms. Evidence that the process(es) and/or procedure(s) are implemented across the business and maintained. Evidence of agendas and minutes from risk management meetings. Evidence of feedback in to process(es) and/or procedure(s) as a result of incident investigation(s). Risk registers and assessments. The organisations risk management framework. The organisation's resourcing plan(s) and training and competency plan(s). The organisation should be able to demonstrate appropriate linkages between the content of resource plan(s) and training and competency plan(s) to the risk assessments and risk control measures that have been developed. 82 Legal and other requirements What procedure does the organisation have to identify and provide access to its legal, regulatory, statutory and other asset management requirements, and how is requirements incorporated into the asset management system? 3 NTL uses a wide range of activities to ensure compliance and best practice, including subscribing to bulletins and journals, attending conferences, seeking external advice and assurance etc. These are incorporated into the AM system as process changes, including additional inspections or audits, amending thresholds or targets, over-writing previous data etc. Corporate Services manager confirmed that he does a legislative compliance confirmation every 6 months that is reported to the Audit & Risk Committee. In order for an organisation to comply with its legal, regulatory, statutory and other asset management requirements, the organisation first needs to ensure that it knows what they are (eg, PAS 55 specifies this in s 4.4.8). It is necessary to have systematic and auditable mechanisms in place to identify new and changing requirements. Widely used AM standards also require that requirements are incorporated into the asset management system (e.g. procedure(s) and process(es)) Top management. The organisations regulatory team. The organisation's legal team or advisors. The management team with overall responsibility for the asset management system. The organisation's health and safety team or advisors. The organisation's policy making team. The organisational processes and procedures for ensuring information of this type is identified, made accessible to those requiring the information and is incorporated into asset management strategy and objectives AMP Sch S13.AMMAT
231 Commerce Commission Information Disclosure Template SCHEDULE 13: REPORT ON ASSET MANAGEMENT MATURITY (cont) Company Name AMP Planning Period Asset Management Standard Applied Network Tasman Limited 1 April March 2029 SCHEDULE 13: REPORT ON ASSET MANAGEMENT MATURITY (cont) Company Name AMP Planning Period Asset Management Standard Applied Network Tasman Limited 1 April March 2029 Question No. Function Question Maturity Level 0 Maturity Level 1 Maturity Level 2 Maturity Level 3 Maturity Level 4 64 Information management How has the organisation's ensured its asset management information system is relevant to its needs? The organisation has not considered the need to determine the relevance of its management information system. At present there are major gaps between what the information system provides and the organisations needs. The organisation understands the need to ensure its asset management information system is relevant to its needs and is determining an appropriate means by which it will achieve this. At present there are significant gaps between what the information system provides and the organisations needs. The organisation has developed and is implementing a process to ensure its asset management information system is relevant to its needs. Gaps between what the information system provides and the organisations needs have been identified and action is being taken to close them. The organisation's asset management information system aligns with its asset management requirements. Users can confirm that it is relevant to their needs. The organisation's process(es) surpass the standard required to comply with requirements set out in a recognised standard. The assessor is advised to note in the Evidence section why this is the case and the evidence seen. 69 Risk management process(es) How has the organisation documented process(es) and/or procedure(s) for the identification and assessment of asset and asset management related risks throughout the asset life cycle? The organisation has not considered the need to document process(es) and/or procedure(s) for the identification and assessment of asset and asset management related risks throughout the asset life cycle. The organisation is aware of the need to document the management of asset related risk across the asset lifecycle. The organisation has plan(s) to formally document all relevant process(es) and procedure(s) or has already commenced this activity. The organisation is in the process of documenting the identification and assessment of asset related risk across the asset lifecycle but it is incomplete or there are inconsistencies between approaches and a lack of integration. Identification and assessment of asset related risk across the asset lifecycle is fully documented. The organisation can demonstrate that appropriate documented mechanisms are integrated across life cycle phases and are being consistently applied. The organisation's process(es) surpass the standard required to comply with requirements set out in a recognised standard. The assessor is advised to note in the Evidence section why this is the case and the evidence seen. 79 Use and maintenance of asset risk information How does the organisation ensure that the results of risk assessments provide input into the identification of adequate resources and training and competency needs? The organisation has not considered the need to conduct risk assessments. The organisation is aware of the need to consider the results of risk assessments and effects of risk control measures to provide input into reviews of resources, training and competency needs. Current input is typically adhoc and reactive. The organisation is in the process ensuring that outputs of risk assessment are included in developing requirements for resources and training. The implementation is incomplete and there are gaps and inconsistencies. Outputs from risk assessments are consistently and systematically used as inputs to develop resources, training and competency requirements. Examples and evidence is available. The organisation's process(es) surpass the standard required to comply with requirements set out in a recognised standard. The assessor is advised to note in the Evidence section why this is the case and the evidence seen. 82 Legal and other requirements What procedure does the organisation have to identify and provide access to its legal, regulatory, statutory and other asset management requirements, and how is requirements incorporated into the asset management system? The organisation has not considered the need to identify its legal, regulatory, statutory and other asset management requirements. The organisation identifies some its legal, regulatory, statutory and other asset management requirements, but this is done in an ad-hoc manner in the absence of a procedure. The organisation has procedure(s) to identify its legal, regulatory, statutory and other asset management requirements, but the information is not kept up to date, inadequate or inconsistently managed. Evidence exists to demonstrate that the organisation's legal, regulatory, statutory and other asset management requirements are identified and kept up to date. Systematic mechanisms for identifying relevant legal and statutory requirements. The organisation's process(es) surpass the standard required to comply with requirements set out in a recognised standard. The assessor is advised to note in the Evidence section why this is the case and the evidence seen. AMP Sch S13.AMMAT
232 Commerce Commission Information Disclosure Template SCHEDULE 13: REPORT ON ASSET MANAGEMENT MATURITY This schedule requires information on the EDB S self-assessment of the maturity of its asset management practices. Company Name AMP Planning Period Asset Management Standard Applied Network Tasman Limited 1 April March 2029 SCHEDULE 13: REPORT ON ASSET MANAGEMENT MATURITY (cont) Company Name AMP Planning Period Asset Management Standard Applied Network Tasman Limited 1 April March 2029 Question No. Function Question Score Evidence Summary User Guidance Why Who Record/documented Information 88 Life Cycle Activities 91 Life Cycle Activities 95 Performance and condition monitoring How does the organisation establish implement and maintain process(es) for the implementation of its asset management plan(s) and control of activities across the creation, acquisition or enhancement of assets. This includes design, modification, procurement, construction and commissioning activities? How does the organisation ensure that process(es) and/or procedure(s) for the implementation of asset management plan(s) and control of activities during maintenance (and inspection) of assets are sufficient to ensure activities are carried out under specified conditions, are consistent with asset management strategy and control cost, risk and performance? How does the organisation measure the performance and condition of its assets? 3 Quality control along the asset lifecycle is firstly established through the Design Standards, the Construction Standards, and the Material Specifications. This may include NTL reviewing design work performed by extrnal parties. The next step include postconstruction inspection of completed works as part of the Delta sign-off and payment process. Chapter 6.6 of the AMP sets out the 3 The on-going safety and reliability of the network is the primary criteria that NTL uses to asses the robustnenss of its AM practices (ie. calibrating the required inputs to the rerquired output). Various assessments of safety and reliability including the external audit of the PSMS, post-construction inspection of works, routine condition inspections, external inspection by Network Compliance, and the one-off Mitton ElectroNet inspection all 3 NTL starts measuring the performance of its assets on an ex-ante basis by requiring adherence to Design Standards, Construction Standards and Material Specifications followed by post-contruction inpsection (as part of the Delta sign-off and payment process). Once commissioned, assets are subject to on-going inspections by prescribed methods to detect deteriorating condition, which feeds into the maintenance and renewal planning process. Assessment of asset condition over many Contractor GM commented that Delta has a QSE person in Nelson for the NTL contract. Life cycle activities are about the implementation of asset management plan(s) i.e. they are the "doing" phase. They need to be done effectively and well in order for asset management to have any practical meaning. As a consequence, widely used standards (eg, PAS 55 s 4.5.1) require organisations to have in place appropriate process(es) and procedure(s) for the implementation of asset management plan(s) and control of lifecycle activities. This question explores those aspects relevant to asset creation. Having documented process(es) which ensure the asset management plan(s) are implemented in accordance with any specified conditions, in a manner consistent with the asset management policy, strategy and objectives and in such a way that cost, risk and asset system performance are appropriately controlled is critical. They are an essential part of turning intention into action (eg, as required by PAS 55 s 4.5.1). Widely used AM standards require that organisations establish implement and maintain procedure(s) to monitor and measure the performance and/or condition of assets and asset systems. They further set out requirements in some detail for reactive and proactive monitoring, and leading/lagging performance indicators together with the monitoring or results to provide input to corrective actions and continual improvement. There is an expectation that performance and condition monitoring will provide input to improving asset management strategy, objectives and plan(s). Asset managers, design staff, construction staff and project managers from other impacted areas of the business, e.g. Procurement Documented process(es) and procedure(s) which are relevant to demonstrating the effective management and control of life cycle activities during asset creation, acquisition, enhancement including design, modification, procurement, construction and commissioning. Asset managers, operations managers, maintenance Documented procedure for review. Documented managers and project managers from other impacted procedure for audit of process delivery. Records of areas of the business previous audits, improvement actions and documented confirmation that actions have been carried out. A broad cross-section of the people involved in the organisation's asset-related activities from data input to decision-makers, i.e. an end-to end assessment. This should include contactors and other relevant third parties as appropriate. Functional policy and/or strategy documents for performance or condition monitoring and measurement. The organisation's performance monitoring frameworks, balanced scorecards etc. Evidence of the reviews of any appropriate performance indicators and the action lists resulting from these reviews. Reports and trend analysis using performance and condition information. Evidence of the use of performance and condition information shaping improvements and supporting asset management strategy, objectives and plan(s). AMP Sch S13.AMMAT
233 Commerce Commission Information Disclosure Template SCHEDULE 13: REPORT ON ASSET MANAGEMENT MATURITY This schedule requires information on the EDB S self-assessment of the maturity of its asset management practices. Company Name AMP Planning Period Asset Management Standard Applied Network Tasman Limited 1 April March Investigation of asset-related failures, incidents and nonconformities How does the organisation ensure responsibility and the authority for the handling, investigation and mitigation of asset-related failures, incidents and emergency situations and non conformances is clear, unambiguous, understood and communicated? 3 Network manager said that failures tend to come through Ops manager, and him and Network manager investigate the failure and its wider implications and trends eg. ABS's being refurbished with different insulators. Widely used AM standards require that the The organisation's safety and environment organisation establishes implements and maintains management team. The team with overall process(es) for the handling and investigation of responsibility for the management of the assets. failures incidents and non-conformities for assets and People who have appointed roles within the assetrelated investigation procedure, from those who sets down a number of expectations. Specifically this question examines the requirement to define clearly carry out the investigations to senior management responsibilities and authorities for these activities, who review the recommendations. Operational and communicate these unambiguously to relevant controllers responsible for managing the asset base people including external stakeholders if appropriate. under fault conditions and maintaining services to consumers. Contractors and other third parties as appropriate. Process(es) and procedure(s) for the handling, investigation and mitigation of asset-related failures, incidents and emergency situations and non conformances. Documentation of assigned responsibilities and authority to employees. Job Descriptions, Audit reports. Common communication systems i.e. all Job Descriptions on Internet etc. AMP Sch S13.AMMAT
234 Commerce Commission Information Disclosure Template SCHEDULE 13: REPORT ON ASSET MANAGEMENT MATURITY (cont) Company Name AMP Planning Period Asset Management Standard Applied Network Tasman Limited 1 April March 2029 SCHEDULE 13: REPORT ON ASSET MANAGEMENT MATURITY (cont) Company Name AMP Planning Period Asset Management Standard Applied Network Tasman Limited 1 April March 2029 Question No. Function Question Maturity Level 0 Maturity Level 1 Maturity Level 2 Maturity Level 3 Maturity Level 4 88 Life Cycle Activities How does the organisation establish implement and maintain process(es) for the implementation of its asset management plan(s) and control of activities across the creation, acquisition or enhancement of assets. This includes design, modification, procurement, construction and commissioning activities? The organisation does not have process(es) in place to manage and control the implementation of asset management plan(s) during activities related to asset creation including design, modification, procurement, construction and commissioning. The organisation is aware of the need to have process(es) and procedure(s) in place to manage and control the implementation of asset management plan(s) during activities related to asset creation including design, modification, procurement, construction and commissioning but currently do not have these in place (note: procedure(s) may exist but they are inconsistent/incomplete). The organisation is in the process of putting in place process(es) and procedure(s) to manage and control the implementation of asset management plan(s) during activities related to asset creation including design, modification, procurement, construction and commissioning. Gaps and inconsistencies are being addressed. Effective process(es) and procedure(s) are in place to manage and control the implementation of asset management plan(s) during activities related to asset creation including design, modification, procurement, construction and commissioning. The organisation's process(es) surpass the standard required to comply with requirements set out in a recognised standard. The assessor is advised to note in the Evidence section why this is the case and the evidence seen. 91 Life Cycle Activities How does the organisation ensure that process(es) and/or procedure(s) for the implementation of asset management plan(s) and control of activities during maintenance (and inspection) of assets are sufficient to ensure activities are carried out under specified conditions, are consistent with asset management strategy and control cost, risk and performance? The organisation does not have process(es)/procedure(s) in place to control or manage the implementation of asset management plan(s) during this life cycle phase. The organisation is aware of the need to have process(es) and procedure(s) in place to manage and control the implementation of asset management plan(s) during this life cycle phase but currently do not have these in place and/or there is no mechanism for confirming they are effective and where needed modifying them. The organisation is in the process of putting in place process(es) and procedure(s) to manage and control the implementation of asset management plan(s) during this life cycle phase. They include a process for confirming the process(es)/procedure(s) are effective and if necessary carrying out modifications. The organisation has in place process(es) and procedure(s) to manage and control the implementation of asset management plan(s) during this life cycle phase. They include a process, which is itself regularly reviewed to ensure it is effective, for confirming the process(es)/ procedure(s) are effective and if necessary carrying out modifications. The organisation's process(es) surpass the standard required to comply with requirements set out in a recognised standard. The assessor is advised to note in the Evidence section why this is the case and the evidence seen. 95 Performance and condition monitoring How does the organisation measure the performance and condition of its assets? The organisation has not considered how to monitor the performance and condition of its assets. The organisation recognises the need for monitoring asset performance but has not developed a coherent approach. Measures are incomplete, predominantly reactive and lagging. There is no linkage to asset management objectives. The organisation is developing coherent asset performance monitoring linked to asset management objectives. Reactive and proactive measures are in place. Use is being made of leading indicators and analysis. Gaps and inconsistencies remain. Consistent asset performance monitoring linked to asset management objectives is in place and universally used including reactive and proactive measures. Data quality management and review process are appropriate. Evidence of leading indicators and analysis. The organisation's process(es) surpass the standard required to comply with requirements set out in a recognised standard. The assessor is advised to note in the Evidence section why this is the case and the evidence seen. AMP Sch S13.AMMAT
235 Commerce Commission Information Disclosure Template SCHEDULE 13: REPORT ON ASSET MANAGEMENT MATURITY (cont) Company Name AMP Planning Period Asset Management Standard Applied Network Tasman Limited 1 April March Investigation of asset-related failures, incidents and nonconformities How does the organisation ensure responsibility and the authority for the handling, investigation and mitigation of asset-related failures, incidents and emergency situations and non conformances is clear, unambiguous, understood and communicated? The organisation has not considered the need to define the appropriate responsibilities and the authorities. The organisation understands the requirements and is in the process of determining how to define them. The organisation are in the process of defining the responsibilities and authorities with evidence. Alternatively there are some gaps or inconsistencies in the identified responsibilities/authorities. The organisation have defined the appropriate responsibilities and authorities and evidence is available to show that these are applied across the business and kept up to date. The organisation's process(es) surpass the standard required to comply with requirements set out in a recognised standard. The assessor is advised to note in the Evidence section why this is the case and the evidence seen. AMP Sch S13.AMMAT
236 Commerce Commission Information Disclosure Template SCHEDULE 13: REPORT ON ASSET MANAGEMENT MATURITY This schedule requires information on the EDB S self-assessment of the maturity of its asset management practices. Company Name AMP Planning Period Asset Management Standard Applied Network Tasman Limited 1 April March 2029 SCHEDULE 13: REPORT ON ASSET MANAGEMENT MATURITY (cont) Company Name AMP Planning Period Asset Management Standard Applied Network Tasman Limited 1 April March 2029 Question No. Function Question Score Evidence Summary User Guidance Why Who Record/documented Information 105 Audit What has the organisation done to establish procedure(s) for the audit of its asset management system (process(es))? This question seeks to explore what the organisation has done to comply with the standard practice AM audit requirements (eg, the associated requirements of PAS 55 s and its linkages to s 4.7). 109 Corrective & Preventative action How does the organisation instigate appropriate corrective and/or preventive actions to eliminate or prevent the causes of identified poor performance and non conformance? 3 Formal audits of wider AM activities include external assessment of the AMMAT, external assessment of the PSMS, and one-off reviews such as the Mitton ElectroNet asset condition assessment. Scrutiny of narrower aspects of the AM system include review of individual network designs and post-construction inspection of assets. Contractor GM said that Delta has a comprehensive safety management framework in place that parallels its management struture. Delta has also engaged Network Compliance to examine their own field practices. This has since migrated to NTL so it oversess all of NTL's contractors, not just Delta. 3 Contractor GM said that Delta have put a known defects register in place that signals failure trends to NTL. Network manager described how him and Ops manager discuss recurring faults to identify trends and define remedial actions. Having investigated asset related failures, incidents and non-conformances, and taken action to mitigate their consequences, an organisation is required to implement preventative and corrective actions to address root causes. Incident and failure investigations are only useful if appropriate actions are taken as a result to assess changes to a businesses risk profile and ensure that appropriate arrangements are in place should a recurrence of the incident happen. Widely used AM standards also require that necessary changes arising from preventive or corrective action are made to the asset management system. The management team responsible for its asset management procedure(s). The team with overall responsibility for the management of the assets. Audit teams, together with key staff responsible for asset management. For example, Asset Management Director, Engineering Director. People with responsibility for carrying out risk assessments The management team responsible for its asset management procedure(s). The team with overall responsibility for the management of the assets. Audit and incident investigation teams. Staff responsible for planning and managing corrective and preventive actions. The organisation's asset-related audit procedure(s). The organisation's methodology(s) by which it determined the scope and frequency of the audits and the criteria by which it identified the appropriate audit personnel. Audit schedules, reports etc. Evidence of the procedure(s) by which the audit results are presented, together with any subsequent communications. The risk assessment schedule or risk registers. Analysis records, meeting notes and minutes, modification records. Asset management plan(s), investigation reports, audit reports, improvement programmes and projects. Recorded changes to asset management procedure(s) and process(es). Condition and performance reviews. Maintenance reviews 113 Continual Improvement How does the organisation achieve continual improvement in the optimal combination of costs, asset related risks and the performance and condition of assets and asset systems across the whole life cycle? 3 Corporate Services manager described the improvements being made to the Business Case template to ensure that a prescribed range of benefits are systematically considered, options for low investmnet are adequately considered, and that investment is aligned to strategic goals. Widely used AM standards have requirements to establish, implement and maintain process(es)/procedure(s) for identifying, assessing, prioritising and implementing actions to achieve continual improvement. Specifically there is a requirement to demonstrate continual improvement in optimisation of cost risk and performance/condition of assets across the life cycle. This question explores an organisation's capabilities in this area looking for systematic improvement mechanisms rather that reviews and audit (which are separately examined). The top management of the organisation. The manager/team responsible for managing the organisation's asset management system, including its continual improvement. Managers responsible for policy development and implementation. Records showing systematic exploration of improvement. Evidence of new techniques being explored and implemented. Changes in procedure(s) and process(es) reflecting improved use of optimisation tools/techniques and available information. Evidence of working parties and research. AMP Sch S13.AMMAT
237 Commerce Commission Information Disclosure Template SCHEDULE 13: REPORT ON ASSET MANAGEMENT MATURITY This schedule requires information on the EDB S self-assessment of the maturity of its asset management practices. Company Name AMP Planning Period Asset Management Standard Applied Network Tasman Limited 1 April March Continual Improvement How does the organisation seek and acquire knowledge about new asset management related technology and practices, and evaluate their potential benefit to the organisation? 3 NTL staff receive journals and bulletins, attend conferences and seek external advice on AM technologies and practices. Telecommunications and Metering manager confirmed that larger investment opportunities are subject to rigorous analysis that includes specific variation scenarios. One important aspect of continual improvement is where an organisation looks beyond its existing boundaries and knowledge base to look at what 'new things are on the market'. These new things can include equipment, process(es), tools, etc. An organisation which does this (eg, by the PAS 55 s 4.6 standards) will be able to demonstrate that it continually seeks to expand its knowledge of all things affecting its asset management approach and capabilities. The organisation will be able to demonstrate that it identifies any such opportunities to improve, evaluates them for suitability to its own organisation and implements them as appropriate. This question explores an organisation's approach to this activity. The top management of the organisation. The manager/team responsible for managing the organisation's asset management system, including its continual improvement. People who monitor the various items that require monitoring for 'change'. People that implement changes to the organisation's policy, strategy, etc. People within an organisation with responsibility for investigating, evaluating, recommending and implementing new tools and techniques, etc. Research and development projects and records, benchmarking and participation knowledge exchange professional forums. Evidence of correspondence relating to knowledge acquisition. Examples of change implementation and evaluation of new tools, and techniques linked to asset management strategy and objectives. AMP Sch S13.AMMAT
238 Commerce Commission Information Disclosure Template SCHEDULE 13: REPORT ON ASSET MANAGEMENT MATURITY (cont) Company Name AMP Planning Period Asset Management Standard Applied Network Tasman Limited 1 April March 2029 SCHEDULE 13: REPORT ON ASSET MANAGEMENT MATURITY (cont) Company Name AMP Planning Period Asset Management Standard Applied Network Tasman Limited 1 April March 2029 Question No. Function Question Maturity Level 0 Maturity Level 1 Maturity Level 2 Maturity Level 3 Maturity Level Audit What has the organisation done to establish procedure(s) for the audit of its asset management system (process(es))? The organisation has not recognised the need to establish procedure(s) for the audit of its asset management system. The organisation understands the need for audit procedure(s) and is determining the appropriate scope, frequency and methodology(s). The organisation is establishing its audit procedure(s) but they do not yet cover all the appropriate asset-related activities. The organisation can demonstrate that its audit procedure(s) cover all the appropriate asset-related activities and the associated reporting of audit results. Audits are to an appropriate level of detail and consistently managed. The organisation's process(es) surpass the standard required to comply with requirements set out in a recognised standard. The assessor is advised to note in the Evidence section why this is the case and the evidence seen. 109 Corrective & Preventative action How does the organisation instigate appropriate corrective and/or preventive actions to eliminate or prevent the causes of identified poor performance and non conformance? The organisation does not recognise the need to have systematic approaches to instigating corrective or preventive actions. The organisation recognises the need to have systematic approaches to instigating corrective or preventive actions. There is ad-hoc implementation for corrective actions to address failures of assets but not the asset management system. The need is recognized for systematic instigation of preventive and corrective actions to address root causes of non compliance or incidents identified by investigations, compliance evaluation or audit. It is only partially or inconsistently in place. Mechanisms are consistently in place and effective for the systematic instigation of preventive and corrective actions to address root causes of non compliance or incidents identified by investigations, compliance evaluation or audit. The organisation's process(es) surpass the standard required to comply with requirements set out in a recognised standard. The assessor is advised to note in the Evidence section why this is the case and the evidence seen. 113 Continual Improvement How does the organisation achieve continual improvement in the optimal combination of costs, asset related risks and the performance and condition of assets and asset systems across the whole life cycle? The organisation does not consider continual improvement of these factors to be a requirement, or has not considered the issue. A Continual Improvement ethos is recognised as beneficial, however it has just been started, and or covers partially the asset drivers. Continuous improvement process(es) are set out and include consideration of cost risk, performance and condition for assets managed across the whole life cycle but it is not yet being systematically applied. There is evidence to show that continuous improvement process(es) which include consideration of cost risk, performance and condition for assets managed across the whole life cycle are being systematically applied. The organisation's process(es) surpass the standard required to comply with requirements set out in a recognised standard. The assessor is advised to note in the Evidence section why this is the case and the evidence seen. AMP Sch S13.AMMAT
239 Commerce Commission Information Disclosure Template SCHEDULE 13: REPORT ON ASSET MANAGEMENT MATURITY (cont) Company Name AMP Planning Period Asset Management Standard Applied Network Tasman Limited 1 April March Continual Improvement How does the organisation seek and acquire knowledge about new asset management related technology and practices, and evaluate their potential benefit to the organisation? The organisation makes no attempt to seek knowledge about new asset management related technology or practices. The organisation is inward looking, however it recognises that asset management is not sector specific and other sectors have developed good practice and new ideas that could apply. Ad-hoc approach. The organisation has initiated asset management communication within sector to share and, or identify 'new' to sector asset management practices and seeks to evaluate them. The organisation actively engages internally and externally with other asset management practitioners, professional bodies and relevant conferences. Actively investigates and evaluates new practices and evolves its asset management activities using appropriate developments. The organisation's process(es) surpass the standard required to comply with requirements set out in a recognised standard. The assessor is advised to note in the Evidence section why this is the case and the evidence seen. AMP Sch S13.AMMAT

 the following attached information of Network Tasman Limited prepared for the purposes of clauses 2.4.1. 2.6.1, 2.6.3, 2.6.6 and 2.7.")
240 networktasman Your consumer-owned electricity distributor Network Tasman Limited Tel: Main Road, Hope 7020 Freephone: PO Box 3005 Fax: Richmond info@networktasman.co.nz Nelson, New Zealand Website: IN ACCORDANCE WITH THE COMMERCE ACT Electricity Distribution Information Disclosure Determination 2012 Clause Certification for Year-beginning Disclosure 2019 We, MICHAEL JOHN McCLISKIE and ANTHONY PAGE REILLY, being directors of Network Tasman Limited certify that, having made all reasonable enquiry, to the best of our knowledgea) the following attached information of Network Tasman Limited prepared for the purposes of clauses , 2.6.3, and of the Electricity Distribution Information Disclosure Determination 2012 in all material respects complies with that determination. b) The prospective financial or non-financial information included in the attached information has been measured on a basis consistent with regulatory requirements or recognised industry standards. c) The forecasts in Schedules 11a, 11 b, 12a, 12b, 12c and 12d are based on objective and reasonable assumptions which both align with Network Tasman Limited's corporate vision and strategy and are documented in retained records. Michael John McCliskie Anthony Page Reilly 29 March 2019