Terminal Opportunities & Challenges. Peter I. Keller NYK Line April 24, 2006
|
|
|
- Louise Hunter
- 6 years ago
- Views:
Transcription

1 Terminal Opportunities & Challenges Peter I. Keller NYK Line April 24, 2006


2 . First, a word about NYK 2


3 Sea Earth Air Logistics Integrator Hardware / Assets 660 Vessels Sea Software / Services NYK Line 114 Offices / 4,000 Employees 11,000 Seafarers Ocean Transportation NYK Line, TSK Line, NYK-Hinode, NYK Global Bulk 260 Distribution Centers / 2,700 Tractors&Trailers 27 Container& RoRo Terminals 13 B-747 Freighters Earth Air 3 NYK Logistics 250 Offices / 13,000 Employees Freight forwarding & Transportation NVOCC Double Wing Express Customs Clearance and Import/Export Management Warehousing & Distribution Consolidation Cross Dock / De-consolidation Origin Cargo Order Management Manufacturers Inbound Logistics Auto Logistics (PDI, Transportation) Other Logistics Services & Consultation Yusen Air & Sea Service 166 Offices / 4,300 Employees Air Forwarding and relevant Logistics Services Nippon Cargo Airlines 17 Offices / 750 Employees Air Transportation
4 Fleet of NYK Group Container ships 137 Bulk carriers Capesize Bulk carriers Panamax& Handysize Wood-chip carriers Car carriers 98 Reefer carriers 27 Tankers 61 LNG carriers 22 Cruise ships 4 Others vessels with 37.6 million DWT (as of March 31, 2005)


5 Industry Challenges.. 5
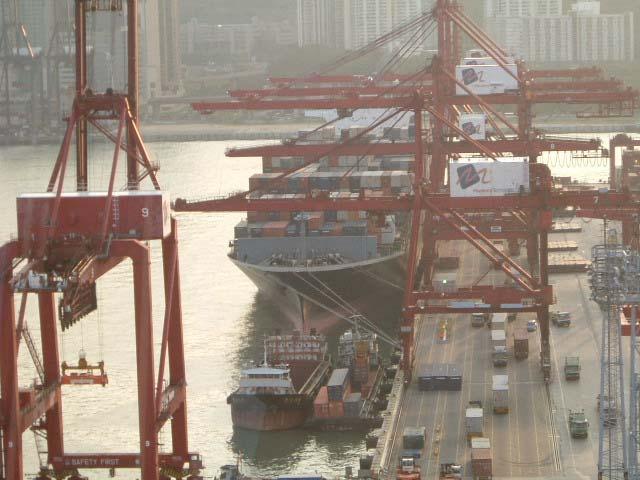
6 Industry Challenges Infrastructure Will become the most significant limiting factor for cargo movement, not supply or vessel size. Carriers will need to focus on offering superior terminal and operational service to offer competitive service levels. Cargo delivery efficiencies must be focused on to reduce cost and drive customer following. Terminal space utilization, cargo sequencing and reduced turn time will be critical to enable carriers/terminals to meet future demand. 6


7 North American Container Terminal Capacity Update
8 Container terminal capacity definitions and key assumptions: current average industry operating practices Definitions Capacity: the theoretical maximum capacity of the marine container terminals Assumes container terminal storage is the constraint -- as it is in most container terminals Includes consideration of peaking in order to estimate the maximum theoretical capacity Utilization: projected throughput divided by capacity Key Assumptions Base Case storage capacity: 50% 90 TEU/acre wheeled storage and 50% 135 TEU/acre toppick storage for imports. 100% 135 TEU/acre toppick storage for exports. Medium Density storage capacity: 100% imports/exports RTG stowed 2.5 high, 225 TEU/acre. High Density storage capacity: 100% imports/exports stowed 3.5 high, 315 TEU/acre. All Empties block stowed, 450 TEU/acre. Import Dwell: Rail 2 days Local 5 days Export Dwell: Rail 3.5 days Local 7 days Empty dwell 21 days Capacities adjusted for a 20% peaking factor 8
9 Port Region Summaries PSW PNW South Atlantic South Florida 2005 Net Position 2010 Net Position Comments LA/LB face significant capacity challenges during the planning horizon. Oakland has ample capacity Existing capacity plus Tacoma s expansion potential should result in ample capacity unless major PSW diversions continue Savannah s significant surpluses and Charleston's modest surpluses provide ample capacity. Charleston s berths may pose constraints Port Everglade s significant surpluses drive South Florida s surpluses throughout the planning horizon 9
10 San Pedro Bay Ports Net Position: Base density: capacity shortfall under all demand scenarios Medium density: Accommodates low growth Shortfalls occur under both the base and high forecast scenarios High density: Accommodates low and base forecast scenarios Capacity is balanced in 2009 and a shortfall occurs in 2010 Implications: given current environmental issues and associated lead times, the terminals will need to significantly improve asset utilization to accommodate demand through
11 The Southern California region* San Pedro Bay Area Capacity Utilization Thousands of TEUs 40,000 30,000 20,000 10, Beyond Low Forecast 13,560 14,034 14,526 15,034 15,560 16,105 16,669 Base Forecast 13,953 14, ,854 17,950 19,117 20,359 High Forecast 14,673 16,434 18,406 20,615 23,089 25,860 28,963 Base Density 13,738 13,738 14,884 14,884 14,884 14,884 14,884 Medium Density 18,369 18,369 19,900 19,900 19,900 19,900 19,900 High Density 22,257 22,257 24,111 24,111 24,111 24,111 24,111 Low Forecast Base Forecast High Forecast Base Density Medium Density High Density Source: Norbridge analysis. *Includes the ports of Long Beach and Los Angeles. 11 Note: Bars represent projected port throughput while lines represent projected port capacity
12 Los Angeles Los Angeles Capacity Utilization Thousands of TEUs 20,000 15,000 10,000 5, Beyond Low Forecast 7,578 7,843 8,117 8,402 8,696 9,000 9,315 Base Forecast 7,797 8,304 8,844 9,419 10,031 10,683 11,377 High Forecast 8,200 9,184 10,286 11,520 12,903 14,451 16,185 Base Density 8,055 8,055 8,457 8,457 8,457 8,457 8,457 Medium Density 10,784 10,784 11,322 11,322 11,322 11,322 11,322 High Density 13,069 13,069 13,720 13,720 13,720 13,720 13,720 Low Forecast Base Forecast High Forecast Base Density Medium Density High Density Source:Norbridge Analysis Note: Bars represent projected port throughput while lines represent projected port capacity 12
13 Long Beach Long Beach Capacity Utilization Thousands of TEUs 15,000 10,000 5, Beyond Low Forecast 5,982 6,192 6,408 6,633 6,865 7,105 7,354 Base Forecast 6,156 6,556 6,982 7,436 7,919 8,434 8,982 High Forecast 6,473 7,250 8,120 9,095 10,186 11,408 12,777 Base Density 5,683 5,683 6,427 6,427 6,427 6,427 6,427 Medium Density 7,585 7,585 8,578 8,578 8,578 8,578 8,578 High Density 9,188 9,188 10,391 10,391 10,391 10,391 10,391 Low Forecast Base Forecast High Forecast Base Density Medium Density High Density Source: Norbridge analysis. 13 Note: Bars represent projected port throughput while lines represent projected port capacity
14 Oakland s Net Capacity Position: Base density: accommodates low and base demand through 2009 Medium density: accommodates low and base demand beyond 2010 Capacity shortfall occurs in 2010 under the high forecast High density: accommodates all growth scenarios beyond the forecast period Implications: Available capacity, in combination with the expansion potential associated with the Army Base project should insure that Oakland does not face significant capacity issues during the forecast horizon 14
15 Oakland Oakland Capacity Utilization 6,000 Thousands of TEUs 5,000 4,000 3,000 2,000 1,000 Low Forecast Base Forecast High Forecast Base Density Medium Density High Density Beyond Beyond Source: Norbridge analysis. Note: Bars represent projected port throughput while lines represent projected port capacity 15
16 Puget Sound s Net Capacity Position: Base density: accommodates low and base demand throughout the planning horizon Under the high forecast, shortfalls develop by 2008 Medium density: accommodates low and base demand beyond 2010 Capacity balance occurs in 2010 under the high forecast High density: accommodates all growth scenarios beyond the forecast period Implications: Available capacity, in combination with Tacoma s expansion potential should insure that Puget Sound does not face significant capacity issues during the forecast horizon This does not reflect the potential effect that continued diversion of PSW cargoes could have on the current capacity surplus 16
17 Puget Sound* Ports Puget Sound Capacity Utilization Thousands of TEUs 9,000 8,000 7,000 6,000 5,000 4,000 3,000 2,000 1,000 0 Low Forecast Base Forecast High Forecast Base Density Medium Density High Density Beyond Beyond Note: Bars represent projected port throughput while lines represent projected port capacity Source: AAPA, MARAD, and Norbridge analysis. *Includes the ports of Seattle and Tacoma. 17
18 Seattle Seattle Capacity Utilization Thousands of TEUs 4,500 4,000 3,500 3,000 2,500 2,000 1,500 1, Low Forecast Base Forecast High Forecast Base Density Medium Density High Density Beyond Beyond Source: Norbridge analysis. Note: Bars represent projected port throughput while lines represent projected port capacity 18
19 Tacoma Tacoma Capacity Utilization Thousands of TEUs 4,500 4,000 3,500 3,000 2,500 2,000 1,500 1, Low Forecast Base Forecast High Forecast Base Density Medium Density High Density Beyond Beyond Source: AAPA, MARAD, and Norbridge analysis. Note: Bars represent projected port throughput while lines represent projected port capacity 19
20 Puget Sound s Net Capacity Position: Base density: capacity shortfalls occur under all demand scenarios Medium density: accommodates low and base demand beyond 2010 Capacity shortfalls develop by 2009 under the high forecast High density: accommodates all growth scenarios beyond the forecast period Implications: Vancouver could begin to experience capacity shortfalls by depending on demand. The opening of Prince Rupert Phase I could offset this trend and result in a capacity surplus throughout the planning horizon 20
21 Vancouver Vancouver Capacity Utilization 7,000 Thousands of TEUs 6,000 5,000 4,000 3,000 2,000 1,000 Low Forecast Base Forecast High Forecast Base Density Medium Density High Density Beyond Beyond Source: Norbridge analysis. Note: Bars represent projected port throughput while lines represent projected port capacity 21
22 New York s Net Capacity Position: Base density: accommodates the low and base forecasts throughout the planning horizon Capacity shortfalls develop in 2009 under the high forecast scenario Medium density: capacity significantly exceeds demand under all forecast scenarios High density: capacity significantly exceeds demand under all forecast scenarios Implications: New York is not expected to experience capacity issues throughout the forecast horizon The introduction of multiple Suez services with 6,500+ TEU ships could potentially create draft and berth constraints 22
23 New York/New Jersey 12,000 New York/New Jersey Capacity Utilization Thousands of TEUs 10,000 8,000 6,000 4,000 2,000 Low Forecast Base Forecast High Forecast Base Density Medium Density High Density Beyond Beyond Source: Norbridge analysis. Note: Bars represent projected port throughput while lines represent projected port capacity 23
24 Hampton Road s Net Capacity Position: The Maersk Cox Property development in combination with the ongoing modernization of NIT South and expansion of NIT North will provide significant surplus capacity throughout the forecast horizon Suez Service Effects: if a number of carriers were to introduce 6,500+ TEU vessel strings with Hampton Roads as the first port inbound due to its deep draft, its is possible that capacity shortfalls could develop under the base scenario 24
25 Hampton Roads Hampton Roads Capacity Utilization Thousands of TEUs 10,000 9,000 8,000 7,000 6,000 5,000 4,000 3,000 2,000 1,000 0 Low Forecast Base Forecast High Forecast Base Density Medium Density High Density Beyond Beyond Source: AAPA, MARAD, and Norbridge analysis. Note: Bars represent projected port throughput while lines represent projected port capacity 25
26 South Atlantic s Net Capacity Position: Significant capacity surpluses in Savannah offset potential berth and yard constraints in Charleston and result in a net surplus for the South Atlantic region The Mitsui/Trapac Jacksonville development could lead to further capacity surpluses if the NWA diverts traffic from Charleston and Jacksonville The introduction of Suez Services could absorb some portion of the surplus depending on the number of strings, the average size vessel deployed and the port rotations 26
27 South Atlantic* South Atlantic Capacity Utilization 16,000 Thousands of TEUs 14,000 12,000 10,000 8,000 6,000 4,000 2,000 Low Forecast Base Forecast High Forecast Base Density Medium Density High Density Beyond Beyond Source: AAPA, MARAD, and Norbridge analysis. Note: Bars represent projected port throughput while lines represent projected port capacity 27
28 Charleston s Net Capacity Position: / Base density: accommodates the low and base forecasts throughout the planning horizon Capacity shortfalls develop by 2009 under the high forecast Medium & High Density: both scenarios generate significant capacity surpluses throughout the planning horizon Potential berth constraints: Charleston currently experiences berth constraints at selected terminals today on peak days. Berth capacity could become a significant capacity constraint The Navy Base development has been excluded from the analysis 28
29 Charleston Charleston Capacity Utilization Thousands of TEUs 5,000 4,500 4,000 3,500 3,000 2,500 2,000 1,500 1, Low Forecast Base Forecast High Forecast Base Density Medium Density High Density Beyond Beyond Source: Norbridge analysis. Note: Bars represent projected port throughput while lines represent projected port capacity 29
30 Savannah s Net Capacity Position: Savannah has ample capacity under all operating scenarios The Mitsui OSK/Trapac development in Jacksonville could result in further increases if NWA traffic is diverted from Savannah 30
31 Savannah Savannah Capacity Utilization 12,000 Thousands of TEUs 10,000 8,000 6,000 4,000 2,000 Low Forecast Base Forecast High Forecast Base Density Medium Density High Density Beyond Beyond Source: AAPA, MARAD, and Norbridge analysis. Note: Bars represent projected port throughput while lines represent projected port capacity 31
32 Jacksonville s Net Capacity Position: Jacksonville has ample capacity under all operating scenarios The demand side effects of the Mitsui OSK/Trapac development may increase the demand scenarios. However, significant capacity surpluses are still likely The wheeled nature of Jacksonville s Puerto Rico business probably leads to an overstatement of capacity Moderate overstatement under the Base Density scenario Significant overstatement under the Medium and High Density scenarios Consequently, NYK may want to consider testing Jacksonville under a wheeled operation scenario 32
33 Jacksonville Jacksonville Capacity Utilization 6,000 Thousands of TEUs 5,000 4,000 3,000 2,000 1,000 Low Forecast Base Forecast High Forecast Base Density Medium Density High Density Beyond Beyond Source: MARAD and Norbridge analysis. Note: Bars represent projected port throughput while lines represent projected port capacity 33
34 South Florida s Net Capacity Position: Significant capacity surpluses in Port Everglades drive the net capacity surpluses under all operating scenarios Miami capacity is potentially overstated due to the wheeled operations by Seaboard Would reduce overall capacity, particularly under the medium and high density scenarios NYK may want to consider adjusting the Miami estimates to reflect Seaboard s wheeled operations Additional expansion potential at Port Everglades, if developed, would increase current capacity surpluses 34
35 South Florida* South Florida Capacity Utilization 7,000 Thousands of TEUs 6,000 5,000 4,000 3,000 2,000 1,000 Low Forecast Base Forecast High Forecast Base Density Medium Density High Density Beyond Beyond Source: AAPA, MARAD, TSC, and Norbridge analysis. *Includes the the Port of Miami and Port Everglades. Note: Bars represent projected port throughput while lines represent projected port capacity 35
36 Miami Miami Capacity Utilization 2,500 Thousands of TEUs 2,000 1,500 1, Low Forecast Base Forecast High Forecast Base Density Medium Density High Density Beyond Beyond Source: TSC, AAPA, MARAD, and Norbridge analysis. Note: Bars represent projected port throughput while lines represent projected port capacity 36
37 Port Everglades Port Everglades Capacity Utilization 4,000 Thousands of TEUs 3,500 3,000 2,500 2,000 1,500 1, Low Forecast Base Forecast High Forecast Base Density Medium Density High Density Beyond Beyond Source: AAPA, MARAD, and Norbridge analysis. Note: Bars represent projected port throughput while lines represent projected port capacity 37
38 Houston s Net Capacity Position: Houston faces significant capacity challenges under the base and medium density scenarios throughout the planning horizon Moderate capacity surpluses occur under the high density scenario The development of Bayport will create significant capacity surpluses Implications: Houston faces significant challenges in accommodating growth during the planning horizon, particularly if the Wal-Mart distribution center development attracts additional direct call services 38
39 Houston Houston Capacity Utilization 7,000 Thousands of TEUs 6,000 5,000 4,000 3,000 2,000 1,000 Low Forecasrt Base Forecast High Forecast Base Density Medium Density High Density Beyond Beyond Source: AAPA, MARAD, Norbridge analysis. Note: Bars represent projected port throughput while lines represent projected port capacity 39
40 Marine Infrastructure Productivity We must be better stewards of our assets West Coast is getting +/- 25 moves per hour (mph). Southeast Ports get +/- 40 mph. Even a NY Terminal gets 35 mph. World standard in excess of 45 mph Dwell of assets. Shippers demand fastest service with maximum of days free from demurrage & detention. Vessel operations typically 24/7, balance of supply chain 8/5. Slowest link dictates velocity. Berth constraints possible in future Labor a major driver 40
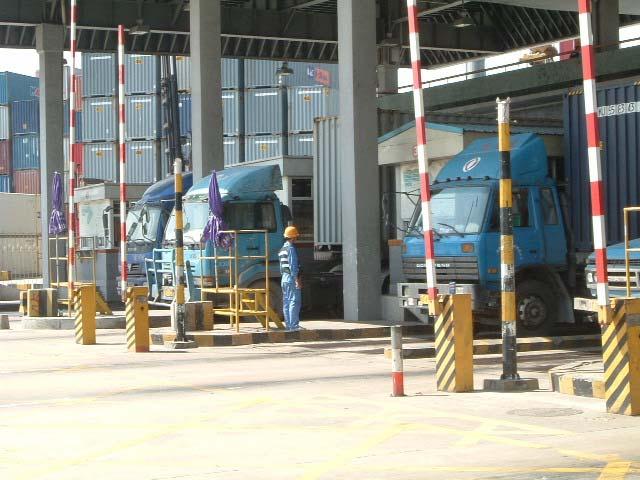
41 Industry Challenges Inland transportation costs and depot delivery points Trucking service and driver availability Fuel cost and cost sharing to avoid carrier service or availability disruption. Limited expansion for inland as well as port operations Chassis Operations A new paradigm is emerging 41
42 Intermodal Partners Rail capacity, service and pricing concerns to support inland distribution centers. Rail costs up 25-28% Rail duopoly and regulation/deregulation dilemma 6- Jan 13- Jan 20- Jan 27- Jan 3-Feb 10- Feb 17- Feb 24- Feb 3-Mar 2006 Ave 2005 Ave 2004 Ave 2003 Ave BNSF UPSP NS CSXT CN N/A CP
43 Intermodal Partners Opportunities Utilization of alternative gateways and rails East & Gulf Coast More emphasis on NS & CSX Prince Rupert via CN Mexico via KCS Panama Canal capacity long term v/v Suez Gateway Trucking capacity and driver retention demand rails examine short & medium haulage opportunities Efficiency of truck moves (less empty hauls) and dramatic changes in chassis management 43
44 Potholes Does the population at large really understand how all that stuff gets to the Target shelves? Transportation is seen as a congester of highways, polluter of the seacoasts, fouler of the air and maker of noise 44
45 Industry Potholes Lack of U.S. Transportation Policy including Maritime U.S. Flag fleet essentially restricted to Jones Act Little if any understanding of importance of International trade US Terminal expansion severely limited Interstate Highway system older than Containerization Rail capacity and service (Now providers of capacity, not service ) Short Sea the new game Entry points to US are becoming more congested with little or no Government involvement for investment This, while Asia and other places in the world are building capacity in their transportation systems to support the new reality of International trade 45
46 Industry Potholes EPA and Government Regulatory limitations, at all levels, for operations and growth No current balance between environment and growth California attempting to preempt federal jurisdictions Others will follow for political reasons 46
47 Industry Potholes Larger vessels will continue to create even greater challenges as we push the mine is bigger than yours mentality and we do NOT address productivity Water depths Berth sizes Crane capabilities We need dramatic changes as to date we have generally paved the cow path. 47
48 Industry Potholes Supply Chain Security An imperative to protect our Nation, our Business and our Customers Brand Answer is not in the U.S., rather it is an extraterritorial matter C-TPAT and Container Security Initiative (CSI) are reasonable initiatives Technology will be helpful if properly applied to solve a defined, real problem. Identity of Workers essential (TWIC) We need to stop the political posturing and listen to the real experts 48
49 The Future Lines that can deliver Integrated Supply Chain solutions that meet specific customer demands will dominate Real Productivity solutions and paradigm changes as the business continues to mature are essential, especially in the U.S. Terminal and Intermodal segment We must find competitive alternatives to keep all elements of the Intermodal process in balance Supply Chain Visibility & Security will be non-negotiable 49
50 Questions and Answers 50
Expectations for Port Customers and Clients. Dan Sheehy -NYK Line AAPA Meeting October 23, 2008
 Expectations for Port Customers and Clients Dan Sheehy -NYK Line AAPA Meeting October 23, 2008 Areas for Review 1. Overview of NYK Line 2. Liner Trade Business 3. Demand versus Supply Outlook 4. Bunker
The Potential Impact of Trucker Demand and Supply Issues at U.S. East Coast and Gulf Coast Ports
 The Potential Impact of Trucker Demand and Supply Issues at U.S. East Coast and Gulf Coast Ports AAPA Maritime Economic Development/Public Relations Seminar June 8-10, 2005 Martin Associates 2938 Columbia
84 th International Propeller Club Convention Fundamental Changes to a Traditional Transportation Paradigm. October 7, 2009
 84 th International Propeller Club Convention Fundamental Changes to a Traditional Transportation Paradigm October 7, 2009 Today s Objectives Endeavor to provide a broad context for today s session by
Intermodalism -- Metropolitan Chicago's Built-In Economic Advantage
 May 1, 2015 Intermodalism -- Metropolitan Chicago's Built-In Economic Advantage CMAP's regional economic indicators microsite features key measures of metropolitan Chicago's economy and, where applicable,
Northwestern University Transportation Center
 Northwestern University Transportation Center 1 Overview» Fully integrated: large scale development, redevelopment, investment and property management operations» Founded in 1984, NYSE listed from 1993
Challenges with Evaluating Container Port Projects and the Corps of Engineers
 Challenges with Evaluating Container Port Projects and the Corps of Engineers Smart Rivers Conference 14 September 2011 Kevin Knight Economist Institute for Water Resources U.S. Corps of Engineers 1 Trends
Global Supply Chain Management: Seattle-Tacoma
 Boston Strategies International, Inc. February 2008 Global Infrastructure Series Global Supply Chain Management: Seattle-Tacoma www.bostonstrategies.com b t t t i (1) (781) 250 8150 Page 1 This report
Major Issues and Trends Facing the Port and Marine Transportation Industry
 Major Issues and Trends Facing the Port and Marine Transportation Industry AAPA MTMTP Charleston, SC 4-24-06 Objectives Cover Some Mega-trends Discuss Transportation Industry Challenges Touch on Some of
Port Activity and Competitiveness Tracker
 Comprehensive Regional Goods Movement Plan and Implementation Strategy Port Activity and Competitiveness Tracker Presented to I-710 Corridor Advisory Committee Gill Hicks Cambridge Systematics, Inc. May
BNSF Railway. The West Coast is the Best Coast. Fred Malesa. Vice President International Marketing Oct. 11, 2011
 BNSF Railway The West Coast is the Best Coast Fred Malesa Vice President International Marketing Oct. 11, 2011 All slides are copyright 2011. Burlington Northern Santa Fe Corporation and BNSF Railway Company.
Panama Canal Expansion: Who Wins? Who Loses?
 Panama Canal Expansion: Who Wins? Who Loses? Curtis Spencer, IMS Worldwide, Inc. Jim MacLellan, Port of Los Angeles Kevin Burwell, Virginia Port Authority John Moseley, Port of Houston Authority Agenda
Technical Memorandum 3 Executive Summary Existing Conditions and Constraints Presentation. March 22, 2006
 Technical Memorandum 3 Executive Summary Existing Conditions and Constraints Presentation March 22, 2006 MCGMAP Overview Develop a: Goods Movement Action Plan M A X I M I Z E S Mitigation of communities'
CONTAINERS AND BEYOND Derrick Smith AAPA Spring Conference - March 18, 2013
 CONTAINERS AND BEYOND Derrick Smith AAPA Spring Conference - March 18, 2013 1 What are some of the major trends that are occurring? Increased cargo Significant investments Greater rail usage 2 Many economic
CANADA S GATEWAYS: SUPPLY CHAIN PERFORMANCE MONITORING INITIATIVES. Leipzig, May 2, 2012
 CANADA S GATEWAYS: SUPPLY CHAIN PERFORMANCE MONITORING INITIATIVES Leipzig, May 2, 2012 1 Canada s Gateways and Trade Corridors: System-wide Approach Need objective fact-based metrics to: Asia-Pacific
Presentation Topics The Alameda Corridor Project Corridor Performance Goods Movement Challenges
 1 Presentation Topics The Alameda Corridor Project Corridor Performance Goods Movement Challenges 2 Ports of Los Angeles and Long Beach Largest port complex in the U.S. Fifth largest in the world Highest
Accommodating Mega-Ships at Existing Wharves
 Accommodating Mega-Ships at Existing Wharves Presented by: Kevin P. Abt, P.E. The Virginia Port Authority and Bruce Lambert U.S. Army Corps of Engineers February 22, 2006 National Cargo Trends U.S. Cargo
Partnering Infrastructure Development to Meet Hemispheric Growth AAPA Spring Conference
 Partnering Infrastructure Development to Meet Hemispheric Growth AAPA Spring Conference March 21, 2006 Agenda I. Objectives II. Hemispheric Growth Prospects III. Modal Challenges IV. Partnering Solutions-the
Container Shipping. Outlook and Issues for US East Coast Shippers and Ports. Tina Liu Country Manager, China. October 15, 2015 TPM Shenzhen
 Container Shipping Outlook and Issues for US East Coast Shippers and Ports October 15, 2015 TPM Shenzhen Tina Liu Country Manager, China Agenda Container volume growth Mega-alliances Mega-ships Port diversification
LOGISTICS Emerging & Alternative Ports. Title Sponsor : February 8-11, 2009 Gaylord Texan Dallas, Texas
 LOGISTICS 2009 February 8-11, 2009 Gaylord Texan Dallas, Texas Emerging & Alternative Ports Title Sponsor : Ports Panel: Emerging and Alternative Ports David W. Eaton VP of Corporate Affairs & Right of
AMERICAN ASSOCIATION OF PORT AUTHORITES JUNE 5, 2012 MARTIN ASSOCIATES PREPARED FOR:
 THE DYNAMICS OF THE US CONTAINER MARKET AND SHIFTING TRADE PATTERNS IMPLICATIONS FOR FUTURE INVESTMENT TO PROMOTE US EXPORT ACTIVITY AND ECONOMIC GROWTH PREPARED FOR: AMERICAN ASSOCIATION OF PORT AUTHORITES
WEST COAST LONGSHORE STRIFE
 Winter 2015/2016 OUTCOME OF WEST COAST LONGSHORE STRIFE A Cushman & Wakefield Logistics and Industrial Services Special Report Outcome of West Coast Longshore Strife It s now been over six months since
Port of Los Angeles. America s Port Harbor Transportation Club June 20, 2013 Kathryn McDermott
 Port of Los Angeles America s Port 2013 Harbor Transportation Club June 20, 2013 Kathryn McDermott Sea/Tac Battle for Discretionary Cargo Prince Rupert Eastern Canada NY/NJ OAK Norfolk LA/LB Savannah
PORT OF LONG BEACH SCREENING ANALYSIS OF CONTAINER TERMINAL OPTIONS
 PORT OF LONG BEACH SCREENING ANALYSIS OF CONTAINER TERMINAL OPTIONS Part 2: Evaluation of Options Prepared for: PORT PLANNING DIVISION August 28, 2007 Prepared by: MOFFATT AND NICHOL 3780 Kilroy Airport
Goods Movement Challenges. Opportunities. Solutions. Hasan Ikhrata Director of Planning & Policy Southern California Association of Governments
 Goods Movement Challenges. Opportunities. Solutions Hasan Ikhrata Director of Planning & Policy Southern California Association of Governments The Regional Planning Agency for Southern California 15 th
437 Telfair Road. Property Highlights. Pricing FOR LEASE > WAREHOUSE SPACE GARDEN CITY, GA 31415
 Property Highlights > ±207,676 SF available > 24 ceiling height > Building depth: 190 > High quality masonry & metal construction > Sprinklered > ±4,000 SF office (±2,000 on 2 floors) > Abundant outside
Enhancing and Expanding Containerized Commodity Movements. Libby Ogard Prime Focus LLC June 13, 2013
 Enhancing and Expanding Containerized Commodity Movements Libby Ogard Prime Focus LLC June 13, 2013 An Empty Box is a Terrible Thing to Waste! 20% of all ocean containers are repositioned empty Stakeholders
How Tomorrow Moves: Ohio Conference on Freight 2011 Atlantic Connections to the Midwest
 How Tomorrow Moves: Ohio Conference on Freight 2011 Atlantic Connections to the Midwest 1 Agenda CSX Review Market Overview National Gateway & NW Ohio Intermodal Hub Bridging Global Commerce 2 2011 first
State of Our Port and Intermodal Freight Systems
 US Chamber of Commerce National Chamber Foundation Trade & Transportation: A Study of North American Port and Intermodal Systems Understanding National Freight System Dynamics: State of Our Port and Intermodal
Effects of the Panama Canal Expansion on Texas Ports and Highway Corridors. executive summary
 executive summary prepared for Texas Department of Transportation Government and Business Enterprises Division prepared by October 2006 www.camsys.com Executive Summary Key Findings The proposed expansion
Innovations in Urban Freight. Commercial Challenges for the Port of Seattle February 6, 2011
 Innovations in Urban Freight Commercial Challenges for the Port of Seattle February 6, 2011 1 Pier 90/91 Pier 86 Pier 66 Terminal 46 T-18 On-Dock Rail BNSF (SIG - North) T- 5 On-Dock Rail Terminal 18 Terminal
Measuring Supply Chain Performance A Government Perspective. APCGI Workshop Toronto June 18, 2010
 Measuring Supply Chain Performance A Government Perspective APCGI Workshop Toronto June 18, 2010 1 Agenda Why should governments measure supply chain performance? 1. Policy Context 2. Supply Chain Metrics
Economic Perspective PACIFIC RIM TRADE
 Economic Perspective PACIFIC RIM TRADE Presented by Lee Harrington Vice Chairman LAEDC and WTCA LA Long Beach China Conference April 25, 2006 TOP 5 SOUTHERN CALIFORNIA TRADE PARTNERS 1995 Japan $37.2 China
Integrating Ports Into The Nation s Transportation Network
 27 th Annual Summer Ports, Waterways, Freight and International Trade Conference June 25, 2002 Pittsburgh, PA Integrating Ports Into The Nation s Transportation Network US Chamber of Commerce Study on
THE DYNAMICS OF THE US CONTAINER MARKET AND IMPLICATIONS FOR THE US PORT INDUSTRY
 THE DYNAMICS OF THE US CONTAINER MARKET AND IMPLICATIONS FOR THE US PORT INDUSTRY A PRESENTATION TO: CHANGING TRADE PATTERNS JANUARY 24, 2013 MARTIN ASSOCIATES 941 Wheatland Avenue, Suite 203 Lancaster,
Texas Ports and Texas Exports
 Texas Ports and Texas Exports Testimony of Ginger Goodin, P.E. Senior Research Engineer and Director, Transportation Policy Research Center Texas A&M Transportation Institute to Senate Select Committee
RTSA Technical Session
 RTSA Technical Session US Port & Intermodal Challenges April 21, 2015 5:30 p.m. PB 1885 Company founded by General William Parsons 1899 Mapping China s Hankow to Canton Railway 1906 Henry Brinckerhoff
Port Everglades Master/Vision Plan Update
 Port Everglades Master/Vision Plan Update Container and Non-Containerized Cargo Charrette Meeting June 18, 2009 1 The purpose of this presentation was to review the progress of the update to the 2006 Master/Vision
M. John Vickerman Principal Norfolk, Virginia
 Port & Intermodal Development In the Face of The Impending Tsunami M. John Vickerman Principal Norfolk, Virginia Trends Maritime : Current Course & Direction? Cargo Demands, Capacity, Funding, Productivity
Importance of Railroad,Trucking, and Warehousing Data in Public Sector Decision Making
 Importance of Railroad,Trucking, and Warehousing Data in Public Sector Decision Making Presented to TRB Workshop on Measuring the Transportation System from a Supply Chain Perspective Gill V. Hicks Cambridge
USWC Port Congestion & ILWU/PMA Contract Update. Last update: November 12, 2014
 USWC Port Congestion & ILWU/PMA Contract Update Last update: November 12, 2014 ILWU / PMA CONTRACT UPDATE July 1 st : ILWU / PMA the 6 year contract expired without new contract in place Both parties agree
The ever changing supply chain strategy. Tom Scorsune January 20, 2012
 The ever changing supply chain strategy Tom Scorsune January 20, 2012 Domestic production Circa 1950 Domestic Production Regional Distribution Production Distribution 2 Domestic production Circa 1970 New
GLOBAL AND DOMESTIC OUTLOOKS
 A A PA A n n u a l C o n f e r e n c e O c t o b e r 2 5, 2 016 GLOBAL AND DOMESTIC OUTLOOKS The supply chains are changing sometimes radically How are industr y and governments adapting? P i e r c e H
CLASS I RAIL CSX & Norfolk Southern
 INDUSTRIAL PARK ±2,700 Acres CLASS I RAIL CSX & Norfolk Southern PORT OF SAVANNAH Rail & Highway Access Updated 3/28/18 Industrial Park & Logistics Hub Highlights & Services SAVANNAH GATEWAY INDUSTRIAL
Business Development Update
 Business Development Update Performance By Commodity FY16 FY17 Total Port Berth Dry Bulk Liquid Bulk General Cargo +10% -1% +33% 2017 14,940,326 2017 21,717,106 2017 1,444,192 2016 13,618,586 2016 21,870,838
PANAMA CANAL BUSINESS FORUM
 PRESENTATION TO: PANAMA CANAL BUSINESS FORUM IMPACT OF THE PANAMA CANAL AND MARKET OPPORTUNITY FOR TEXAS Presentation By: Dr. Alexander Metcalf JANUARY 18, 2016 Transportation Economics & Management Systems,
New England Trade Development Summit
 Update on the Marine Highway Initiative New England Trade Development Summit Capt. Jeff Flumignan North Atlantic Gateway 1 Bowling Green, Suite 418 New York NY 10004 w w w. d o t. g o v New England Trade
BRIDGING GLOBAL TRADE
 BRIDGING GLOBAL TRADE PREPARING FOR FUTURE GROWTH AND CHANGE Presented to AAPA S 2013 Shifting International Trade Routes January 24, 2013 Curtis J. Foltz Executive Director, Georgia Ports Authority Georgia
Logistics Impact on Industrial Development and Investment. Prepared By: Curtis D. Spencer, President IMS Worldwide, Inc.
 Logistics Impact on Industrial Development and Investment Prepared By: Curtis D. Spencer, President IMS Worldwide, Inc. About IMS Worldwide Inc. IMSW has completed over 295 FTZ Projects during 45 years.
American Patriot Holdings LLC & PPHTD Creating Inland Marine Innovation
 American Patriot Holdings LLC & PPHTD Creating Inland Marine Innovation November 10, 2017 Today s Agenda Discuss the planned Gateway container terminal in Plaquemines Parish Location advantages The key
PORT OF SAVANNAH. Garden City Terminal: The Southeast Gateway for the U.S.
 PORT OF SAVANNAH Garden City Terminal: The Southeast Gateway for the U.S. July 24, 2018 GEORGIA PORTS AUTHORITY DEEPWATER & INLAND TERMINAL OPTIONS 9 Container berths 9,693 ft (2,955 m) of contiguous
CLASS I RAIL CSX & Norfolk Southern
 INDUSTRIAL PARK ±2,700 Acres CLASS I RAIL CSX & Norfolk Southern PORT OF SAVANNAH Rail & Highway Access Industrial Park & Logistics Hub Highlights & Services SAVANNAH GATEWAY INDUSTRIAL HUB Savannah Gateway
Turbulent Waters for Ocean Carriers and Ports. Doug Hansen NYKP, LLC/Ceres Terminals Inc. 2 February 2017 Tampa, Florida
 Turbulent Waters for Ocean Carriers and Ports Doug Hansen NYKP, LLC/Ceres Terminals Inc. 2 February 2017 Tampa, Florida 1 NYK Ports, LLC Who we are. Vancouver Duluth Montreal Halifax Stockton Oakland Port
Intermodal Is Leading The Way June 2013
 Intermodal Is Leading The Way June 2013 Presented by: Keith S. Stauber, SIOR Regional Managing Director +1 773 458 1386 keith.stauber@am.jll.com 1 Sensitivity Analysis The correlation between TEUs and
Planning for Container Growth Along the Houston Ship Channel and other Texas Seaports. TxDOT Project
 Planning for Container Growth Along the Houston Ship Channel and other Texas Seaports TxDOT Project 0-5068 Robert Harrison Center for Transportation Research February 3, 2007 Project Scope Analyze current
PORT OF SAVANNAH. Garden City Terminal: The Southeast Gateway for the U.S.
 PORT OF SAVANNAH Garden City Terminal: The Southeast Gateway for the U.S. GEORGIA PORTS AUTHORITY MORE DEEPWATER & INLAND TERMINAL OPTIONS Chatsworth Garden City Terminal Ocean Terminal Appalachian Regional
Please Do Not Copy or Distribute. Visit: for all the latest updates!
 Please Do Not Copy or Distribute Visit: www.nears.org for all the latest updates! The Port of Baltimore The Maryland Port Administration NEARS North East Association of Rail Shippers April 2013 Over 300
Gateway Infrastructure Development Programs in Urban Centers on the west coast of North America
 November 16, 2011 Gateway Infrastructure Development Programs in Urban Centers on the west coast of North America Capacity Improvements Congestion & Air Emissions Mitigation & Community Amenities Mark
Gene Seroka Executive Director Port of Los Angeles Port Outlook
 Gene Seroka Executive Director Port of Los Angeles 2017 Port Outlook August 10, 2017 1 San Pedro Bay Port Complex Heavy Investment in the Americas Port investment in the US and many other countries correlates
Port Cooperation Agreements Propelling Capital Projects
 Port Cooperation Agreements Propelling Capital Projects AAPA Capital Projects Seminar Norfolk, VA May 9, 2018 1 Andy Hecker Chief Financial Officer PortMiami Dakota Chamberlain Chief Facilities Development
Intermodal Success Story: BMW, SCPA and Norfolk Southern
 Intermodal Success Story: BMW, SCPA and Norfolk Southern 2016 North American Rail Shippers Annual Meeting Randy Bayles, Director International Intermodal Discussion Topics NS Overview Market Drivers Impacting
Shifting Trade Patterns A VIEW FROM THE WEATHER DECK
 Shifting Trade Patterns A VIEW FROM THE WEATHER DECK National Freight Infrastructure Policies The Impact of Shifting Trade Patterns Infrastructure Needs & Investment Plans January 24, 2013 Tampa, Florida
Shipping Industry Trends & Impacts on the Supply Chain. Larry Kvidera Port of Tacoma September 9-10, 2013
 Shipping Industry Trends & Impacts on the Supply Chain Larry Kvidera Port of Tacoma September 9-10, 2013 Port of Tacoma A Global Gateway Alaska Korea Japan Hong Kong Shanghai Taiwan Hawaii Europe Singapore
Driving Our Ports Toward Greater Efficiency Gene Seroka, Executive Director Port of Los Angeles
 Driving Our Ports Toward Greater Efficiency Gene Seroka, Executive Director Port of Los Angeles 27 th Annual Apparel Importers Trade and Transportation Conference November 4, 2015 Carrier Business is Stabilizing
The Next Mode of Transportation. Presented By: Ronald J. Silva CEO-Westar Transport
 The Next Mode of Transportation Presented By: Ronald J. Silva CEO-Westar Transport - Short Sea Shipping is the diversion of domestic and international cargos that move by highway from major metropolitan
JOC s Inland Port s Session at TPM. Overview and Definition of Inland Ports.
 JOC s Inland Port s Session at TPM Overview and Definition of Inland Ports. Curtis Spencer, President, IMS Worldwide, Moderator Ken Miller, VP Operations, JB Hunt Greg Tuthill, Sr. VP NYK Lines INLAND
Outside Looking in: Port of CHS as an Economic Engine
 Outside Looking in: Port of CHS as an Economic Engine Samuel A. Woodward President & CEO, Horizon Lines Executive Summary I. Overview II. Winners & Losers in the Post Panamax Era III. IV. Port of CHS as
Port of Los Angeles Presentation to the Los Angeles Investors Conference March 19, 2018
 Port of Los Angeles Presentation to the Los Angeles Investors Conference March 19, 2018 1 Today s Focus Introduction to the Port of Los Angeles Market Position & Cargo Volumes Capital Improvement Program
CLASS I RAIL CSX & Norfolk Southern
 INDUSTRIAL PARK ±2,700 Acres CLASS I RAIL CSX & Norfolk Southern PORT OF SAVANNAH Rail & Highway Access Industrial Park & Logistics Hub Highlights & Services SAVANNAH GATEWAY INDUSTRIAL HUB Savannah Gateway
Robert MORRIS Georgia Ports Authority
 The Harbor Boom: Meeting future Challenges Through Investment & Development Robert MORRIS Georgia Ports Authority Georgia Ports Authority Staying Ahead of the Curve Meeting Demands of Annual Double-Digit
Supply Chain Management Summit August 23, 2012
 Supply Chain Management Summit August 23, 2012 Steven J. King, P.E. Managing Director Quonset Business Park 3,207 Total Acres 168 Companies 8,800 Jobs Transportation Facilities Freight Seaport: 2 piers
American Association of Port Authorities
 American Association of Port Authorities U.S. Infrastructure Needs and Investment Plans Doug Wray January 29, 2015 Tampa, Florida Changing Market Dynamics Key Highlights The global container shipping industry
The Emergence of. Florida s Seaports and Inland Ports. Florida League of Cities - International Relations Committee November 17, 2011
 The Emergence of Florida s Seaports and Inland Ports Florida League of Cities - International Relations Committee November 17, 2011 History of the Global Supply Chain 2 Supply Chain, Circa 1950 Regional
Parent Company World Shipping - Cleveland, OH. Family owned business in operation since 1960 s
 ContainerPort, Inc. Parent Company World Shipping - Cleveland, OH Family owned business in operation since 1960 s Vessel husbandry, liner agency, ISO Tank and Dry Box NVOCC ContainerPort Group has been
Investor Presentation February 2018 Slide 1. Investor Presentation February 2018
 Investor Presentation February 2018 Slide 1 Investor Presentation February 2018 Forward Looking Statements Statements made during this presentation that set forth expectations, predictions, projections
Presentation to: Washington Public Ports Association
 Presentation to: Washington Public Ports Association Dick Marzano, Commissioner November 17, 2016 THE NORTHWEST SEAPORT ALLIANCE Containerized Cargo Port Rankings 1 LA/Long Beach 15,352,526 TEUs Seattle
BNSF Railway. Moving you Forward
 BNSF Railway Moving you Forward Northwestern University Transportation Center April 15, 2010 All slides are copyright 2010, BNSF Railway Company, All Rights Reserved. No part of this publication may be
Seaport Group. West Coast Container Traffic Trends. February West Coast Container Volumes 2010
 West Coast Container Traffic Trends Seaport Group February 2011 For further information and comments, please contact Terence Smyth on +1 604 732 8255 or tsmyth@seaport.com. This bulletin deals primarily
Panama Canal Expansion: Impacts on the US Marketplace
 NMHC General Session April 22, 2015 NMHC Spring Board Meeting Waldorf Astoria Hotel New York Panama Canal Expansion: Impacts on the US Marketplace M. John Vickerman Williamsburg, Virginia Today s Global
PORT OF SAVANNAH Garden City Terminal: The Southeast Gateway for the U.S. Presented to
 PORT OF SAVANNAH Garden City Terminal: The Southeast Gateway for the U.S. Presented to June 6, 2017 Chatham ICTF served by CSX Transportation Mason ICTF served by Norfolk Southern Railroad GARDEN CITY
High Volume, High Velocity Intermodal Operations
 Robert Johansen, P.E. JWD Group Jeannie Beckett Port of Tacoma Bryan Tomperi, P.E. Jacobs Civil High Volume, High Velocity Intermodal Operations AAPA Facilities Engineering Seminar Jacksonville, Fl. January
Good afternoon, Madame Chairman and members of the subcommittee. My name is
 STATEMENT OF RICHARD BERKOWITZ DIRECTOR, PACIFIC COAST OPERATIONS OF THE TRANSPORTATION INSTITUTE BEFORE THE U.S. SENATE FOREIGN RELATIONS SUBCOMMITTEE OF EAST ASIA AND THE PACIFIC U.S. SENATE DECEMBER
The Economic Realities of Water Transportation
 The Economic Realities of Water Transportation Wayne K. Talley Executive Director, Maritime Institute Frederick W. Beazley Professor of Economics Old Dominion University Short Sea Shipping Short sea shipping
Trade Update & Opportunity Outlook. Gene Seroka Executive Director, Port of Los Angeles May 19, 2017
 Trade Update & Opportunity Outlook Gene Seroka Executive Director, Port of Los Angeles May 19, 2017 2016 Re-Cap By Lines of Business -.5% +21% +8.5% Liquid Bulk (Petroleum) 93,223,412 barrels Autos (WWL)
Bottleneck between Ports and Railroads on the U.S. West Coast
 Bottleneck between Ports and Railroads on the U.S. West Coast Mr. Keny Chou Yang Ming Marine Transport Corp. 2015.09.12 1 Outline Intermodal Transport & U.S. West Coast Gate ports USWC IPI Bottleneck Solutions
Barriers to Global Trade Through Marine Ports Country Reports
 Barriers to Global Trade Through Marine Ports Country Reports University of Southern California Marshall School of Business Busan, Korea November 15, 2005 China Key Findings Measures in place to inspect
Assessing Productivity and Performance of Seaports:
 Assessing Productivity and Performance of Seaports: The Importance for Gateways Martin Dresner R.H. Smith School of Business University of Maryland Agenda Port of Baltimore Performing in a Competitive
Greater Vancouver Goods Movement Study
 Greater Vancouver Goods Movement Study Philip Davies Halcrow Consulting Inc. October 2007 Background The Lower Mainland is Canada s Gateway for Asia-Pacific Trade Transportation system congestion is a
American Association of Port Authorities Port Property Management and Pricing Seminar June 25, 2008 Toronto, Ontario
 American Association of Port Authorities Port Property Management and Pricing Seminar June 25, 2008 Toronto, Ontario Frank C. Brogan, PPM Port of Corpus Christi Authority Kevin G. Carney, Executive Director
Thinking Outside the Box: Macroeconomic and Inland Network Impacts on Port Competitiveness. Philip Davies Davies Transportation Consulting Inc.
 Thinking Outside the Box: Macroeconomic and Inland Network Impacts on Port Competitiveness Philip Davies Davies Transportation Consulting Inc. January 10, 2013 Table of Contents 1 Executive Summary...
Curtis D. Spencer, President IMS Worldwide, Inc.
 Curtis D. Spencer, President IMS Worldwide, Inc. About IMS Worldwide, Inc. IMSW has completed over 325 FTZ Projects during 45 years. We have conducted 36 Logistics/Drayage studies for Industrial RE firms,
Rail Intermodal Keeps America Moving
 Rail Intermodal Keeps America Moving Association of American railroads March 2018 Summary Rail intermodal the movement of shipping containers and truck trailers on railroad flat cars has been growing rapidly
SEARS UP Intermodal. Allison Watson, General Director March 26, 2014
 SEARS UP Intermodal Allison Watson, General Director March 26, 2014 0 Union Pacific Intermodal $4.0 Billion Revenue 2013 Volume Mix Seattle Tacoma Portland Sparks Minneapolis / St. Paul Council Bluffs
Conceptual Framework for Analyzing the MTS within the Intermodal System
 Conceptual Framework for Analyzing the MTS within the Intermodal System Dr. Mike Hilliard Center for Transportation Analysis Oak Ridge National Laboratory Dr. Ned Mitchell U.S. Army Engineer Research and
Port of Philadelphia Port Advisory Board
 Port of Philadelphia Port Advisory Board JULY 7, 2016 Meeting Overview: Natural flow of port development arising from the channel being deepened to 45 feet. Channel Deepening Project The Channel Deepening
Indianapolis Intermodal Terminal. Opening July 1, 2013
 Indianapolis Intermodal Terminal Opening July 1, 2013 1 The Indiana Rail Road Privately-held company, founded in 1986 Corporate headquarters in Indianapolis 500-mile system serving central and southwest
New options for supply chain efficiency from Asia to the Americas
 New options for supply chain efficiency from Asia to the Americas dpworld.ca/tpm For decades, shipping routes from Asia to the Americas have been dominated by a few well known logistics hubs southern California
North Carolina Offshore Energy Exploration Subcommittee. Mr. Jeff Keever Senior Deputy Executive Director Virginia Port Authority February 23, 2010
 North Carolina Offshore Energy Exploration Subcommittee Mr. Jeff Keever Senior Deputy Executive Director Virginia Port Authority February 23, 2010 East Coast Logistics Hub for Offshore Energy Exploration
Port Performance Statistics Fixing America's Surface Transportation ("FAST ) Act was signed into law on December 4, 2015.
 Act was signed into law on December 4, 2015.") Port Performance Statistics Fixing America's Surface Transportation ("FAST ) Act was signed into law on December 4, 2015. Section 6018 established the Port Performance Freight Statistics Program to measure
Port Performance Statistics Fixing America's Surface Transportation ("FAST ) Act was signed into law on December 4, 2015. Section 6018 established the Port Performance Freight Statistics Program to measure
Process for Port Master Planning
 Process for Port Master Planning Presented by Kerry Simpson, P.E. Vice President, Marine Terminals AAPA Port Executive Management Seminar Merida, Mexico December 2014 Moffatt & Nichol Founded in 1945 in