DOD RFID Shelf-Life Study, Phase II: Adaptive and Dynamic Shelf-Life Estimation
|
|
|
- Milo Hodges
- 5 years ago
- Views:
Transcription

1

2 DOD RFID Shelf-Life Study, Phase II: Adaptive and Dynamic Shelf-Life Estimation Ismail Uysal, Ph.D. Jean-Pierre Emond, Ph.D. College of Technology and Innovation University of South Florida Polytechnic
3 Today s agenda RFID lab at the University of South Florida Polytechnic and what we do Project definition, goals and requirements Testing protocol and accuracy metric Adaptive temperature estimation Shelf life algorithm and its implications on supply chain management

4 Our lab: RFID in transportation


5 Our lab: RFID in pharmaceuticals

6 Our lab: RFID in sensory monitoring


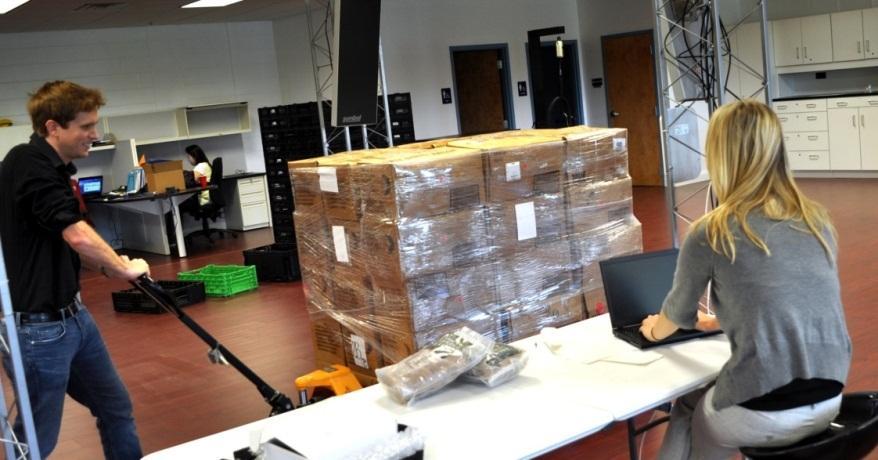
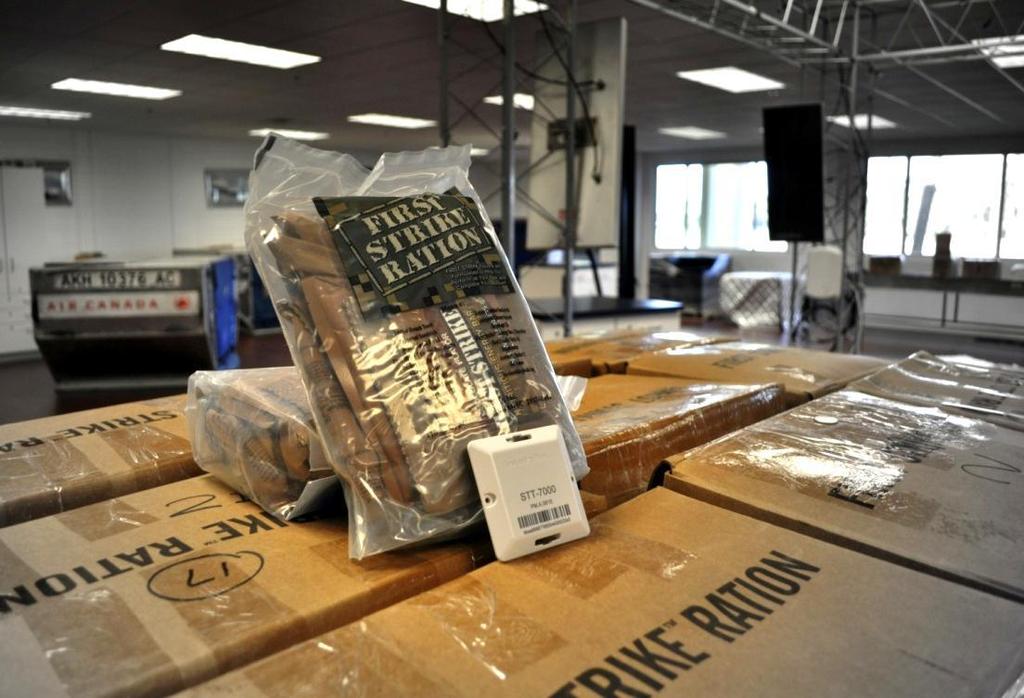
7 Temperature monitoring of First Strike Rations
8 Project definition Monitor the environmental temperature of First-strikerations (FSR): During shipment and storage 100% portable, RFID based solution Should be usable in the most remote locations Dynamically estimate remaining shelf life Any point in the supply chain or on the field
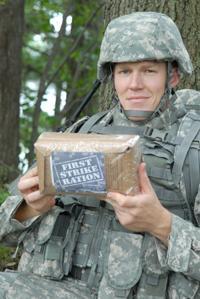
9 What is FSR? Army First strike rations (FSR) A semi-perishable product Two year shelf life under normal storage conditions Significant degradation under high temperature conditions
10 Research goals and requirements From a broad perspective Track the temperature of a shipped product During both storage and transportation Use radio frequency identification (RFID) enabled sensors Using the recorded temperatures Estimate its remaining shelf life prior to consumption First-expired-first-out (FEFO) over first-in-firstout (FIFO)
11 What does it mean? No more date of expiration printed on label A static date for assumed temperature conditions Advantages of dynamic shelf life estimation Improved food quality and safety Intelligent distribution practices FEFO vs. FIFO Advantage of using RFID Increased product safety, especially food and perishables Early (even real time) detection of refrigeration equipment failure
 FSR shelf life estimation studies Objective 2")
12 Two paths to follow (Engineering) RFID testing, system and software design - Objective 1 (Food Science) FSR shelf life estimation studies Objective 2
13 Participants The United States Army Natick Labs University of Florida University of South Florida Polytechnic Georgia Institute of Technology Franwell, Inc.
14 Project requirements Temperature sensors should be able to record and withstand temperatures between -30C and +60C (-20F to 140F). Ultra-high frequency (UHF) RFID system, preferably 915MHz. Standard and passive communication protocol. 2 year shelf life means at least 2 years of battery life. 100% portable solution. 6 to 10 feet read range from a side of the pallet.
15 Portable and passive Biggest challenges No passive RFID logger full-solution readily available on the market UHF 915MHz Eliminates majority of active technologies Standard and passive protocol Eliminates rest of the active technologies Temperature range Atypically wide for RFID sensors
16 Objectives Review state-of-the-art technologies on the market Develop a test setup and protocol to identify the most reliable technology Design a performance metric to identify the most accurate technology Design the necessary software tools to initialize, start, and read the temperature loggers to estimate shelf life on a handheld device.
17 A few words on testing protocol Common testing protocols Temperature (performed by manufacturer) Validate accuracy Validate reliability Vibration (performed by manufacturer) Validate operation Validate reliability
18 Proposed testing protocol Goes beyond simple temperature & vibration tests Realistic environmental simulation Real transportation parameters Temperature profiles of shipping lanes Vibration profiles for different modes of transportation Introduces a more definitive quantitative performance metric for comparison


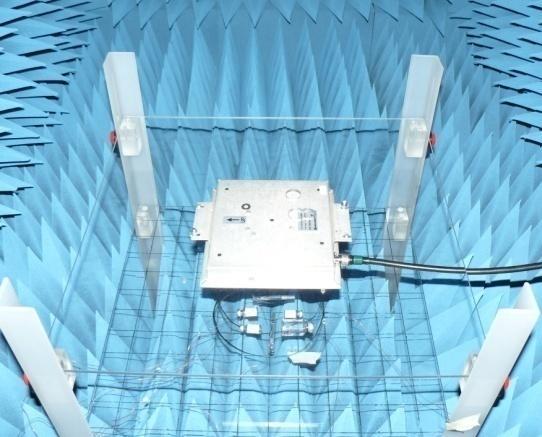
19 State-of-the-art test chamber Environmental testing Simultaneous simulation of vibration and temperature Realistic transportation profiles
20 Developed testing protocol Pure temperature accuracy analysis Requirement limits Higher resolution Environmental reliability and accuracy analysis Temperature + vibration Max range within system limitations Fully data driven
21 Temperature accuracy testing 80% requirement range span Temperature range within +/-10% of requirement range Higher resolution within the 80% span Faster temperature changes Extended requirement range span Prolonged exposure to requirement limits Longer temperature recordings at very high and very low temperatures Sharper temperature transition
22 Temperature accuracy testing Two point swing test Fully data driven Ship out loggers and monitor the supply chain Determine average maximum and average minimum temperatures Swing between the two temperatures with full 24- hour intervals to emulate shipping lane Multiple swings for prolonged exposure Freezing test Very critical for shelf life estimation Will the tag freeze within the requirement range?
23 Realistic Environmental Testing Transportation profiles Temperature Loggers on shipping lanes A priori information available Vibration Transportation modes: truck, rail, air Bounce test Both temperature and vibration variables change at the same time
24 Types of environmental tests Air, truck, rail vibration modes American Society for Testing and Materials 40C to -15C 15C to 48C Used accelerated testing with random vibration profiles Sine vibration 48C, 32C, 15C, 0C, -15C 3Hz to 100Hz octave / minute to ensure full sweep within 1 hour
25 Do we need to test with vibration? Tags might fail We had 3 tags fail, 2 from one manufacturer and 1 from another Tags might skip sampling instants due to loss of battery contact Accuracy drops Especially at low temperatures
26 When choosing the right technology Both accuracy and reliability matters Multi-step testing for accuracy, emphasis on extremes Temperature dependent reliability Comprehensive testing with real life parameters Performance metric is important!
27 Context based accuracy metric
28 Context based accuracy MSE Standard Deviation CBA Price Temperature Tag A $30 Temperature Tag B $15

29 Overcoming limitations of RFID Stuck in between!
30 Where you place the tag is important! Inside the pallet Better for monitoring the inside temperature Better for shelf life prediction Worse RFID performance Outside the pallet Worse for monitoring the inside temperature Worse for shelf life prediction Better RFID performance

31 Temperature estimation Instrument the pallet with temperature sensors Inside Outside Find a mathematical model to estimate the inside temperature from the outside temperature

32 Temperature profiles Multiple heat cool cycles Calculate heat exchange time constant Construct your estimator

33 Estimator works Much closer to product temperature than air temperature Average error is an order of magnitude less than air temperature (17C vs. 3C) Currently working on more sophisticated algorithms
34 Next step: Information processing Found the right technology Employed mathematical tools to improve efficiency Most important question now is: What to do with all the information? Pallet origin Pallet destination Temperature history First step -> shelf life estimation
35 Why quality monitoring? To provide visibility from farm to store and convert collected data into decision making information, including shelf life estimation of perishable products at predefined points along the supply chain
36 Benefits (Suppliers, distributors, retailers) Enhanced quality control (QC) decision making Reduce time to perform QC Enhanced dispute resolution Identification of breaks such as cold chain Better stock management Improve product recall plans Brand protection Reduce shrink Increase revenue
37 How? FEFO (First Expired First Out) Knowledge based smart decision making Determine food quality based on environmental factors FIFO (First In First Out) Not knowledge driven Creates greater amounts of waste
38 For FEFO you need dynamic shelf life Shelf life is the period during which a product retains its desired quality attributes Shelf life depends on a multiplicity of variables and their changes, including the product, the environmental conditions such as temperature, humidity, gas concentrations and also the packaging
39 Methods to predict shelf life Changes based on multiple quality factors as a function of individual commodity characteristics, handling temperature and time (Nunes et al ) More complex to construct Higher dimensional change-of-quality matrices Need to construct more models for each productquality pair Need better mathematical tools for estimation

40 From a 2D Approach to 3D Current model X - axis environmental variable Y- axis shelf-life Proposed model X - axis environmental variable Y - axis quality factor value Z - axis type of quality factor
41 Multiple quality based model
42 Multiple quality based model
43 What does a constructed model look like?
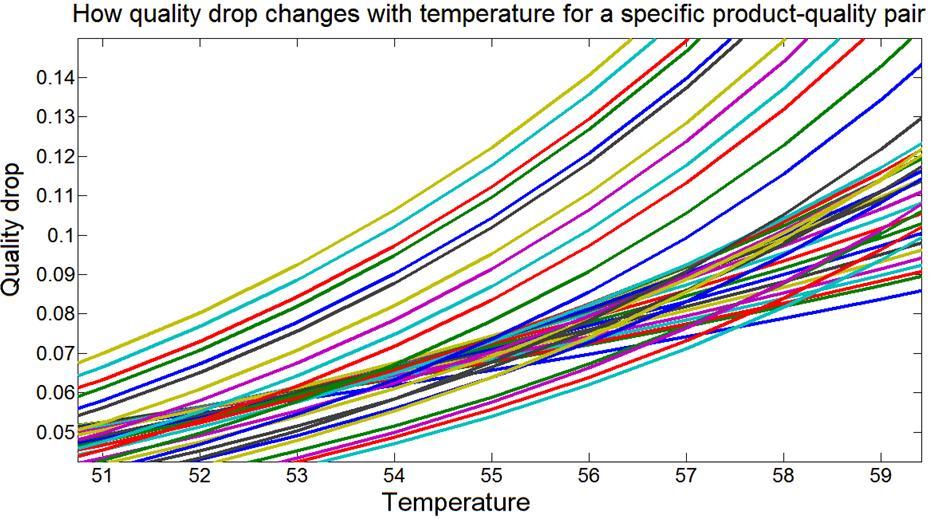
44 Up close
45 Model validation in real life FSR shelf life model has been completed Validation of the shelf life model and its supply chain management implications -> phase II activities Another example: a recent real life study done on a shipment of strawberries

46 Shelf Life Prediction Model Prior to departure Arrival at DC = 3 full days = 2 full days = 1 full day = 0 day


47 Typical Visual Inspection by the Retailer 22/24 = accepted 2/24 = rejected
48 Based on the Prediction Model 2 pallets never left origin 2 pallets rejected at arrival 5 pallets sent immediately to store 8 pallets sent to nearby stores 7 pallets with no special instructions = 3 full days = 2 full days = 1 full day = 0 day
49 What Happens at the Store? # Pallet FIFO Waste (SL + FEFO Waste) % (rejected) 5 53 % (25%) % (13.3%) 7 10% (10%) Provide safer products for consumers. Better quality and consistency of products in the stores throughout the year Waste reduction
50 Conclusions Adaptive and dynamic shelf life estimation with RFID How to find the most reliable technology Developed a universally applicable test setup and protocol to go beyond simple accuracy tests Novel context based accuracy over general accuracy How to overcome limitations of RFID Adaptive temperature estimation Dynamic in monitoring the entire temperature history Dynamic with on demand shelf life estimation 50
51 Conclusions Fully portable, ready to be used in remote locations No infrastructure required Handheld software development including shelf life implementation completed System and model validation in phase II with FSR pallets Full database interfacing in phase II to enable FEFO practice over FIFO Temperature based multiple quality models are: Accurate Ensures higher quality and safer products for consumers 51

52