Traffic Control in Action. Prof. Markos Papageorgiou Dynamic Systems and Simulation Laboratory, Technical University of Crete, Chania, Greece
|
|
|
- Bruno Jeremy Pope
- 5 years ago
- Views:
Transcription
1 Traffic Control in Action Prof. Markos Papageorgiou Dynamic Systems and Simulation Laboratory, Technical University of Crete, Chania, Greece


2 1. INTRODUCTION Man has reached to the moon but even ants were taught by evolution to address their transportation problems more efficiently, see I.D. Couzin and N.R. Franks: Self-organized lane formation and optimized traffic flow in army ants, Proc. R. Soc. Lond. B (2003) 270,
3 Minimization of Total Time Spent Maximization of (Early) Exit Flows 3
4 Simple Queuing Systems Demand > Capacity Queuing Capacity f (Queuing) Delay depends on D C only! Water Systems More Inflow Higher Pressure Higher Outflow 4
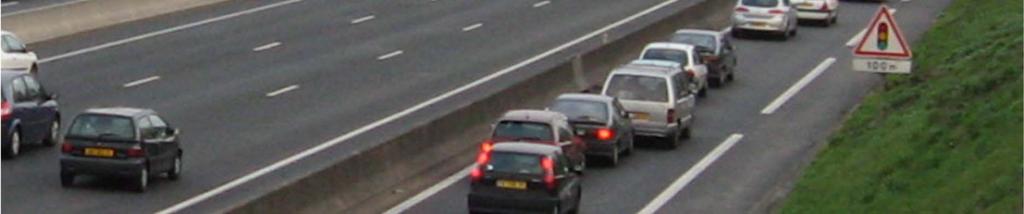
5 Traffic Networks Congestion degrades the infrastructure (capacity) Local link demand exceeds local capacity Local congestion degrades local capacity Accelerated increase of congestion Further capacity degradation... until generalized network congestion although Demand << Nominal network capacity 5

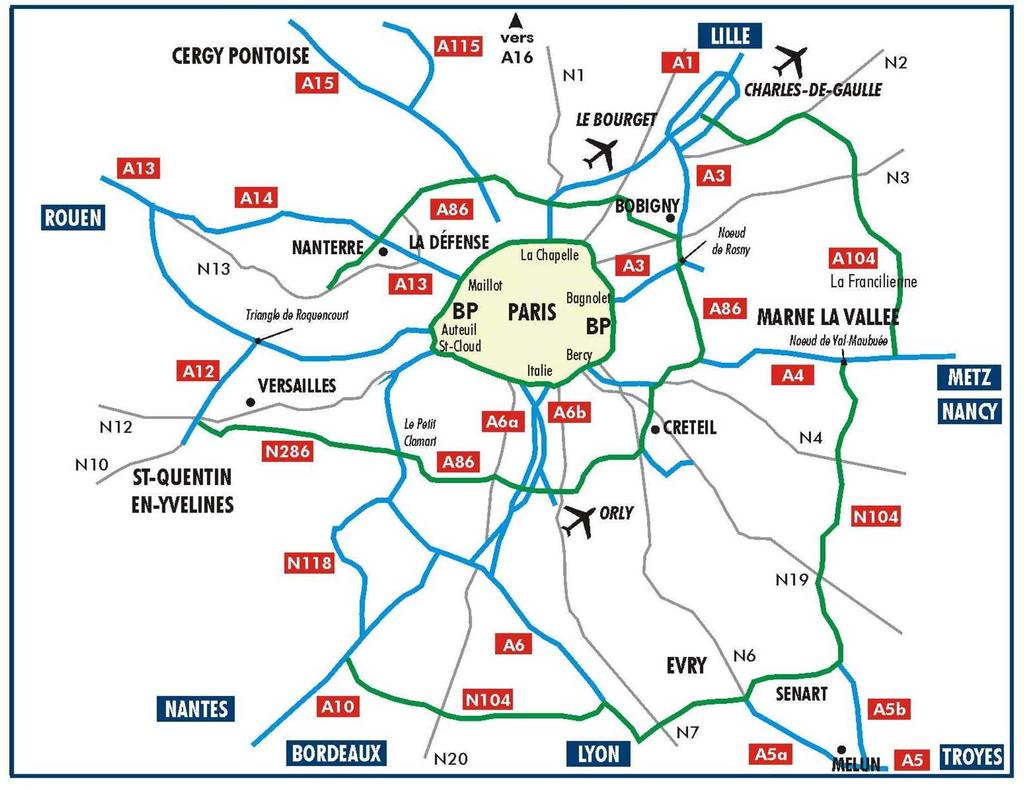
6 Ile-de-France Expressway Network 12 January 2011, 8:14 am 6
7 Conclusion: Generalized traffic congestion is not only due to high demand. Congested Traffic Networks: Expensive infrastructure capacity not fully available at the only time it is actually needed, i.e. the peak periods! Goal: Operate traffic networks optimally (as a controllable system) 7
8 Inputs Actuators Process Sensors Outputs Measurements Disturbances REAL WORLD Control Strategy Data Processing COMPUTER Goals Basic elements of an automatic control system 8

9 2. RAMP METERING 9
10 Why Ramp Metering? 1 st Answer q in q con d qin qcap d 10
11 2 nd Answer qin qcap d qcap 1 qcap d d q in q cap q in Note: On-ramp queue should not interfere with surface street traffic. d 11
12 Local Control Issues qin oout qin oout rk ( ) q q k 1 cap r q cap in rk ( ) rk ( 1) K[ˆ o o ( k 1)] ô r R out Note: o cr is less sensitive than q cap (e.g. under adverse weather conditions). 12
13 Sample from Glasgow Implementation of ALINEA 13
 Slave Ramps Cluster: Master + Slaves HERO MIMO Feedback: Balance relative")
14 HERO Feedback Coordination ALINEA Activation? Master Ramp HERO hires gradually (upstream) Slave Ramps Cluster: Master + Slaves HERO MIMO Feedback: Balance relative ramp queues in Cluster (create 1 super-ramp) Cluster de-activation logic 14
15 HERO Implementation at the Monash Freeway, Melbourne, Australia Test pilot: 6 consecutive ramps Significant improvements in all PI: Productivity, Speed Variation, Reliability 11 days payback period! 15
16 AM PEAK Typical day (Fixed Time) Bottleneck created due to large number of lane changing 16
17 AM PEAK Typical day (ALINEA/HERO) Bottleneck cleared 17


18 PM PEAK Typical day (No RM) Bottleneck created due to merge at Forster ramp


19 PM PEAK Typical day (ALINEA/HERO) Bottleneck cleared 19


20 Currently: HERO extension to 65 ramps, i.e. whole freeway, 75 km, both directions 20

21 3. VARIABLE SPEED LIMITS 21
22 Many application stretches in many counties Impact: homogenisation of traffic flow Traffic safety: 20-30% accidents Travel times: questionable impact of existing systems Simplistic control strategies 22
23 Switching plan Speed indications at subsequent VSL-stations 23
24 Parameter estimation at one particular location A = 0.42 E = 3.16 leading to capacity increase by 8% 24
25 Other location A = 0.7 E = 1.9 no capacity increase! 25
26 Feedback MTFC 26
27 4. ROUTE INFORMATION AND GUIDANCE Multi-origin, multi-destination, multi-route per O-D pair Fixed direction signs: shortest path in absence of congestion Rush hours Changing demands, weather conditions, exceptional events, incidents underutilisation of infrastructure congestion, delays, reduced safety, increased fuel consumption, environmental pollution 27
28 28
29 VMS (Variable Message Signs) or two-way communication with equipped vehicles Real-time information: Drivers knowledge Message length Decision efficiency System controllability Travel time or queue length: drivers stress (e.g. BP in Paris) but also basis for route choice Instantaneous (estimation) or predicted information Route guidance Control strategy 29
30 Issues Modelling: micro, meso, macro Integrated Optimal Control: AMOC User vs. System Optimum Instantaneous vs. Experienced travel times Algorithms: feedback vs. predictive feedback vs. iterative 30

 and route")
31 Automatic Control of VMS in Aalborg, Denmark Aalborg network with VMS positions indicated. Bold black lines represent detector equipped segments. VMS control modes: Delay information (a) and route guidance (b). 31

32 Automatic Control of VMS in the Interurban Scottish Highway Network 32
33 5. TRAFFIC SIGNAL CONTROL Original reason for traffic lights: safe crossing of antagonistic streams of vehicles and pedestrians Once they exist, they can be set in different ways. Which is best? Optimisation problem Difficulties: Binary variables Large dimensions Many disturbances Difficult measurements Real-time constraints Many control strategies, both heuristic and systematic 33
34 2-D Fundamental Diagram for urban networks (PhD-Thesis by Geroliminis, 2007; Fahri, 2008) total network flow or flow of exiting vehicles (veh/h) veh in network undersaturated; minimise delays! saturated: maximize capacity! oversaturated: queue management, gating! blocked: call the police or walk home! Caution: Different underlying phenomena than on link FD 34
35 Real-time Signal Control Strategies/Systems Isolated Traffic actuation, MOVA Network-wide Plan selection SCOOT, SCATS, UTOPIA, MOTION, OPAC, (partially strong communication requirements) Saturated traffic conditions 35
36 Store-and-forward based strategies TUC and variations Cycle-to-cycle changes Low communication requirements Perimeter gating control 36
37 Replication R2 37
38 6. PUBLIC TRANSPORT PRIORITY Refers to all types of public transport vehicles (buses, trams, trains, etc. and even emergency vehicles) Technological implications special detection technologies programmable controllers sec-by-sec communication with the controllers Implications for the road traffic Frequent disturbances of signal control may lead to significant negative implications to road traffic Recovery methods may not be sufficient to avoid negative implications 38
39 Multiple approaches: Included in signal control strategies Easier: one PT vehicle at a time More challenging: multiple PT vehicles! Good improvements reported 39
40 7. MERGING TRAFFIC CONTROL Merging traffic infrastructures (Μ μ lanes) If arriving Merging flow of two on M highways lanes > Capacity of μ lanes Congestion Motorway on-ramps Capacity drop Toll plazas Merging traffic control to restore capacity flow Motorway work zones Tunnels. Structure and Elements 40

41 Simulation Example: Toll plaza San Francisco-Oakland Bay Bridge 5; 10,500veh/h q cap M AVD (s/veh/km) Replications Mean AVD no-control Maximum AVD no-control 0 Mean AVD with control Minimum AVD no-control ˆN (veh)
42 Work Zone Control 1; 2,300veh/h q cap M 3 K R 42

 WZ")
43 Different layout (now using PI-ALINEA) WZ No Control video 43


44 WZ Control video 44
45 8. Conclusions Traffic flow can be substantially improved (in some cases -50% travel times) via traffic control Technological giants with a baby brain Methodological zombies Nothing is more practical than a good theory As simple as possible as complex as necessary General applicability, high efficiency Field applications needed 45