Capital Metro Transit Development Plan: Executive Summary January 2017
|
|
|
- Cecily Martin
- 5 years ago
- Views:
Transcription


1 Capital Metro Transit Development Plan: Executive Summary January 2017 Prepared by: PAGE 1 OF 26
2 Introduction Capital Metro s Connections 2025 is a transit system study that aims to rethink public mobility in Central Texas. The study, conducted over a year by Transportation Management and Design (TMD) Inc., is the latest in a series of reviews commissioned by Capital Metro every five years. With this study, the agency wanted to address declining ridership, changing demographics, population growth and emerging new development that has resulted in increasing roadway congestion. Connections 2025 seeks to address both short-term (five years) and longer-term (10 years) public mobility needs and opportunities within a sustainable financial plan based on current and potential increased funding. This study reviewed the broader network structure and route-specific performance to provide Capital Metro with a comprehensive understanding of its market conditions and service performance. The findings led to the development of phased recommendations designed to build upon the network s market opportunities and performance strengths, maximize ridership, improve the overall rider experience and ensure the system s financial sustainability. The recommendations are based on boardestablished goals, analysis of existing and future market conditions, service performance data and feedback from Capital Metro riders and key stakeholders. Connections 2025 is intended to help guide transit service development over the next decade. Goals and Focus The primary goal of Connections 2025 is to develop a plan that will grow Capital Metro ridership while using vehicle and labor resources more efficiently. As population and employment grow and demographics shift, it is important to reshape transit service to respond to new and changing public mobility demands. It is also critical that Capital Metro implement system improvements in a financially sustainable manner. Connections 2025 maximizes the performance of existing services while responding to new community mobility needs. The overall strategy is to enhance service on key network routes to increase ridership and generate more fare revenue, while maintaining mobility options in lower potential ridership areas. The recommendations also respond to key issues identified by the community to create a system that is more attractive to riders. Connections 2025 addresses regional mobility issues of both existing and potential riders. To that end, the project accomplishes the following: Improves transit network design to increase ridership and improve public mobility Uses operating resources more effectively and efficiently Builds advocacy and ownership within the community Defines transit s role in public mobility and economic development 2

3 Study Process The study began in October 2015 with an extensive data collection effort. Data was collected from automated data collection systems to analyze rider activity, travel time and on-time performance information on all fixed-route trips operated by Capital Metro. In addition, more than 5,000 surveys were collected in-person and online, providing valuable information on the demographics and travel preferences of Central Texas residents. Public outreach was conducted at community centers, college campuses, neighborhood gatherings and major transfer hubs to gain feedback from the public on improvements they would like to see in Capital Metro transit services. A summary of the study timeline is shown in Figure 1. Figure 1: Connections 2025 Timeline The findings from the data collection and public outreach efforts provided the key inputs for an analysis of market and performance trends. This analysis was the basis of the Market Assessment and Service Evaluation reports, which each identified key findings and strategies to improve the Capital Metro transit network. These findings and strategies were used to develop the service framework, which guided development of the draft Connections 2025 recommendations. (Figure 2) This draft network was presented to the public and key stakeholders between August and October 2016 in order to gather feedback on the proposed changes. This outreach engaged over 3,200 citizens in person. Comments received were incorporated into the revised recommendations presented in the final Connections 2025 Plan. 3

4 Figure 2: Connections 2025 Study Process Existing Conditions The Market Assessment and Service Evaluation reports detail the existing conditions in Capital Metro s service area. The findings from these documents helped develop the guiding principles and framework for the final recommendations. 4


5 Market Assessment Key Findings The Market Assessment utilizes key demographic data to evaluate the market demand for transit and to help identify opportunities to increase ridership and meet unfulfilled mobility needs. Key findings from the Market Assessment include: Regional Growth: Central Texas is expected to continue growing at a high rate. Many regional initiatives like Project Connect, Capital Metro s Service Expansion Policy and suburban Transit Development Plans (for cities outside the Capital Metro service area) are already working to address that growth. Leveraging the critical link between land use and transit is a terrific opportunity for the city of Austin, Travis County and Central Texas to absorb this massive economic growth without compromising quality of life. Development Patterns: The automobile-centric development patterns present in Central Texas, particularly its suburban and rural areas, create many disincentives to use transit. Coupled with low gas prices and free or employersubsidized parking, the challenges of designing attractive transit routes and efficient networks are not solvable without rethinking land use development patterns. The region s massive growth forecast requires transit to significantly increase its mode share if the expected traffic congestion impacts are to be minimized. However, much of the new development is expected to be concentrated in already developed areas a strong positive outlook for costeffective transit ridership growth and managing congestion. Concentrating new Travis County development along key mixed-use corridors and within existing population and employment centers will lead to more livable communities with transit-supportive densities and transit-oriented development (TOD). Affordability within Austin: The increasing cost of land and housing in central Austin has driven development to the city s periphery and beyond. Many residents, especially in lower income households, can no longer afford to live in areas with access to the High-Frequency Route Network. The more expensive short-term solution is to bring public transit to affordable housing. The more cost-effective, sustainable, longer-term solution would be locating affordable housing within Capital Metro s High-Frequency Route Network. 5

6 Employment Centers Outside of Core: As is the case anywhere there is a surplus of developable land, many large Central Texas employment centers have located in areas that are low-density and outside major mixed-use corridors. Developing high-ridership services to these areas will require partnering in both creating new last-mile access that connects riders from mobility hubs to their employers, and rethinking development that concentrates access around mobility hubs. Student Population: Student travel associated with the University of Texas and Austin Community College (ACC) will continue to be a strong Capital Metro ridership constituency. Actual enrollment figures for both will continue to rise, with UT enrollment increasing 16 percent and ACC 8.5 percent by Increasing student use of transit for non-school related trips by creating a more robust High-Frequency Route Network will grow ridership cost-effectively. Low Gas Prices: Gas prices both nationally and within Texas have decreased dramatically over the last five years, making automobile travel a more attractive option than transit for many people. The Austin area has even lower gas prices than the national average (currently, $2.11 versus $2.35 per gallon). As a result, it is less costly to drive, which makes increasing discretionary transit ridership more challenging. City Initiatives: City of Austin initiatives like Imagine Austin and the forthcoming update to the Land Development Code (CodeNext) focus on policies and goals that would direct development to be more compact, connected and sustainable. This includes encouraging denser, mixed-use development along transit corridors, where such land uses support transit ridership. Partnering with the city of Austin and other jurisdictions on their land use planning efforts is essential to Capital Metro s rethinking of public mobility in Connections Texas Higher Education Coordinating Board Enrollment Forecast 2015 to


7 Service Evaluation Key Findings The Service Evaluation provides an analysis of the system s fixed-route performance, highlighting strengths in the system and opportunities for improvement. It examines network and route ridership, service efficiency, cost effectiveness, on-time performance and service levels. Key findings from the Service Evaluation include: High-Frequency Route Network: Capital Metro has taken the first steps to build ridership through the implementation of the High-Frequency Route Network. Since 2014 Capital Metro has improved weekday service on several route corridors to 15 minutes or better. In addition to UT Shuttle service, the two current MetroRapid routes operate as frequent as every 12 minutes. The target frequency for spontaneous use is every 10 minutes (; the threshold where riders no longer need to consult a schedule). Weekend service is less frequent, with corresponding lower ridership. The full benefit of high-frequency transit will be realized when additional routes integrate into a more robust High- Frequency Route Network that provides access to a greater percentage of the population, jobs and travel destinations all week. Further development of this High-Frequency Route Network is a key strategy of Connections Lack of Network: Capital Metro today remains a route-oriented service, with many routes operating along the same corridor before branching out to different locations. Additionally, Commuter routes often provide very limited one-seat rides that may be better served through feeder routes into a frequent service. The lack of network synergy that caters to broad market segments and is attractive for all kinds of trips reduces the utility of the Capital Metro system as a whole. Connections 2025 will focus on growing and expanding a High-Frequency Route Network that is easy to understand, use and operate. Matching Services to Markets: Ridership and service performance on the UT Shuttles are significantly stronger than the remainder of Capital Metro services. Part of the success of these routes is attributed to identifying the key market provided by dense student populations with a single, shared daily destination, the UT campus. As noted in the Market Assessment, further integration of these routes with the mainstream Capital Metro High-Frequency Route Network should be pursued to strengthen UT-area commuting while enhancing student transit use beyond just school trips. Other services such as senior shuttles and school trips should be tailored to meet specific community needs. 7

8 Enhanced Facilities: Capital Metro has a large number of well-located transit centers and Park & Rides that allow for the development of an enhanced High-Frequency Route Network. Transit center locations will likely change over time as ridership and transfer patterns evolve. New mobility hubs should be placed in locations where key transit corridors meet and provide links between the High-Frequency and basic coverage networks. These transit centers should also provide opportunities for riders to connect seamlessly with other mobility options, such as car-, ride- and bike-sharing services, public or private shuttles and pedestrian/bike trails. Optimizing these locations will be a key to ensuring they function efficiently for both Capital Metro operations and for customers transferring. They will need to facilitate rider connections, address parking needs and provide operator rest facilities. Additionally, Park & Rides need to be located at sites easily accessible to commuters, allowing them to integrate effectively into the transit system. Low Farebox Recovery: Capital Metro recovers slightly more than 10 percent of its costs through fares. improving this rate will generate funding for additional service while supporting financial sustainability. Increasing fares now would negatively impact ridership and should therefore be delayed until riders and the community recognize the value of a more frequent, more connected transit network provided by Connections However, the other elements in raising farebox revenue carrying more riders per revenue hour (effectiveness) and using vehicle and labor resources to better advantage (efficiency) are central themes in Connections Fare Structure: Capital Metro s previous three-tiered fare structure consisted of Local, Premium and Commuter fares. The tiered system encouraged riders to select the cheapest service but not the best service for them or the most cost-effective service for Capital Metro. Connections 2025 migrates away from just trips and routes (commute thinking) to a frequent network that also supports lifestyle mobility (live-work-play transit). Additionally, an integrated fare approach that encourages riders to use transit in conjunction with other third party mobility providers (e.g. bike and carsharing) should also be considered. Capital Metro s board of directors has already chosen to implement a simpler, flatter fare structure in response to recommendations from Connections The Premium level was discontinued, effective January 8,
9 Community Input Key Findings Public outreach was integral to the Connections 2025 process, and substantial efforts were made throughout the project to better understand what service changes and priorities the public would like to see. Outreach included public open houses, presence at community events, rider drop-in sessions at transit centers and stakeholder meetings. At these events, participants shared their priorities for service improvements. In addition to these in-person outreach events, more than 6,000 comments were collected and analyzed through the Connections 2025 website via surveys and s. Key findings from the public outreach are illustrated in Figure 3 and 4. Figure 3: I would ride Capital Metro more often if Buses ran more frequently Routes were closer to my home or destination Service was faster Service started earlier or ended later Other Buses were more reliable Fares were lower I could park and ride Service was easier to use I felt safer There were more bike racks on buses Buses were less crowded 0% 10% 20% 30% 40% 50% 60% Source: Online survey, 3,669 responses. Figure 4: Transit Priorities from February Open Houses Wifi/ Technology, 6% Direct Service, 7% Simplified Fares, 4% Frequency, 22% Shelters, Benches, Lighting, 8% Late Night/Weekend Service, 8% Easy to Transfer, 8% Park & Ride, 9% Coverage, 12% Reliability, 15% 9
10 Framework and Guiding Principles Based on the findings of the Market Analysis, the Service Evaluation and input gathered from the public and stakeholder groups, goals were formulated to guide the development of short- and long-term recommendations for future Capital Metro service. These goals are achieved in Connections 2025 through the Service Design Principles. Goal 1: Build Transit Constituency In order for transit to be successful in the greater Austin area, the constituency for Capital Metro service must be broadened and strengthened. Strong support from the community and key stakeholders is needed to build the partnerships and make the changes necessary to improve public mobility in Central Texas. A broader transit constituency encourages more people to ride transit with a greater number of people recognizing the value of transit s role in public mobility. Building transit constituency is fostered by a Capital Metro plan that increases ridership, is responsive to community priorities and supports mobility partnerships throughout the service area. Goal 2: Improve Transit Attractiveness Capital Metro can only be successful if it provides a service that consumers want to use. In order to be attractive to consumers, Capital Metro must provide a service that is competitive with other modes of travel, especially with automobile travel. Enhancing the customer experience will both attract new discretionary riders and encourage existing riders to use transit more frequently and for more trip purposes. This can be achieved by decreasing wait times and travel times, improving facilities and reliability, and making the network easier to understand and use. Streamlining route alignments also improves the customer experience by reducing travel time and providing more direct trips to more riders. Creating an all-day, all-week comprehensive transit network with streamlined route alignments and higher service frequencies will provide an enhanced customer experience that will attract riders to use transit for more of their variable daily trips. Goal 3: Ensure Financial Sustainability Financial stability allows Capital Metro to maintain an effective and robust transit network. Since Capital Metro is working with limited financial resources, focusing on route and network improvement that will yield a higher return on investment (more riders and fare revenue) supports financial sustainability. Improving routes that are already successful will generate more ridership and fare revenue for Capital Metro. Tailoring service to specific markets will help ensure that resources are being used effectively. 10


11 Service Design Principles The following service design principles were selected in collaboration with the Capital Metro board of directors to meet the goals set forth in Connections The specific plan recommendations for Capital Metro service are guided by these design principles. Figure 5: Service Design Principles Easy to Understand Network Stronger Frequent Network Match Service to Markets Concentrate on Key Customer Experience Attributes Complement Emerging Mobility Initiatives Grow Ridership and Productivity Lay the Groundwork for the Future Coordinate Land Use, Housing, Infrastructure 11
12 Connections 2025 Plan The Connections 2025 Plan establishes a more frequent, more reliable and more connected transit system. Recommendations balanced data-driven findings from the Market Assessment and Service Evaluation with community, stakeholder and staff input to maintain required network coverage while improving service on high-performance routes, maximizing system ridership. After the development of draft recommendations, the project team conducted a round of public outreach between August and October 2016 that sought feedback on the proposed draft plan. During the public comment period, more than 3,200 people attended public outreach events and another 1,500 comments were received online. At the close of the public comment period, the project team reviewed the comments on the proposed changes and updated the final plan to reflect rider concerns. This sections includes an overview of the proposed service products and tiers and their role in the Connections 2025 network, a summary of the Connections 2025 Plan recommendations, required capital upgrades, and implementation phasing. Service Tiers One of the key strategies for achieving the goals of Connections 2025 is to make sure that Capital Metro is effectively matching service to different markets. Using a mobility toolbox consisting of multiple service tiers will allow Capital Metro to meet the various demands found in different markets. The service tiers vary in service frequency, types of vehicles used, operating speed targets and roles filled. Figure 6 illustrates the service tiers included in the mobility toolbox. 12


13 High-Frequency Route Network (All-Day, All-Week Service with 15-minute or better frequencies) Figure 6: Service Tiers 13
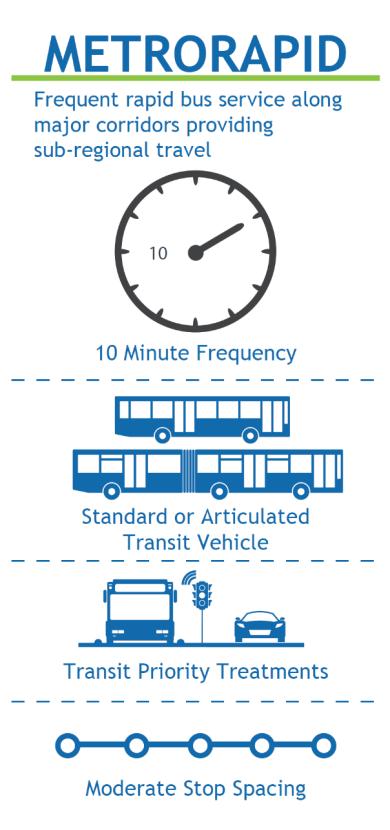
14 High-Frequency Route Network (All-Day, All-Week Service with 15-minute or better frequencies) Rapid Transit: Rapid Transit consists of services that provide fast, frequent, regional service along a dedicated right-of-way using high-capacity vehicles. MetroRail is an example of Rapid Transit. These routes serve as the structural spine of the network and are an integral part of the all-day, all-week service. MetroRapid: MetroRapid is frequent and fast bus service along major corridors providing short and medium distance travel. MetroRapid would offer the highest levels of frequency in the Capital Metro network, providing service at least every 10 minutes. MetroRapid routes would have moderate stop spacing to reduce travel times while maintaining convenient access. This service benefits from enhanced transit infrastructure, including transit signal priority, station upgrades, all-door boarding and, along key segments, dedicated or transit priority lanes. MetroRapid complements the Rapid Transit service tier to form the key structural spines of the Capital Metro transit network. Frequent Local: This service operates every 15 minutes or better on transit-supportive corridors and completes the all-day, all-week High-Frequency Route Network, which will carry over ¾ of the system s transit riders. Due to their high frequency and linear alignments, Frequent Local routes facilitate effective connections within the Capital Metro network. Local: Local services complement frequent services by completing and extending the fixedroute network. Local routes provide service every 30 minutes with additional peak service if warranted. Supporting Local routes operate in areas where land use patterns, population and employment densities, and/or travel patterns do not support frequent transit service. Local routes serve a key role as a connection between communities and the High-Frequency Route Network and major destinations. Express: Express service provides longer-distance, peak-hour commuting travel between key regional destinations. It provides faster travel times by operating on freeways and, when available, on the new MoPac Express Lanes. In order to provide a competitive commuter option, Express services focus on Park & Ride facilities for community access. Depending upon demand levels, service may be provided with an over-the-road (OTR) transit bus, vanpool or microtransit ondemand ridesharing. The latter two options may use Park & Rides and destination hubs or provide direct home and work pickup. Community Services: Community Services provide local mobility as circulators for shortdistance neighborhood trips or as first-mile, last-mile connections to the core transit network. Fixed-route community circulators provide all-day service in areas with a high demand for shortdistance community travel. In areas where demand is insufficient to support fixed-route operations, innovative community mobility options will be available. 14
15 MOBILITY INNOVATION ZONES Innovative community mobility options include: Shared-ride or microtransit option: Using vehicles smaller than a standard-size transit bus, this service allows riders to travel within a designated area or connect with the core transit network by requesting an on-demand service; riders can request a ride either through a mobile app or telephone call. Van: Provides connections to or from the core transit network via a shared-ride option. These are most often last-mile connections to businesses, schools and other destinations from key network mobility hubs with the destination partnering with Capital Metro. Car share: A hub-based solution that allows users to access a shared vehicle like Car2Go or ZipCar. Carsharing provides both local community travel and first-mile, last-mile connections to the core transit network. It is completely flexible to the consumer s mobility needs. Destination shuttle: Provides both local community travel and first-mile, last-mile connections to the core transit network to destinations with specific mobility needs. Examples include company shuttles providing connections to regional mobility hubs or grocery shuttles that provide community access to stores. Additionally, these may be used during midday or evening hours when fixed-route bus service might not be available. 15
16 Plan Summary Connections 2025 refocuses the system around a best practices approach to what works: deliver a comprehensive network of frequent transit; simplify system understanding and use; and reduce delay for both consumers and operations to improve reliability, effectiveness and efficiency while minimizing the impact on current riders. These include a variety of treatments including relocating stops to be after intersections ( far-side ), reducing time spent at bus stops through all-door boarding and off-board fare payment, and increase the time spent travelling through bulb-outs, queue jumps, and transit priority lanes. Key highlights of the service plan include: Introduce an all-day, all-week frequent network (every 15-minutes or better) Create two new high-frequency MetroRapid routes serving Riverside Dr., Manor Rd. and 7th St. Consolidate MetroRapid and Local service on 1/801 and 3/803 to provide fast, frequent MetroRapid service with added stations every 1/4 to 1/3 mile apart. Expand frequent Local service from 4 routes to 13 routes. Integrate MetroRail into core network with new 15-minute service. Add frequent weekend service. Introduce consistent core network service hour span together with 24 hour MetroRapid service. Connect frequent network to community mobility options with new and reimagined mobility hubs. Improve reliable, regional connectivity Add streamlined east-west routes to expand trip-making options and better connect neighborhoods. When proposed managed lanes allow for it, create new IH-35 BRT route to improve mobility on one of the nation s most congested roadways. Add new and realigned Express bus routes using MoPac Express Lanes. Simplify fare structure Introduce consistent fare structure on MetroRapid and Local service to provide seamless core network travel. 16
17 Introduce new Mobility Innovation Zones Replace underused fixed-route transit with new, innovative mobility options through a pilot testing process (shared-ride or microtransit, TNCs, partner shuttles, stations vans/cars 2, bike/carsharing). Connect various modes through community mobility hubs. 2 Station vans/cars is a privatized carsharing option where employers buy vehicles and park them at the station so employees can drive them back and forth to get to/from work. 17

18 Figure 7: Connections 2025 Network Map 18


19 Capital Program Connections 2025 outlines major capital projects to enhance both the customer experience and the efficiency and reliability of service operations. It would also include a fleet adjustment needed to implement the 10-Year Transit Network Plan. Fleet The full Connections 2025 plan requires 25 fewer vehicles to operate compared to the existing service. However, a fleet adjustment will be needed to operate MetroRapid service with eight additional articulated vehicles for MetroRapid Route 801 service with improved frequencies. Mobility Hubs/Park & Rides Mobility hubs integrate multiple forms of transportation at a single community location to allow users to choose the mode that best meets their travel needs for a particular local trip. Mobility hubs also provide an excellent connection point to the core Capital Metro transit network. Transportation modes and facilities that can be located at mobility hubs include, but are not limited to: Source: Capital Metro transit service, bike storage, B-cycle stations, parking for carsharing services (car2go), pickup and drop-off points for taxis/tncs, parking for private vans and shuttles, and electric charging stations. Private vans and shuttles can provide first-mile, last-mile access to residents or employees. Major mobility hubs are proposed at Hancock Center (with a new MetroRail Station) and Riverside Drive at Pleasant Valley. Funding for Capital Metro to partner on smaller on-street mobility hubs (like the current downtown MetroRail station) is also included in the plan. New Park & Rides would be proposed for the following locations: Oak Hill MoPac Expressway at Slaughter Lane Four Points (FM 2222 at FM 620) Southeast Metro Park (U.S. Highway 71 and Ross Road) Southpark Meadows 19

20 MetroRapid Stations The consolidation of Local bus and MetroRapid service on South Congress Avenue, Lamar Boulevard, Burnet Road and Manchaca Road, as well as new corridors on Riverside Drive, Manor Road and 7th Street requires additional infrastructure to be built. Based on an average distance of ⅓ mile between stops to maintain short walk access, approximately 75 station pairs would need to be installed. These would have the additional MetroRapid amenities such as real-time information signage, benches and shelters. Transit Priority Transit priority measures reduce delay and speed up travel times. At full implementation of transit priority measures throughout an entire corridor, running times can be expected to improve by percent. The following measures are recommended: Transit Priority Lanes: Transit priority lanes facilitate the movement of buses by providing an uncongested lane for bus operation. Expansion of the priority lanes beyond those already proposed by the city of Austin are recommended on the following corridors: o o o South 1 st Street Bridge Guadalupe between MLK and 38 th Street 7 th Street between Guadalupe and IH-35 Transit Signal Priority: Transit signal priority (TSP) facilitates the movement of buses through signalized intersections by providing early or extended green time, which reduces delay from traffic signals and improves service speed and reliability. In addition, optimized corridor signal synchronization can minimize the need for TSP and further reduce unnecessary transit delay. Bus Bulbs: Bus bulbs are curb extensions that allow buses to board and alight passengers while remaining in the traffic lane. They eliminate the need to merge in and out of traffic, reducing delay while improving safety. Queue Jumps: Queue jumps are short bypass transit lanes located at the nearside of intersections that allow buses to move past traffic queues and receive an early green signal to move ahead of traffic. Queue jumps are an effective method of improving bus travel times and reliability in areas of high traffic volumes. Far side stop placement: Far-side stops are located immediately after an intersection, allowing the vehicle to pass through the intersection before stopping for passenger loading and unloading, preventing the bus from having to sit through multiple light cycles (which also allows an optimal use of a transit signal priority system). When the bus needs to reenter traffic, traffic signals generate periodic gaps in traffic flow. Far-side stops require shorter deceleration 20

21 distances and provide for additional right turn capacity by eliminating bus blockage within the curb lane on the approach to the intersection. Additionally, the location of the stop encourages pedestrians to cross behind the bus, improving passenger safety. All-Door Boarding: All door boarding allows passengers to board the vehicle through all available doors reducing time spent at bus stops due to people queueing to board the vehicle. Other cities, like San Francisco, have implemented all-door boarding by allowing pass holders to board through the back door, leaving the front door to board cash passengers. MetroRapid currently has this system in place where people can purchase fares while waiting for the bus at ticket vending machines or through the Capital Metro smartphone application (passes only). Connections 2025 proposes focusing on an enhanced smartphone application that allows for purchase of all fares with fare capping, consistent with industry direction. The ticket vending machines are expensive to install, maintain and service and if credit cards are allowed, have significant annual security software costs. IH-35 BRT As part of the improvements to the IH-35 corridor, Capital Metro would utilize TxDOT s planned managed lanes to provide regional bus rapid transit (BRT) service between Tech Ridge and Southpark Meadows via downtown Austin. Stations would be constructed in a dedicated right-of-way with direct access to the managed lanes. The stations would provide convenient, reliable connections to the High- Frequency Route Network at the following locations: North Central South Howard Lane (Tech Ridge) UT Campus Riverside Rundberg Lane Downtown Austin/Capitol Oltorf Street 51 st Street/Hancock Center William Cannon / Bluff Springs Slaughter Lane (Southpark Meadows) Recommendation Details by Plan Phase The service recommendations are divided into four implementation phases spread over the next 10 years. Phasing of improvements is necessary given vehicle, facility, financial and administrative constraints. The phases were determined using a variety of factors, including vehicle and facility availability, geographic coverage, complexity of implementation and the number of riders who 21
22 would benefit from improvements. Improvements that must occur together to maintain service coverage of a particular area are grouped together. The top priorities are those improvements that are most likely to benefit the most riders and generate the most additional ridership and fare revenue while minimizing negative impacts to existing riders. Keeping in line with the Framework and Guiding Principles, the plan proposes that Capital Metro invest in service changes that improve existing system performance. Top priorities focus on improving frequency or hours-of-service spans on key routes or making alignment changes that are likely to greatly increase service productivity. The new farebox revenue generated from these top priority service improvements can be used to augment the overall funding available for service operations. Longer-term priority improvements require capital improvements and are therefore phased in based on estimated completion dates of these projects. Immediate-Term (FY 2018) Changes in the immediate-term focus on implementing as much of Connections 2025 as possible within the existing resource availability. This includes frequency enhancements on high-ridership routes and making the route adjustments that will have the most significant impact on the structure of the Capital Metro network. Additionally, Local services (Routes 1, 3, 4, 20) are consolidated into the new or updated MetroRapid lines to build ridership prior to full MetroRapid infrastructure implementation. These MetroRapid changes also include the implementation of 10-minute service on Routes 801 and 803, in The majority of service consolidation with the implementation of the High-Frequency Route Network and the consolidation of the Flyer routes would occur in this phase. Short-Term (FY 2019) In this phase, underutilized fixed-route service is being replaced by alternative mobility options in areas designated as innovation zones. Pilot projects involving innovative mobility options will be tested and refined in these neighborhoods as part of making changes to these existing fixed routes. Partnerships with innovative mobility options such as microtransit ridesharing providers, transportation network companies (TNCs) or destination shuttles require time to set up and conduct the pilot testing. As a result, underutilized fixed-route services would not be replaced by innovative mobility options until pilot projects are implemented to determine the feasibility and effectiveness of these options. Mid-Term (FY 2020 FY 2022) Changes in the mid-term focus on adjustments once necessary capital infrastructure work has been completed. This includes the installation of MetroRapid stations (additional ones on 801/803 and new ones for 804/820) and the implementation of additional priority treatment such as new and improved transit signal priority, queue jumps and transit-only lanes. Additional MetroRail service (15-minute frequency) and a new station at Hancock/E 41 st would be implemented in this timeframe, converting the service from a commuter rail line to an urban service integrated with 22
23 the rest of the High-Frequency Route Network. Additional Park & Ride lots would be available in this time frame, allowing improved commuter options on express routes. Long-Term (FY 2023 FY 2025) Long-term improvements further increase the number of trip options available to riders by implementing the full buildout of the IH-35 Bus Rapid Transit route, facilitating regional travel between Southpark Meadows in the south and Tech Ridge in the north. Additionally, the community circulator routes would be implemented as local partnerships. Financial Impacts The phasing of this plan is aimed at maintaining the existing operating costs of the network in preparation for future expansion. The immediate- and short-term plans are likely to have a minimal impact on operating costs. Expansion of MetroRail and MetroRapid in the mid-term would increase total revenue hours by 8 percent while the long-term improvements (new circulator routes and the implementation of IH-35 BRT) would add another 7 percent for a total of 15 percent over 2016 service levels. Customer Impacts and Benefits Over 80 percent of all Capital Metro riders will experience a positive impact in frequency from the network and individual route improvements, including reduced wait times, shorter travel times, increased reliability and more mobility options. These improvements will also generate additional use by existing riders and attract new riders to begin using the system. A small number of customers currently using low-ridership routes or low-ridership route deviations recommended for realignment or elimination will experience a change in type of service (mobility innovation zone) or potentially a loss of service and longer walks. Frequency and Span Service frequencies are improved on almost every Local route, with the number of Frequent Local routes jumping from six to 17 routes. As a result, more than four out of five existing weekday riders will have access to service that has a frequency of 15 minutes or better, with frequent service access for residents jumping to over 50 percent for the entire service area. High-frequency MetroRapid service will operate every 10-minutes or better on the two existing and two new routes. Additionally, weekend service will more closely resemble weekday service, with many corridors offering 15-minute frequencies. MetroRapid service assumes the role of overnight Night Owl service, allowing for a more consistent service for customers. Evening service hour spans will be maintained in most cases, providing riders with more travel options and increasing ridership by attracting people who require later evening service. 23
 Employment 302,600 (56%) 333,000 (62%) Integrated Network Mobility Route network transfers will be enhanced both by increased service frequencies and the emphasis of regular clock-face")
24 Table 1: High-Frequency Route NetworkBenefits within a Half-Mile Existing High-Frequency Network Proposed High-Frequency Network Weekday Ridership 50,883 (50%) 83,697 (82%) Population 331,600 (31%) 542,500 (51%) Employment 302,600 (56%) 333,000 (62%) Integrated Network Mobility Route network transfers will be enhanced both by increased service frequencies and the emphasis of regular clock-face headways. Modifying schedules to have consistent clock-face frequencies (10, 15, 30, 60 minutes) makes them easier to remember and makes it easier to coordinate transfers between routes. The IH-35 BRT project will allow for improved regional mobility between Tech Ridge and Southpark Meadows via downtown Austin. Frequency improvements to MetroRail also allow the service to move away from a commuter-oriented service and toward an all-day, all-week network mobility role. Travel Times Travel times will be reduced by streamlining routes to provide more direct links between key destinations. Straighter route alignments decreases both route mileage and travel time, speeding up service for riders and resulting in a more cost-effective service for Capital Metro. Additionally, transit 24
25 priority treatments focused on MetroRapid corridors will reduce delay, further improving travel times and cost-effectiveness. Ridership and Customer Impacts One of the primary objectives was to minimize impacts to existing riders. Some routes are streamlined by discontinuing low-ridership route deviations, but special attention is given to make sure as many riders as possible still remain within a reasonable walk of a proposed route. A customer impact is considered to occur when an existing service is restructured or discontinued, causing an existing customer to be further than half a mile from their nearest bus stop. Overall, the proposed plan impacts 630 weekday fixed-route customers, which accounts for only 0.6 percent of average weekday system boardings. Table 1 shows the number of average daily boardings on weekdays that are impacted. Table 2: Boardings Impacted by Service Changes Walk Access Outside ¼ Mile (5-minute) Outside ½ Mile (10-minute) Riders Served 111, % 112, % Riders Impacted 1, % % Changes in ADA Coverage Area The Federal mandated minimum ¾ mile buffer adopted by Capital Metro was applied to the proposed fixed-route network to identify the updated ADA paratransit service area. Overall, an average of 4.2 percent (69 weekday trips) of MetroAccess trips would be affected under the proposed ADA paratransit service area. The impacted service area includes 227 existing MetroAccess customers. As part of Connections 2025, MetroAccess eligibility for these customers would be maintained. While they would not lose eligibility, those riders would need to travel to a pickup location within the ADA service area in order to book a MetroAccess trip. 25
26 Next Steps Upon adoption of the Connections 2025 study, Capital Metro should continue to work with stakeholders and community members to ensure the successful implementation of the plan. Each phase of the plan will require subsequent board approval, and a public hearing process to sufficiently notify the public of upcoming service changes and consider feedback. Connections 2025 is one piece to improving mobility in Central Texas; other studies such as Project Connect will help Capital Metro build upon the existing network and establish a long-term vision for mobility in the region. Capital Metro should partner with communities to develop and implement cost-effective public mobility (regular transit or innovative mobility) while simultaneously addressing the fundamental land use patterns and densities needed to support cost-effective transit. Ongoing Monitoring and Corrective Action When evaluating the performance of existing and future services, Capital Metro faces the need to find the right balance between providing productive service and providing adequate service coverage across the service area. To ensure continued progress toward the objectives and guiding principles of Connections 2025, ongoing monitoring of service performance and operational delivery will help prioritize subsequent service changes. New and existing services should continue to be monitored quarterly to ensure they are meeting productivity and operating cost per passenger targets. Existing routes that continually fail to meet standards require reevaluation. Routes performing below 66 percent of the service type average on productivity (passengers per revenue hour) and effectiveness (operating cost per passenger) are classified as probationary and require corrective action. At the opposite end of the scale, ratings above 133 percent (highest-performing routes) may indicate the demand for additional service or capacity. In addition to peer service comparison, all non-special services should exceed the following minimum thresholds for route productivity: Weekdays: 15 riders per service hour Weekends: 12 riders per service hour 26