BLUE GROWTH STRATEGY Blue economy and mecanisms of innovation
|
|
|
- Vincent York
- 5 years ago
- Views:
Transcription
1 Blue economy and mecanisms of innovation Álvaro Rodríguez Dapena Technical Director Puertos del Estado

2 BLUE GROWTH STRATEGY THE SPANISH PORTS OF GENERAL INTEREST MINISTRY OF FOMENTO (PUBLIC WORKS &TRANSPORT) PUERTOS DEL ESTADO (NATIONAL AGENCY OF PORTS) 28 PORT AUTHORITIES MANAGING 46 PORTS CALLED AS GENERAL INTEREST TOTAL SPANISH PORT TRAFFIC (yearly tons). Source: Puertos del Estado

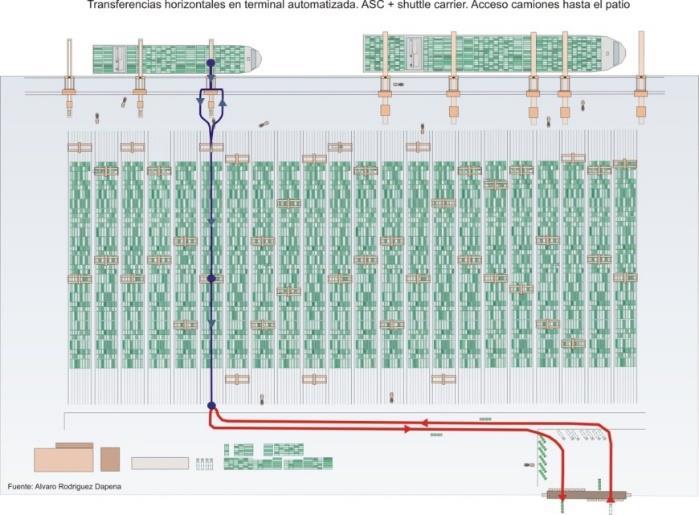
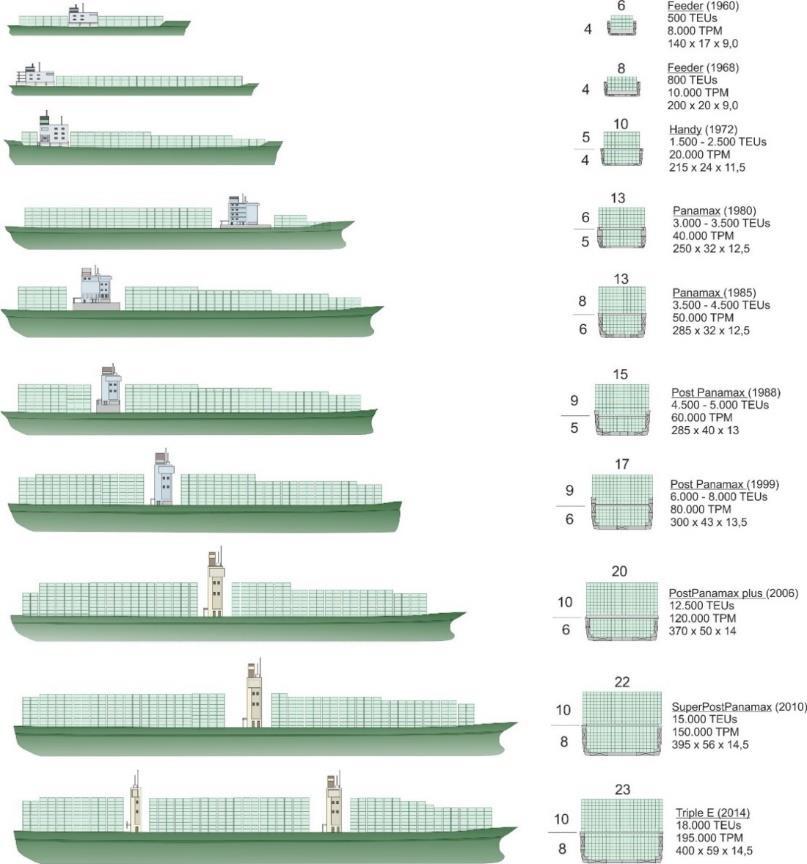
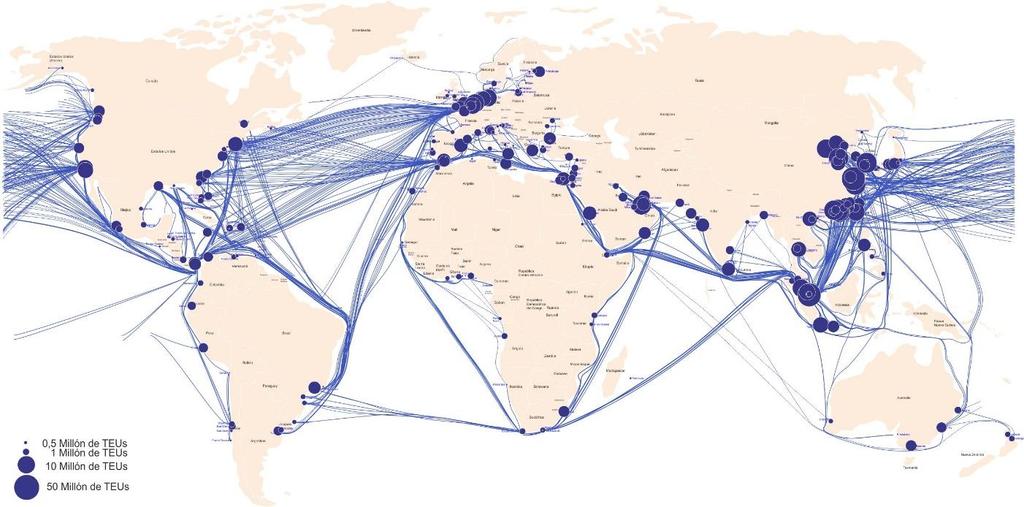
3 DEEP SEA. AN EXAMPLE: CONTAINERS FLOWS REVOLUTION


4 SHORT SEA. AN EXAMPLE: MOTORWAYS OF THE SEA NEWORK OF SSS/MoS SERVICES WITH TWO OPTIONS: 1. TRUCKS WITH DRIVER 2. SEMI-TRAILERS AND PLATFORMS


 70% 60%")
 40% 30% 21.")
5 BLUE GROWTH STRATEGY LAND SIDE: RAIL-MARITIME INTERMODALITY UNITED STATES EUROPE SPAIN RAIL LAND BRIDGE DOUBLE STACKED CONTAINERS IN TRAINS MAX. LENGTH: m TOTAL RAIL FREIGHT TRAFFIC IN SPAIN (tons) 70% 60% % SHARE OF MARITIME FREIGHT IN RAIL (%) 40% 30% % % LOS ANGELES & LONG BEACH PORTS CONNECTED THROUGH ALAMEDA CORRIDOR HAMBURG PORT EUROGATE TERMINAL
 1996 2001 2004 2009 2013 OUTLINE OF A MASTER PLAN FOR ROADS, RAILWAYS AND WATERWAYS FIRST INCLUSION OF PORTS BY CATEGORIES WHITE PAPER ON")
6 COMMON TRANSPORT POLICY. TEN-T AND MARKET TRANSEUROPEAN NETWORK TRANSPORT (TEN-T) OUTLINE OF A MASTER PLAN FOR ROADS, RAILWAYS AND WATERWAYS FIRST INCLUSION OF PORTS BY CATEGORIES WHITE PAPER ON TRANSPORT LIST OF PRIORITY ACTIONS, INCLUDING MOTORWAYS OF THE SEA (Nº 21) CONSULTING PROCESS FOR TEN-T REVIEW CORE AND COMPREHENSIVE NETWORK. 9 MULTIMODAL CORRIDORS. CEF EFSI REGULATION OF TRANSPORT SERVICES EU DIRECTIVES AND REGLAMENTS DRIVEN TO PROMOTE AND GUARANTE FREE AND FAIR COMPETITION WITHIN THE MARKET, IN ORDER TO ALLOW PRIVATE COMPANIES TO ACCESS TRANSPORT SERVICES PROVISION WITHOUT ANY KIND OF DISTORTION EFFICIENCY AND SUSTAINABILITY: GREEN & INNOVATION PRIORITIES TEN-T. PORTS


7 INTEGRATION OF PORTS IN TRANSPORT&LOGISTIC NETWORK Inter-conection EFFICIENCY & SUSTAINABILITY: Flows assignment optimization GREEN & INNOVATION PRIORITIES Syncro-modality Operational optimization

8 PORT ELEMENTS EVERYBODY IN THE PORT IS CONCERNED Land lord port PORT COMMUNITY LAND INFRASTRUCTURE Breakwaters/Piers, Docks, Berths, Port network... SUPERSTRUCTURE Storage Facilities, Cranes, Cargo handling equipment Rolling stock, etc. SERVICES Technical nautical services, Cargo handling, passengers,... Transport operators (road, railway, inland navigation..) Bunkering Repairing services Customs Agent Environmental authorities Mooring Services Customs Pilot Services Government Central Agency Port Authority Water, electricity supply Harbour Master Safety& Security authorities Ship Services Tug Services Ship agent Cross-border Inspections (sanitary...) Freight Services Labour pools / Trade Unions Logistic Activities (Storage, Added Value Services,...) Freight Forwarders Public Private Mixed public/private

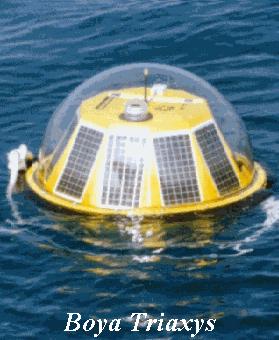
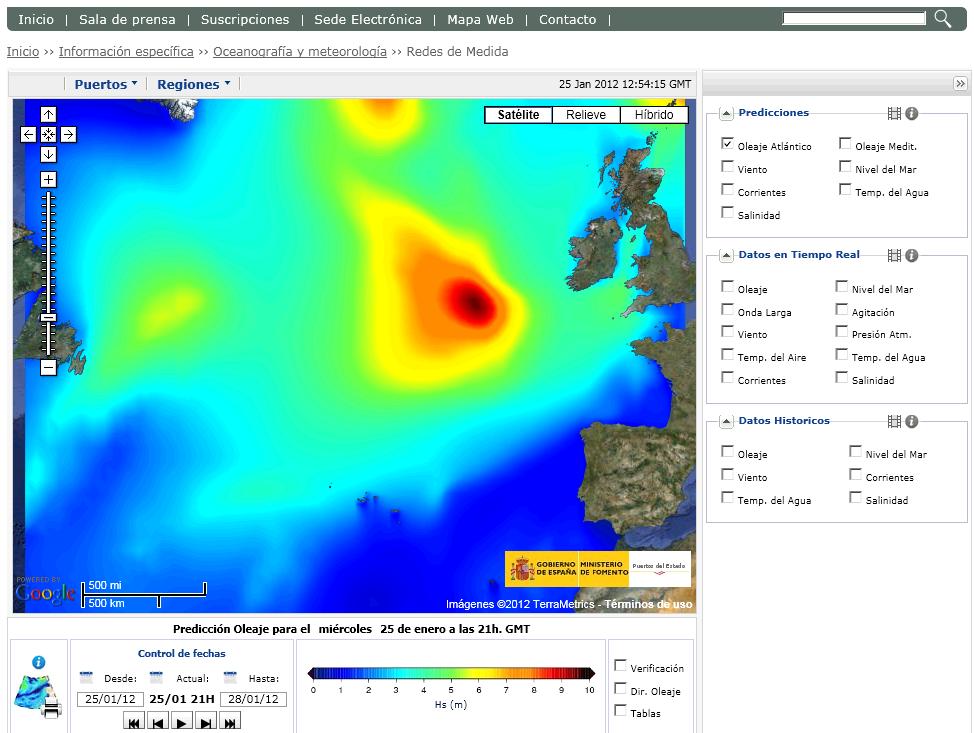
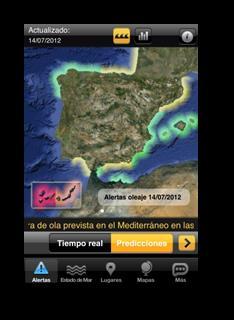
9 AN EXAMPLE OF KNOWLEDGE CONTRIBUTION: OCEANOGRAPHIC DATA Deep water network Coastal Network
10 AN EXAMPLE OF GREENING REGULATION: REDUCING SULPHUR CONTENT OF MARINE FUELS. PROMOTION OF ALTERNATIVE FUELS DIRECTIVE 2012/33 REGARDING SULPHUR CONTENT OF MARINE FUELS Amending 1999/32/EC SOx limits (based on IMO limits) Emission abatement methods (trials, financing measures, inspections, penalties ) MARITIME and PORTS DIRECTIVE 2014/94 ALTERNATIVE FUELS INFRASTRUCTURES Transposition in 2016 National policy framework in 2016 Alternative fuels: electricity, hydrogen, liquid biofuels, synthetic and parafinic fuels, liquefied petroleum gas, natural gas, bio-methane CNG and LNG (Refuelling points for LNG in TEN-T Core, December, 2015) Common technical specifications on recharging points for electric vehicles and refuelling points for natural gas and hydrogen. SOx LIMITS RELATED TO EMISSION CONTROL AREAS (ECAs). IMO and EU Regulation (since 2013) Outside an ECA established to limit SOx and particulate matter emissions (applied to EU only to SOx) Inside an ECA established to limit SOx and particulate matter emissions (applied to EU only to SOx) 3,50% m/m as from 18 June ,00% m/m until December ,50% m/m as from 1 January 2020 (1,50% for pax ships operating regular services) 0,10% m/m as from 1 January 2015 EMISSION CONTROL AREAS (ECAs) MARITIME AREAS Baltic Sea Area (only SOx) North Sea Area (SOx) North America Area (SOx, NOx and PM) United States Caribbean Sea Area (SOx, NOx and PM)
 Truck-To-Ship Provision depending on")
 Container-To-Ship Provision depending on demand and")

 GAINN4SHIP (15 M / 50% CEF-TEN-T): Main")
 Pipeline-to-Ship Barcelona, Cartagena, Bilbao y Ferrol:")
11 ATTENDING FUTURE LNG VESSELS DEMAND: ON GOING PILOTS&PROJECTS CORE LNGas hive (33 M / 50% ayuda UE) Truck-To-Ship Provision depending on volume, flow discharge and availability in each zone (250 tanker trucks) Container-To-Ship Provision depending on demand and availability of cryogenic tanks in ISO containers Ship-To-Ship Barcelona, Bilbao, Valencia ports: Barges adaptation GAINN4MOS (12 M / 50% CEF-TEN-T) STS (< 2020) CLEANPORT (6 M / 50% CEF-TEN-T): Auxiliary engines adaptation (< 2020) GAINN4SHIP (15 M / 50% CEF-TEN-T): Main engines adaptation (< 2020) Other initiatives new vessels LNG propelled (2020) Pipeline-to-Ship Barcelona, Cartagena, Bilbao y Ferrol: adaptation of jetties for non LNG carriers
12 PUBLIC & PRIVATE SECTORS ROLE Public sector Private sector Contributing to Green Energy Ports Regulator Responsible of public interest. Control of public domain. Active application of rules Co-operation with other public regulators Assistance to port community to comply rules Providing expertise ouside the port Planner Development of port integrated in European/National/regional/local plans based on comercial basis with financial support with an optimal allocation of public resources. Assistance for implementation and maintenance. Environmental. Sustainable development. Operator Efficiency in port operations. Labour and equipment management. Interoperability with maritime and land transport. Services provider Fulfil demand requirements on ports services under competitition with high quality/cost ratio. Port involved in global logistic network Integration in port community, based on an active participation using ICT. Facilitator Active real estate broker, based on a dynamic land use. Provide services based on public interest. Shareholder in PPP projects. Port charges and quality/risk control with different options for sustainability Framework for Training, R&D, ICT support Developer Provide financial resources, assuming risks Provide technology. Contribute to sustainability.
13 PORTS COMPETITIVENESS LOCATION AND ACCESIBILITY FACTORS Production&consumption áreas (hinterland&foreland) Logistic&transport corridors/chains EXTERNAL FACTORS General governance (central, local ) Regulation framework. Transport policies Port-city relationship Competitors: other ports Type of clients/sectors COMPETITIVE PORTS CONTRIBUTION TO INTERNAL FACTORS Own governance Capacity of infrastructures/facilities Level of perfomance Price: port charges Quality perceived: reliability, flexibility, transparency SMART SECURE E PORT GREEN ENERGY PORTS
14 Thank you!