Geographic Information System (GIS) in Big Data Analytics: A Case Study of Potable Water Sector in Egypt.
|
|
|
- Bertha Carter
- 5 years ago
- Views:
Transcription
 in Big Data")


1 Holding Company for Water & Waste water, Egypt Geographic Information System (GIS) in Big Data Analytics: A Case Study of Potable Water Sector in Egypt. Connecting Gears Mohamed Hasan Khalil, Ph.D., Holding Company for Water & Waste water, Egypt Planning & Design Sector (GIS Department)
2 Agenda Connecting Gears About us GIS for Water Industry Challenges Vision Solution Roadmap

3 HCWW currently manages 28 subsidiaries
4 Agenda Connecting Gears About us GIS for Water Industry Challenges Vision Solution Roadmap


5 Challenges Allocating the major portion of the investment in urban infrastructure utilized for water distribution, and maintaining the assets with best network optimization. Aging Assets Planning for maintenance & replacement Infrastructure cost Investments Deciding new projects location and investment areas to optimize distribution


6 Challenges Effectively designing water distribution systems to deliver potable water over spatially extensive areas in required quantities and under satisfactory pressures. Effective network design Assuring optimum network path Workforce Managing Start building your knowledge base


7 Challenges Cost-effectiveness & reliability in system design are also important. Decision support Where to build new reservoirs? Cost Containment Need to minimize operations cost


8 Public awareness & communication Need better communication channels Challenges

9 Challenges Water Conservation

10 Worldwide Water Stress
11 Agenda Connecting Gears About us GIS for Water Industry Challenges Vision Solution Roadmap


12 Vision Sharing Proactive HCWW Enterprise GIS Communication Scalability


13 GIS Helps In Many Functional Areas. Plant Operation Maintenance Planning Construction Water Quality Reporting Hydraulic Modeling Meter Reading Administration Customer Service


14 GIS Infrastructure Location is the Common Element Among Data Visualize your: World A Features around you C B Service Areas D E G Water Network F H Customers Alerts
15 Water Network Water ground tank Water Treatment plant Water service zones District Metering Areas(DMAs)


16 Water Network


17 Water Network


18 Building Geo-database Geodatabase
19 Integration Infrastructure Geodatabase SCADA NRW Business Layers Base Map Hydraulic Analysis Billing System
20 Integrations Hydraulic Modeling GIS SCADA Billing System NRW Visualization Analysis Decision Making


21 Integration - SCADA SCADA Control Room Communication Media GIS Sensors Pumps Valves Actuators Remote Site


22 Visualize locations of SCADA measurements DMA-2 M Locate the amount of distributed water (m 3 ) in each controlled zone.


23 Receive Measurements DATA from SCADA Tank Levels
 Noise Logger (physical")
24 Locations & readings of non-revenue water (physical & commercial) Noise Logger (physical leakage)
25 Integrations Hydraulic Modeling GIS SCADA Readings & locations Network Map Pressure in Each Node Flow &Velocity in each pipe 33.2 m INSTANT (Steady State) ANALYSIS EXTENDED PERIOD ANALYSIS WATER QUALITY ANALYSIS SCADA REAL TIME MODELLING 40.3 m FIRE FLOW ANALYSIS AUTOMATED PIPE CALIBRATION PUMP CURVE 41.3 m 3.4 l/s 25.7 m NETWORK OPTIMIZATION Hydraulic Analysis 27.3 m 29.3 m 25.3 m

 Visualization Analysis Decision")
26 Integrations Hydraulic Modeling Readings & locations Analysis Results GIS Readings SCADA Billing System Non-Revenue Water (physical & commercial) Visualization Analysis Decision Making


27 Web-Based GIS for Sustainable Water Management System


28 Web-Based GIS for Sustainable Water Management System Connecting Gears
29 Agenda Connecting Gears About us GIS for Water Industry Challenges Vision Solution Roadmap


30 Web-Based GIS for Sustainable Water Management System Public Portal Network Management Customer Services Operations Management Web-Based GIS Workforce Management Projects Tracking Maintenance Management Network Planning & more
31 Network Operations DATA GIS DB Data Network Operations Module Spatial Search Base Map Map Navigation Tabular Search Measurements Bookmarks Map Classification SCADA Rules & Validation Editing Aim: Managing for water network components from editing and updating, network tracing, schematic etc. Extracting Schematic Tracing Network Analysis Plotting

32 Can You Access Accurate Information about Your Assets? It May Be Due to the Difficulty of Maintaining Your Asset Information


33 Retrieving Attributes Attachments Network Editing Network Tracing Redlining Searching & Finding network elements
34 Field Verification 1. MODEL VERIFICATION SPOT AN ANOMALY 2. SOMETHING IS WRONG IN GIS or SCADA 3. CHECK GIS AND SCADA AREA CHECKED BY LOCAL STAFF FOR ANOMALIES PRESSURE (m) PRESSURE (m) PRESSURE METER A SCADA MODEL :00 2:00 4:00 6:00 8:00 10:00 12:00 14:00 16:00 18:00 20:00 22:00 0:00 0:00 2:00 4:00 6:00 8:00 10:00 12:00 14:00 16:00 18:00 20:00 22:00 0:00 SCADA SCADA MODEL MODEL SCADA Water Monitoring & Control Unit M
 AREA CHECKED BY LOCAL STAFF FOR ANOMALIES PRESSURE (m) 120.0 115.0 110.0 105.0 100.0 95.0 90.0 85.0 80.0 75.0 70.0 65.0 60.0 55.0 50.")
35 Probable Leakage Locations Comparison between the measured pressure by SCADA unit (actual existing state in red) and the hydraulic model (blue) will significantly indicated the possibility of leakage (commercial & physical) AREA CHECKED BY LOCAL STAFF FOR ANOMALIES PRESSURE (m) PRESSURE METER A56 SCADA MODEL 0:00 2:00 4:00 6:00 8:00 10:00 12:00 14:00 16:00 18:00 20:00 22:00 0:00 SCADA MODEL M


36 Probable Leakage Locations
 Flow (L/s) 24")
37 Dynamic Hydraulic Modeling Flow in Each Pipe Every Minute (Matching with SCADA time step) Flow (L/s) 24 HOURS
 head loss in the red pipe = 1.")
 reduced the head loss")
38 Network Optimization Detection of pipes with main head loss (red) head loss in the red pipe = bar head loss in the proposed yellow pipe =.57 bar New proposed pipe (yellow) reduced the head loss and increased the pressure.


39 Monitor and analyze the fluctuation and behavior of the distributed water and consumption patterns in each controlled zone. Monitoring

40 Network Optimization Establish a base line for the component of night flow for each controlled zone, which will help in the optimization for the management of operation and distribution.
41 Distribution Automation & Network Optimization System optimized by integrating the hydraulic modelling and SCADA with pumping strategy (energy savings) to sustain optimum pressure levels according to various consumption categories GT-1 M GT-2 GT-3 M M M GT-4 M GT-5

 because each has its specific")
42 pump controller with variable speed adjustment Distribution Automation & Network Optimization Period - 1 Period - 2 Period Consumption pattern as function in flow and/or pressure Consumption pattern should be divided according to h consumption pattern and 24/7 (to recognize behaviour variation between working / non working days,.etc). 2 Land use nature (industrial, residential, agriculture, commercial, mixed, etc) because each has its specific behaviour.

43 Visualize & Monitor Pressure Legenda Pressione m m m m - High pressure zones >> high probabilities of burst & increased levels of physical leakge. - Low pressure zones >> customer ccomplains

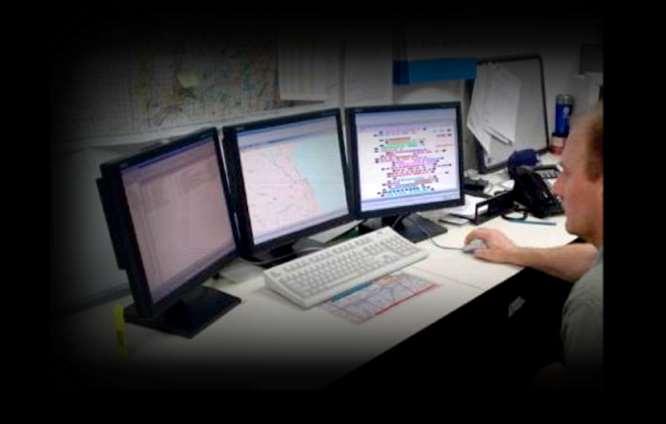
44 Visualize locations of Noise Loggers and probable leakage Noise Logger Visible photo on left and leak photo on right. The water leak from the transmission main shows up as a dark blue area.

45 Customer Service DATA Data Customer Services Module Spatial Search Map Navigation Tabular Search GIS DB Base Map Measurements Bookmarks Receive Call CRM, Billing etc Locate Customer Locate/Show Locate Complaint Aim: Managing mobile workforce, request for services, statues, monitor crew and track work orders etc. Fault Close Call Advanced Geo- Analysis Reporting


46 Mohsen Amin 454 El Ahram El Giza
47

48 Pipe leakage Pipe Leakage

49


50


51
52 Maintenance Management DATA GIS DB Data Maintenance Management Module Spatial Search Base Map Map Navigation Tabular Search Measurements Bookmarks Map Classification MMS Show Assets Maintenance Status Map Editing Tracing Aim: Managing maintenance process for water assets and provide workforce with maintenance map etc. Schedule Maintenance Plan Assign to workforce Plotting


53 How Long does it Take to get Information Into and Out of the Field? It s Difficult to Effectively Communicate with Field Operations

54 Supporting Field Crew


55 Easy Access to Information, Anywhere Find & locate reported pipes Identify working area (land-use, street width ) Retrieve the diameters & types of pipes Locate valves that should be closed Find alternative paths during failures


56 Taking actions to handle failures Valve Valve Valve Valve Valve Valve


57 Powerful Visualization Better Visualization using 3D display of Buildings and underground water network


58 Workforce Optimization


59 Tracking in-field Teams Communication Media Satellite Control Room GPS


60 Tracking in-field Teams
61 Locations of Service Requests Service Area (4) Service Area (1) Service Area (3) Service Area (2)

62 Assign Service Requests

63


64

65 Receiving Alert بيانات : كسر في ماسورة مياة رئيسية رقم تب Displaying a Scenario
66 Analyzing Situation


67 Sending information to in-field team القائمة الرئيسية البيانات الجدولية إصدار أمر عمل: إرسال للفريق رقم: 810 التاريخ: الخطورة: شديدة الحالة: كسر في ماسورة مياة رئيسية رقم 6530 بت- المزيد
68 Sending update from field بيانات العطل: كسر في ماسورة مياة رئيسية رقم 6530 بسبب تدفق عالي للمياة في نقطة قرب بداية الماسورة ويمكن إصالحها خالل ساعتين من استالم أمر العمل. المزيد القائمة الرئيسية البيانات الجدولية بيانات العطل: كسر في ماسورة مياة رئيسية رقم تب بسبب تدفق عالي للمياة في نقطة قرب بداية الماسورة ويمكن إصالحها خالل ساعتين من استالم أمر العمل. المزيد
69 Information are available to customer Service
70 Water Quality DATA Data Water Quality Spatial Search Map Navigation Tabular Search GIS DB Base Map Measurements Bookmarks Map Classification MMS Show Assets Charts Editing History Aim: Support the process of water quality verifications by providing maps for the samples locations and several analysis tools Samples Locations Schedules Plotting


71 GIS for Water Quality Using coordinates from GPS, Samples can be re-collected from same locations Follow current & historical Results of samples Analyses & Reports


72 Locations of Water Samples محطة الفسطاط

73 Details of the sample

74 Compliant & non compliant samples


75 Reports about Samples
76 Network Planning DATA Data Network Planning Module Spatial Search Map Navigation Tabular Search GIS DB Base Map Measurements Bookmarks Map Classification Other Data Least Cost Path Obstacles along route Aim: allows planners with multiple tools to assess and weigh scenarios that balance levels of investment against asset life span. Regulations Topography Land-use


77 Model your network data Analyze populations, customers, Consumption and Demand Analyze & Plan
 Network Map 33.")

78 Planning for new developments Model Approach: 1 INPUT Design: Demand for new development & extension(s) Network Map 33.2 m OUTPUT Residual pressure at each node 40.3 m 41.3 m 25.7 m 27.3 m NEED FOR IMPROVEMENT WORK (Improve pumping capacity or increase pipe diameter) 16.3 m 7 m
 33.2 m OUTPUT : Maximum allowed additional demand 40.3 m 41.")
 OUTPUT (Maximum Additional Demand) 30")
79 Planning for new developments Model Approach: 2 INPUT : Minimum acceptable pressure (e.g 30m) 33.2 m OUTPUT : Maximum allowed additional demand 40.3 m 41.3 m 35.7 m INDICATION FOR DEVELOPEMENTS COMPLIANT WITH THE PRESENT SYSTEM 30.0 m 30 m INPUT (Residual Design Pressure) OUTPUT (Maximum Additional Demand) 30 m 11.5l/s

80 Model the future

81 W-GIS (Projects Tracking) DATA Data WGIS Projects Tracking Module Spatial Search Map Navigation Tabular Search W-GIS DB Base Map Measurements Bookmarks Map Classification Project Server Aim: provides access to Water projects information and provides tools to support project planning, management, and data acccess etc. Project Browser Project Finder Reporting Project Analyzer Project Tracking Redlining Plotting
82

83


84


85
86 Executive Dashboard DATA Data Dashboard Spatial Search Map Navigation Tabular Search GIS DB Base Map Measurements Bookmarks Map Classification MMS Show Assets Charts Editing History Aim: Support the process of water quality verifications by providing maps for the samples locations and several analysis tools Performance Indicators Track Projects


87 GIS Provides Complete Operational Awareness A Common Platform for Sharing Information Fully Aware More Accountable Better Managed Giving You Visibility into Your Operations


88 Dashboard Track Projects Distribution of complains 88


89 & more KPIs


90 Extending Awareness Manage Your Assets Share Information Contain Costs Manage Public Expectations WMS
91 Public Portal DATA Data Public Portal Base Map Map Navigation Bookmarks GIS DB Locate on Map Address Search Other Data Aim: allows citizens to submit requests for service. Search for address or click on map to locate your request for service etc Show Projects Create service request Update service request Change service request importance Check request status Web/ Mobile

92 Requests Status Create Request Projects Status


93 Requests Status Create Request Projects Status

94 الشركة القابضة لمياه الشرب والصرف الصحي - مصر
95 Agenda Connecting Gears About us GIS for Water Industry Challenges Vision Solution Roadmap

96 Roadmap Closing Implementation Planning Agile Approach Analyzing Situation Define Priorities


97 Optimize the Way We Operate... How We Plan... How We Organize and Communicate... How We Deliver.... Thank You