Framework for ADOT Asset Management System. Jean A. Nehme, PhD, PE Arizona Department of Transportation
|
|
|
- Allyson Lewis
- 5 years ago
- Views:
Transcription
1 Framework for ADOT Asset Management System Jean A. Nehme, PhD, PE Arizona Department of Transportation November 14, 2013 Arizona Pavements/Materials Conference 1
2 Presentation Overview Brief Intro to Transportation Asset Management Performance- and Risk-based Transportation Program o o o MAP-21 Performance Measures and Targets ADOT Performance Measures and Targets Incorporating Risk within Transportation Asset Management Arizona Transportation Asset Management Work Plan 2
3 What is Asset Management? 3
4 MAP-21 Definition of Asset Management A strategic and systematic process of operating, maintaining, and improving physical assets, with a focus on both engineering and economic analysis based upon quality information, to identify a structured sequence of maintenance, preservation, repair, rehabilitation, and replacement actions that will achieve and sustain a desired state of good repair over the lifecycle of the assets at minimum practicable cost. 4
5 Core Principles of Asset Management Policy-driven Resource allocation decisions are based on a well-defined set of policy goals and objectives. Performance-based Policy objectives are translated into system performance measures that are used for both day-to-day and strategic management. Analysis of Options and Tradeoffs How will different allocations impact achievement of relevant policy objectives. Decisions Based on Quality Information The merits of different options with respect to an agency s policy goals are evaluated using credible and current data. Monitoring Provides Clear Accountability and Feedback Performance results are monitored and reported for both impacts and effectiveness. 5
6 Quality Information Asset Management - Illustration Policy Goals and Objectives Planning and Programming Project Delivery Systems Monitoring and Performance Results 6
7 MAP-21 Performance Measures Requirements o USDOT to identify national-level performance measures for various performance management areas related to: Safety Pavement Condition Bridge Condition Freight System Performance (Delay and Reliability) NHPP System Performance (Delay and Reliability) CMAQ (Emissions and Traffic Congestion) Targets for these measures will be developed by the States and MPOs and will be approved by FHWA 7
8 MAP-21 Specific Standards/Targets Additionally, the bill contains the following minimum standards/targets: Minimum standards for interstate pavement (USDOT is working on it) NHS bridge conditions: No more than 10 percent of the total deck area of NHS bridges in a State is on structurally deficient bridges 8
9 AASHTO Recommendation - Safety Number of Fatalities Five-year moving average of the count of the number of fatalities on all public roads for a calendar year. ADOT 2012: 821 Fatality Rate Five-year moving average of the Number of Fatalities divided by the Vehicle Miles Traveled (VMT) for a calendar year. ADOT 2012: 1.38 Number of Serious Injuries Five-year moving average of the count of the number of serious injuries on all public roads for a calendar year. ADOT 2012: 4,468 Serious Injury Rate Five-year moving average of the Number of Serious Injuries divided by the Vehicle Miles Traveled (VMT) for a calendar year. ADOT 2012:


10 1,400 Number of Fatalities 9,000 Number of Serious Injuries 1,200 8,000 1, ,000 6,000 5,000 4, ,000 2,000 1, Fatalities Rate Serious Injuries Rate
11 AASHTO Recommendation - Pavement Pavement in Good, Fair and Poor Condition: Percentage of 0.1 mile segments of Interstate pavement mileage in good, fair and poor condition based on the following criteria: AASHTO / FHWA ADOT Poor IRI > 170 IRI > 117 Fair 95 < IRI < < IRI < 117 Good IRI < 95 IRI < 95 Pavement Structural Health Index Percentage of pavement which meet minimum criteria for pavement faulting, rutting and cracking. ADOT currently does not have an aggregate health index 11
12 IRI = 144 (I-8 WB MP 61) 12
13 IRI = 163 (SR-72 MP 37) 13
 IRI = 105 (I-8 WB MP 98)")
14 IRI Examples IRI = 163 (SR-72 MP 37) IRI = 144 (I-8 WB MP 61) IRI = 105 (I-8 WB MP 98) 14


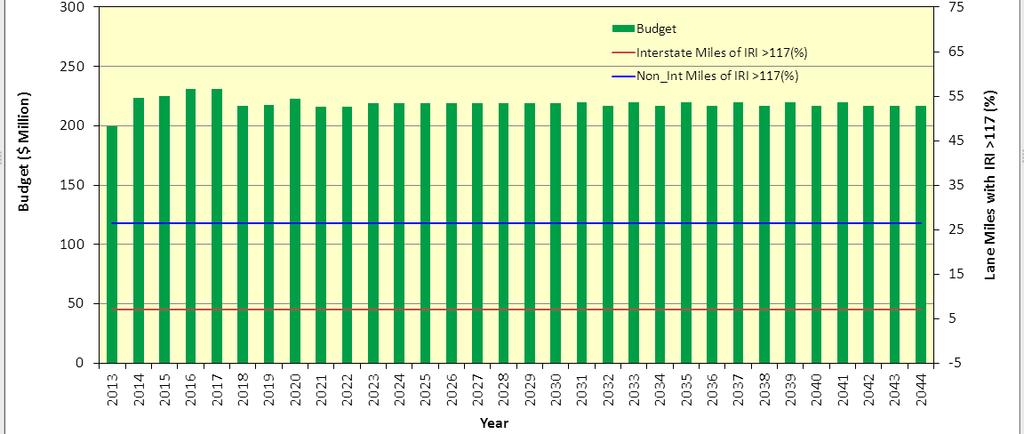
15 Non-Interstate Pavement Condition AASHTO Definition Non-Interstate Pavement Condition ADOT Definition Interstate Pavement Condition AASHTO Definition Interstate Pavement Condition ADOT Definition
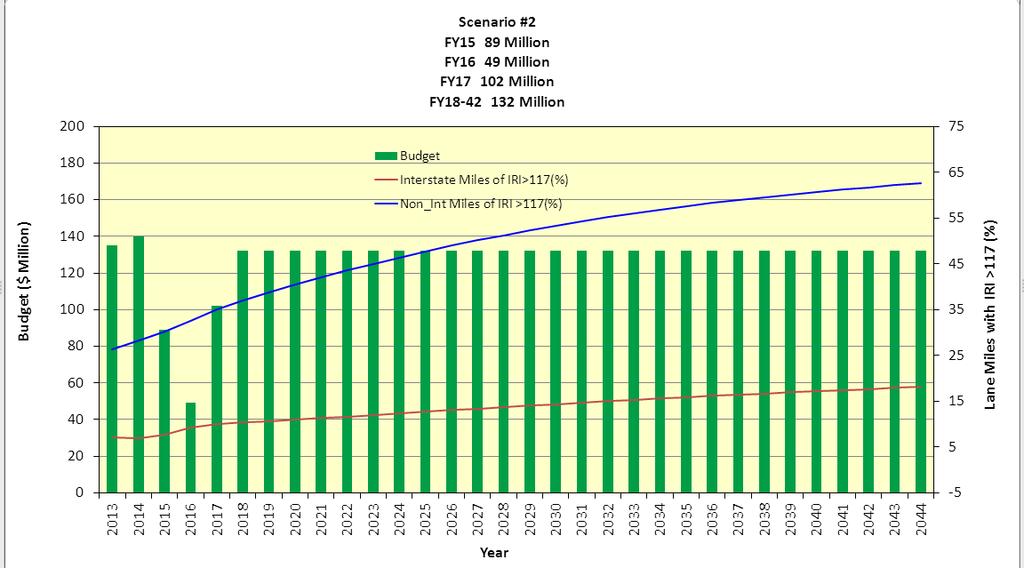
16 16
17 17
18 AASHTO Recommendation - Bridges Percent of Deck Area on Structurally Deficient Bridges NHS bridge deck area on structurally deficient bridges as a percentage of total NHS bridge deck area. NHS Bridges in Good, Fair and Poor Condition based on Deck Area Percentage of National Highway System bridges in good, fair and poor condition, weighted by deck area. AASHTO and FHWA are working on defining Good, Fair, and Poor ADOT has a Bridge Condition Rating Index: 93.1 % (2012) 18
19 Bridge Condition (ADOT System) % SD (Deck Area) Bridge Condition Index (ADOT System) ADOT Definition
20 AASHTO Recommendation - Freight Annual Hours of Truck Delay (AHTD) Travel time above the congestion threshold in units of vehicle-hours for Trucks on the Interstate Highway System. Truck Reliability Index (RI 80 ) The RI is defined as the ratio of the total truck travel time needed to ensure ontime arrival to the agency-determined threshold travel time (e.g., observed travel time or preferred travel time). 20
21 AASHTO Recommendation System Performance Annual Hours of Delay (AHD) Travel time above a congestion threshold (defined by State DOTs and MPOs) in units of vehicle -hours of delay on Interstate and NHS corridors. Reliability Index (RI 80 ) The Reliability Index is defined as the ratio of the 80th percentile travel time to the agency-determined threshold travel time. 21
22 AASHTO Recommendation CMAQ Criteria Pollutant Emissions Daily kilograms of on-road, mobile source criteria air pollutants (VOC, NOx, PM, CO) reduced by the latest annual program of CMAQ projects. Annual Hours of Delay (AHD)-Travel time above a congestion threshold (defined by State DOTs and MPOs) in units of vehicle -hours of delay reduced by the latest annual program of CMAQ projects. 22
23 Incorporating Risk within Transportation Asset Management 23

24 The Various Levels of Risks NCHRP
25 Communication and Consultation Monitoring and Review ISO s Risk Management Framework Establish Context Identify Risks Analyze Risks Evaluate Risks Treat Risks 25
26 Risk Matrix Consequence Likelihood Insignificant Minor Significant Major Catastrophic Very rare Low Low Low Moderate High Rare Low Low Moderate High High Seldom Low Moderate Moderate High Extreme Common Moderate Moderate High Extreme Extreme Frequent Moderate High High Extreme Extreme 26
27 Risk Matrix - Landslides Consequence Likelihood Insignificant Minor Significant Major Catastrophic Very rare Low Low Low Moderate High Rare Low Low Moderate High High Seldom Low Moderate Moderate High Extreme Common Moderate Moderate High Extreme Extreme Frequent Moderate High High Extreme Extreme 27

28 Risk Matrix - Landslides Consequence Likelihood Insignificant Minor Significant Major Catastrophic Very rare Low Low Low Moderate High Rare Low Low Moderate Seldom Low Moderate Moderate Extreme Common Moderate Moderate High Extreme Extreme Frequent Moderate High High Extreme Extreme 28
29 Arizona Transportation Asset Management Work Plan 29
30 Major components that will be included in ADOT s TAMP Documentation of ADOT s procedures for allocating funds to build, operate, and preserve the transportation system. A process through which enhancements could be made to the TAMP including seamless additions of new asset types. Definition and documentation of ADOT s transportation system performance measures. Definition and documentation of ADOT s transportation system performance targets. Tools enabling trade-off analysis and project prioritization amongst asset types. 30
31 Table of Contents 1. Introduction 2. Purpose and Scope 3. Individuals and Teams Involved in Developing the TAMP 4. Outline 5. Information and Activities Needed to Develop the TAMP 6. Implementation 31
32 1. Introduction At a minimum, the Arizona Transportation Asset Management Plan (TAMP) must include the following: A summary of pavement and bridge inventory and condition Asset management objectives and measures Performance gap identification Lifecycle cost and risk management analysis A financial plan Investment strategies 32
33 2. Purpose and Scope 2.1 ADOT TAMP Objectives Implement an asset management system that: o o Links planning, programming, project development, construction, maintenance, and operation to the performance of the transportation system. Incorporates asset worth, asset condition, and risk factors in decision making to optimize the use of funds in building, operating, and preserving the transportation system. Communicate current asset worth and their conditions. Comply with the requirements of MAP
34 2. Purpose and Scope (cont d) 2.2 Asset Types Initially the plan will cover: o Pavement on the State Highway System (SHS) in addition to the pavement on the expanded NHS o All bridges that are included in Arizona s portion of the National Bridge Inventory (NBI) 2.3 Management and Timeframe of the TAMP Development Draft TAMP completed by December 2014 Final January 2015 TAMP development will be managed by the State Asset Management Engineer 34
35 3. Individuals and Teams Involved in Developing the TAMP 3.1 Asset Management Steering Committee The steering committee will set the general direction for ADOT s TAMP and provide support to implement the plan. It will meet on a quarterly basis. 3.2 Asset Management Working Group This group will be responsible for developing performance measures and state targets that will be reviewed for approval by the steering committee. This group will meet on a monthly basis. 3.3 Asset Management Technical Teams Each team will be responsible for documenting procedures and compiling needed data to produce performance measures and targets. These teams will meet as often as required. 35
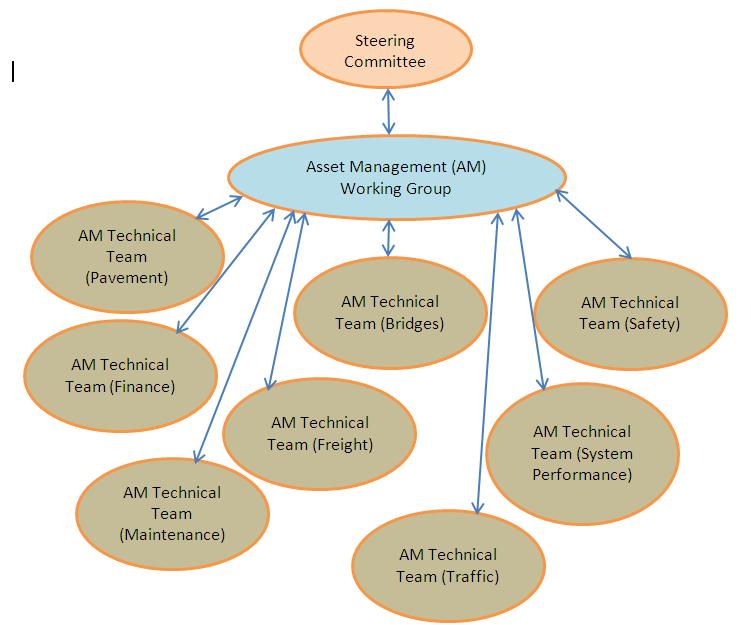
36 36
37 4. TAMP Outline ADOT TAMP will include the following Sections: 1. Executive Summary 2. Asset Management Objectives and Performance Measures and Targets 3. Performance Gap Assessment 4. Lifecycle Cost Considerations 5. Risk Management Analysis 6. Financial Plan 7. Investment Strategies 8. Asset Management Process Enhancement 9. Appendices 37
38 5. Required Information and Activities A wide range of information and data is required, such as: Inventory data Condition data (current and future) Travel demand data (current and future) Data required to estimate the likelihood and consequences of external events for the system risk assessment Historic funding levels Projected funding levels Cost data The work plan describes 29 activities that will be required to develop the TAMP 38
39 6. Implementation Dates Milestone Activities (see Section 5 for item numbers) Responsible Party November 2013 Asset Management Work Plan Conduct Asset Management Workshops (#27) Finalize the Asset Management Work Plan including the review of the milestones and their deadlines December 2013 Define High Level Objectives of the Asset Management System to Be Handed to the Asset Management Working Group for Final Documentation December 2013 Data Collection and Quality Control and Assurance Procedures (#3, #4, and #6) January 2014 February 2014 Asset Management Objectives and TAMP Governance Document the objectives of ADOT s asset management program (#2) Develop the TAMP s governance process (#26) Prioritize asset types to be added to the TAMP (#28) Funding Levels Historic funding levels for assets included in the TAMP (#19) Forecasting of funding levels for a ten-year horizon (#20) State Asset Management Engineer Asset Management Steering Committee Pavement and Bridge Technical Teams Asset Management Working Group and Steering Committee Finance Technical Team 39
40 6. Implementation (cont d) Dates Milestone Activities (see Section 5 for item numbers) Responsible Party March 2014 Performance Measures and Targets* (#5) *This milestone may require re-assessment due to the fact that FHWA final rule making relating to national performance measures is not expected to be complete until the end of All Technical Teams, Asset Management Working Group and Steering Committee April 2014 Lifecycle Cost Considerations (#11, #12, #13, and #14) Asset Management Working Group May 2014 Risk Management Analysis (#15, #16, #17, and #18) Asset Management Working Group and Steering Committee May 2014 Complete the Financial Plan (#21, #22, and #23) Finance Technical Team and Steering Committee May 2014 Identify and Document Challenges (#9 and #10) Asset Management Working Group 40
41 6. Implementation (cont d) Dates Milestone Activities (see Section 5 for item numbers) Responsible Party July 2014 Performance Gap Assessment Illustrate the relationship between funding and asset condition (#7) Document the methodology (#8) Pavement and Bridge Technical Teams September 2014 December 2014 Investment Strategies (#24 and #25) Final Draft ADOT TAMP Executive summary (#1) Appendices (#29) Submit to FHWA for review Pavement and Bridge Technical Teams State Asset Management Engineer January 2015 Final ADOT TAMP First Edition State Asset Management Engineer 41
42 Questions? 42