How does the fish industry see logistic to improve the sustainability of the value chain? Sigurjón n Arason Matis ohf, Reykjavik, Iceland
|
|
|
- Alberta Howard
- 5 years ago
- Views:
Transcription
1 How does the fish industry see logistic to improve the sustainability of the value chain? Sigurjón n Arason Matis ohf, Reykjavik, Iceland
2 Wild Catch - Cold Chain Map Fishery Wild catch Chilling on board 1-12 hours Process On Board Transport from sea to shore Freeze On Board On Shore Sorting Packing Up to 2 days Frozen Seafood Products Transportation + Distribution Fresh Seafood Transportation + Distribution Fishing Vessels Sorting + Packing On Board Cold Storage On Board Transport from sea to shore Up to 2 Hours Up to 5 days Up to 3 days
3 Development in storage fish on board the Icelandic ice fish vessels 1972: Stern trawlers; storage of fish in plastic boxes 1982: Storage of fish in plastic tubs l 1992: Storage of fish in plastic tubs l


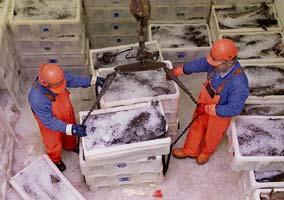
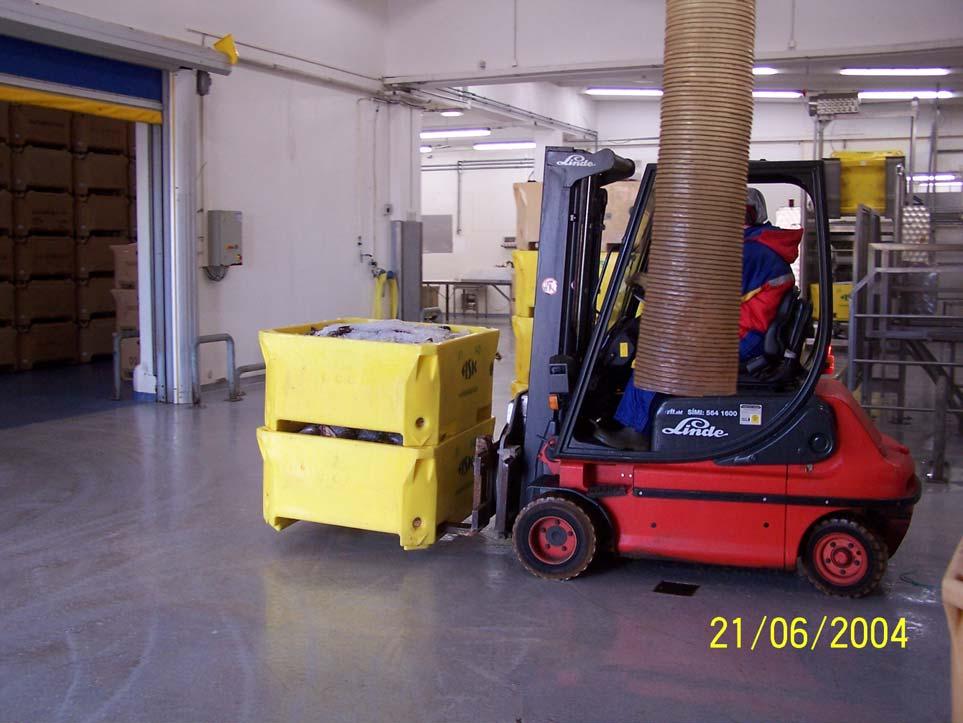
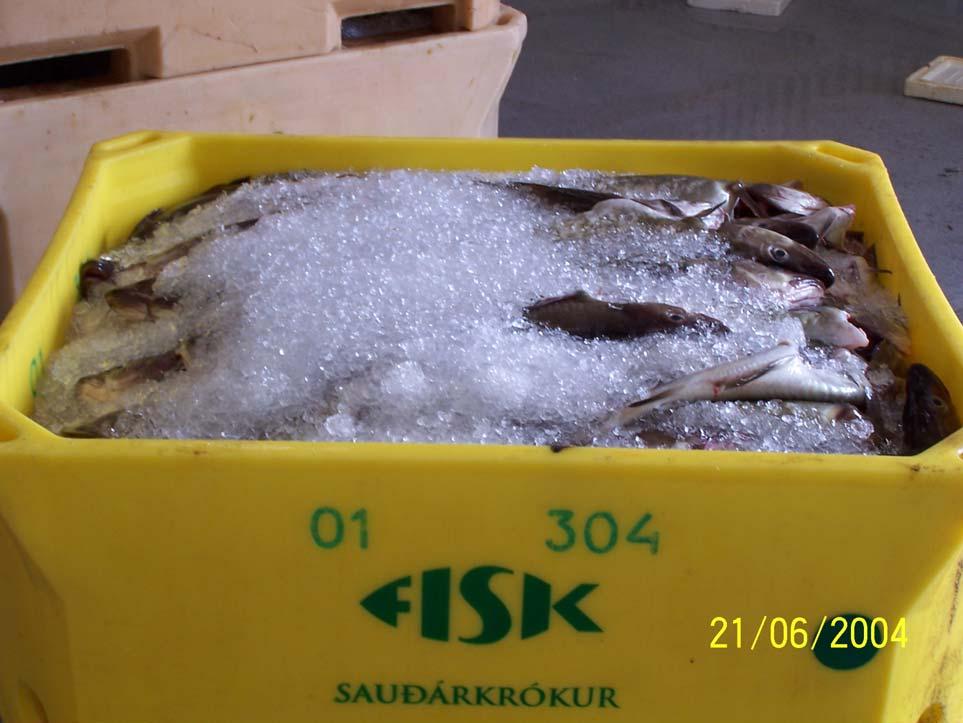
4 Fish is iced in boxes on board


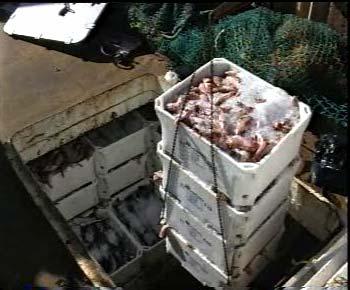
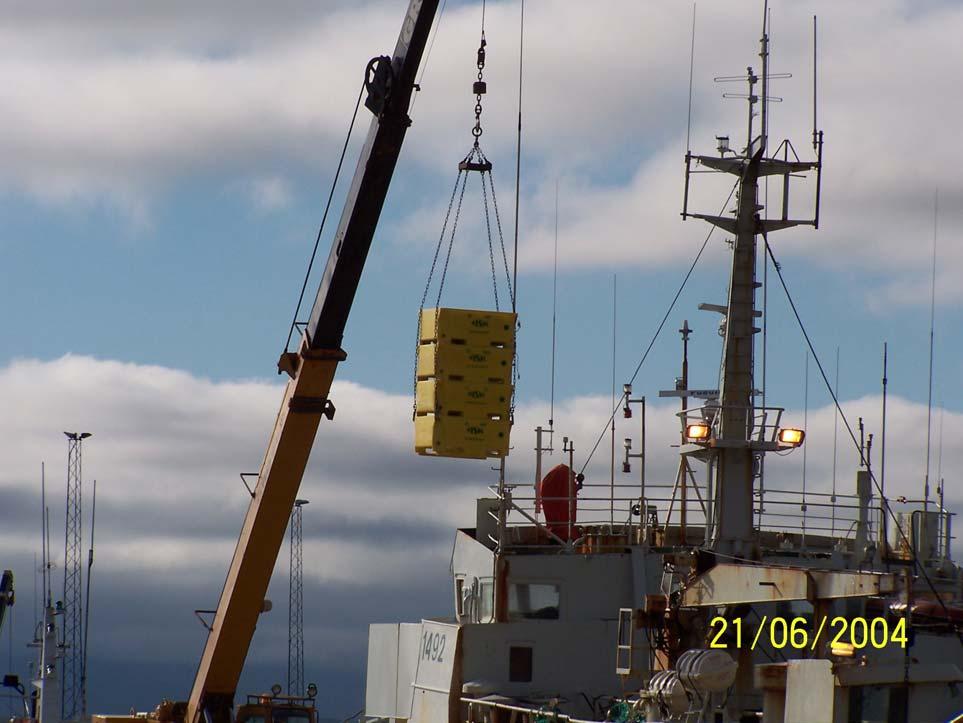
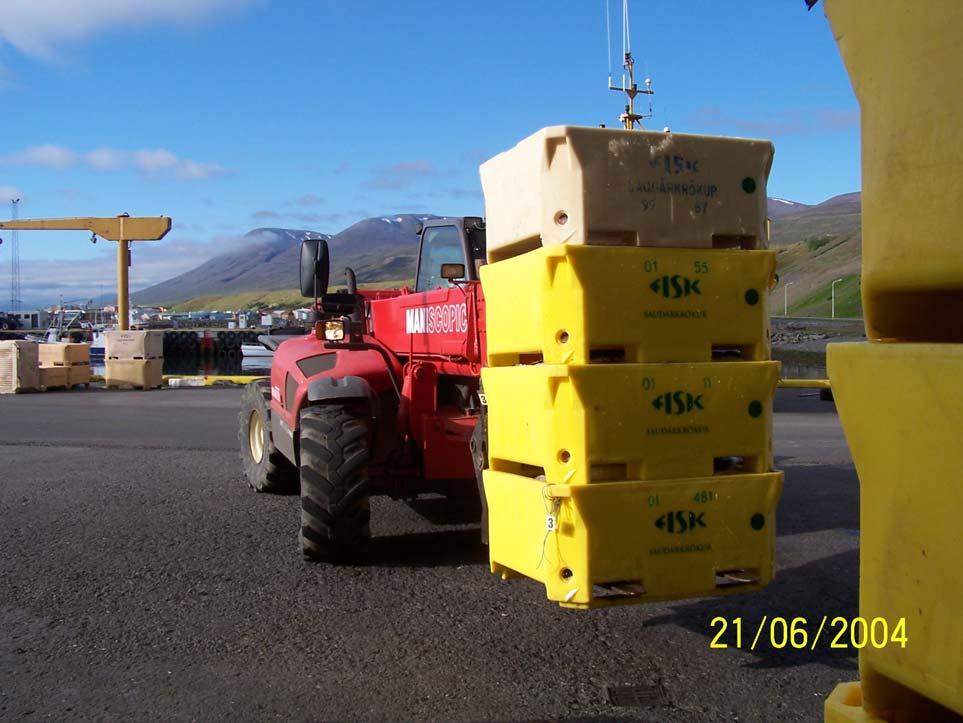
5 Landing both boxes and tubs Time of landing will be reduced with use of tubs


6


7 Production of cod fillet By-products Whole cod Viscera kg Gutted cod 100 kg Head with collar 30 kg Back bone 17 kg Headed cod 70 kg Skin 3 kg Fillet skin- & boneless 43 kg Belly flap 3 kg Cut-offs 2 kg
8 Development in the Icelandic fish processing industry and in the filleting yield for cod the last 20 years Fillet yield Customer's expectations Water holding capacity Drip Texture ~ watersoft Better logistic Process optimizing Better handling on board New processing Traceability Quota system Computerised production control Employee training Proportion of high value products and staff reduction by % New Baader filleting machines/beheading machines Individualized monitoring flow line Consumer cuts Shape grader Flow scale IQF freezer Year
9 Effects of superchilling on quality and shelf life of Arctic charr (Salvelinus alpinus) fillets H.N. D. Bao, K. A. Þórarinsdóttir and S. Arason 2005
10 Temperature profiles of the cold storage simulator and cooling room 5 4 Cooling room (3.1 ± 0.3 C) Temperature ( C) Cold storage simulator (-1.9 ± 0.3 C) Storage time (days) H.N. D. Bao, K. A. Þórarinsdóttir and S. Arason 2005
11 Effect of chilling and superchilling with different cooling agents on the shelf life of Arctic charr fillets Unacceptable Unacceptable Unacceptable H.N. D. Bao, K. A. Þórarinsdóttir and S. Arason 2005
12 Effect of chilling and superchilling with different cooling agents on the shelf life of Arctic charr fillets Unacceptable Unacceptable Unacceptable Unacceptable H.N. D. Bao, K. A. Þórarinsdóttir and S. Arason 2005
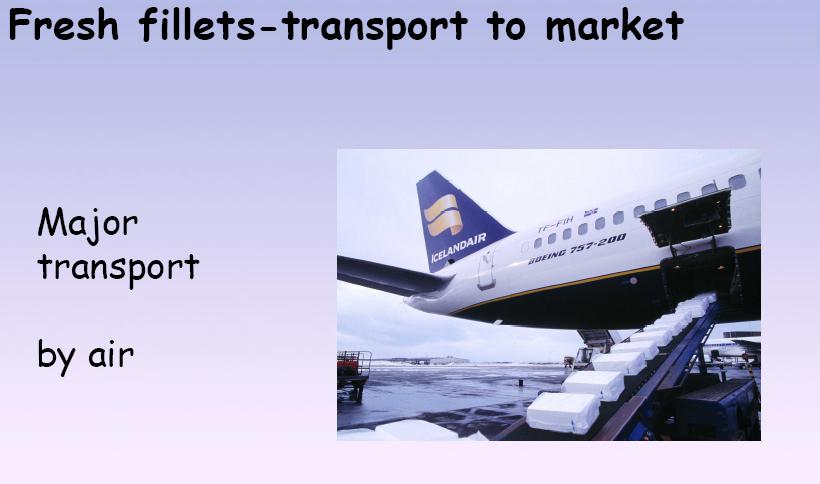
13 Mapping one example Project done at UNU/FTP in TRACEABILITY AND QUALITY IN A FRESH FISH EXPORT CHAIN Fresh fish by plane to Belgium Short and relatively simple chain (Janaína Almeida, 2006)


14 Mapping example, cont... Origin of fish Reception Raw material Check weighing Vestfjords Snæfellsnes Reykjanes Internal Label Grading step Quality assessment Tub n (Janaína Almeida, 2006)


15 (Janaína Almeida, 2006) Mapping example, cont... Cold storage Fresh loins processing Packaging AWB glued on pallet Label on boxes DISPATCH

16 (Janaína Almeida, 2006) Mapping example, cont... Flight pallet formation Cold storage Loading in plane: ½ an hour before departure
 20 3 15 Legend: 1.")
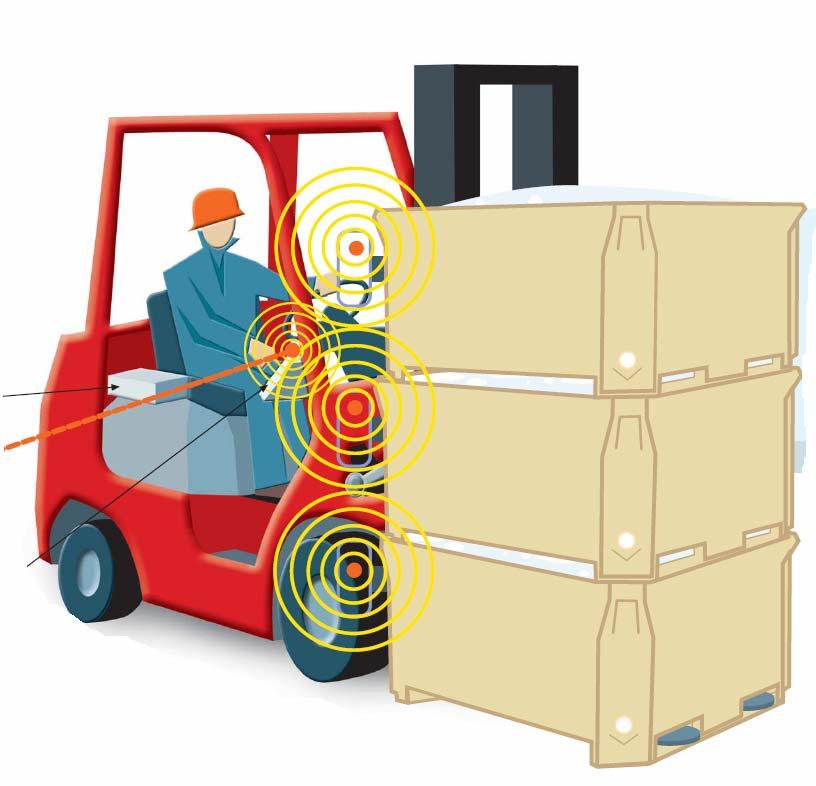
17 Temperature profile for the chain Box 1 (1 free side) Surrounding temperature profile 4 3, Temperature ( C) 3 2,5 2 1,5 1 0, Surrounding temp( C) Bottom Center Top Surrounding temp : : : : :36 Time : : : :12 3,5 Box 2(3 free sides) Legend: 1. Transport from producer to airport; 2. Placement of the pallet in cold storage at airport; 3. Pallets transportation to the plane; 4. Loading in plane; 5. Flight time; 6. Unloading the pallet from the plane at Airport in Belgium; 7. Pallets in the ware house, before loading in the cooling truck; 8. Transport to buyer. Temperature ( C) 2,5 2 1,5 1 0, : : : : : : : : :12 Surrounding ( C) Bottom Center Top Surrounding ( C) (Janaína Almeida, 2006)

18 Temperature difference over box 1 Legend: 1. Transport from producer to airport; 2. Placement of the pallet in cold storage at airport; 3. Pallets transportation to the plane; 4. Loading in plane; 5. Flight time; 6. Unloading the pallet from the plane at Airport in Belgium; 7. Pallets in the ware house, before loading in the cooling truck; 8. Transport to buyer. (Janaína Almeida, 2006)
19 Influence of different processes and temperature conditions (-1,5 C superchilling, 0.5 C and Temp. abuse) on the shelf-life of cod fillets Factory I Factory II Batch 1 (ice) Batch 2 (ice slurry) Batch 3 (ice) Average temperature C! 17 C 16h Traditional (no cooling) 0.5 C!! RT 8h RT 8h D 8days B 11.5d A 12 d Traditional Superchilling process (cooling)! -1.5 C RT 16h 0.5 C 0.5 C 0.5 C I 10.5 d C 12.5 d H 13.5 d E 14.5 d G 15 d F 15+d D A B C E G F I H Initial temperature Average temperature in storage Temperature of fillets in experimental groups From: Olafsdóttir et al., JFS 2006 Days
20
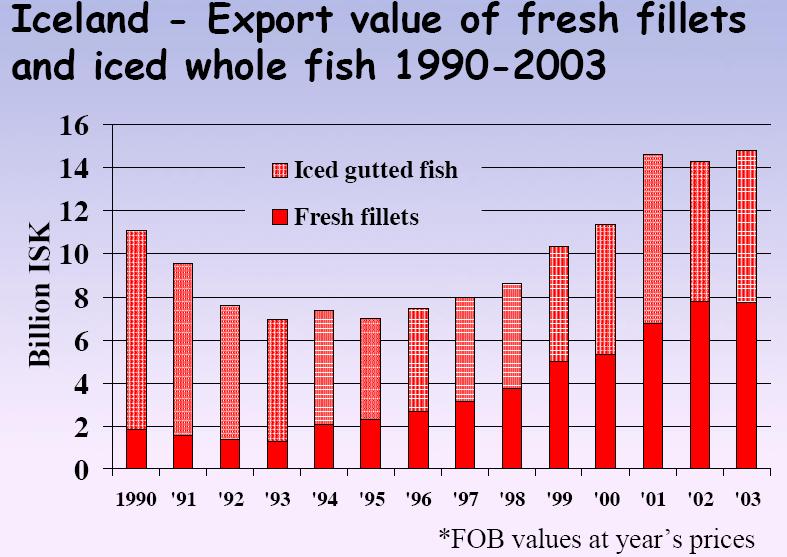
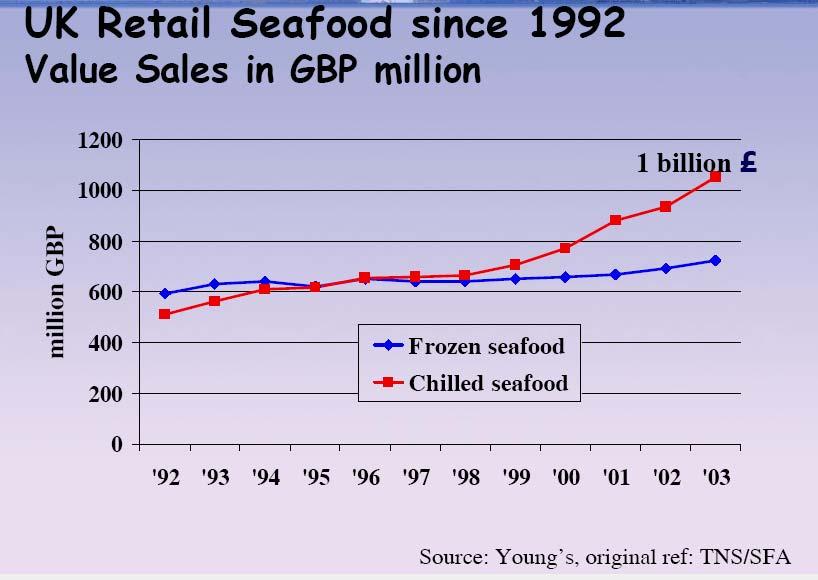
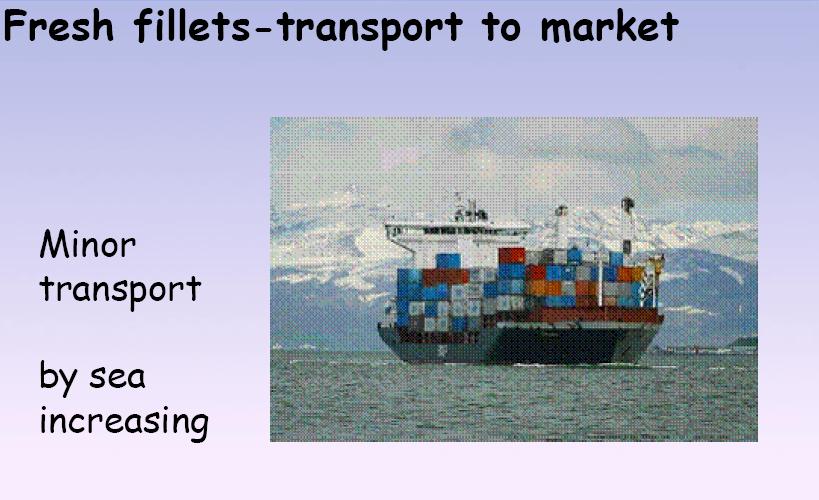
21 (P.G.Pálsson, 2007) Tn Increase of fresh fillets Export of fresh fillets (cod, haddock, saithe) from Iceland Cod fillets Haddock fillets Saithe fillets
22
23
24
25
26


27 Compared the carbon emissions for transporting one kilogram of product by road, sea and air freight. Air freight from South Africa generates 15 kg of CO 2 Sea freight from South Africa generates 0.1kg of CO 2 Road freight from southern Spain, although a shorter distance, generates 0.1kg of CO 2 (IIED, 2006)
28 CO2 emitted per food mile in tonne km for air, sea and road freight - % of the UK s total food tonne km and food transport related CO 2 emissions. The remaining 65% of CO2 emissions, not shown, occur on UK roads. (Air Freight Green Paper, 2005)
29 Average fuel consumption at different fishing ship in Iceland Fishing ship Fuel ratio kg fuel/kg fish Ice fish trawlers 0,43 Factory ships 0,71 Vessels > 10 tons 0,21 Vessels < 10 tons 0,15 Purse seines (herring, capelin) 0,035 Purse seines (blue whiting) 0,089 (G. Rúnarsson R 2000)
30 The emission rates The emission rates of 3.1 metric tons of CO 2 per ton of oil.
31 Total emission of carbon dioxide in Iceland % 3% 33% 18% 1. Fishing 2. Transport 3. Industry 4. Geothermal power plants 5. Others 32%
32 Changes in the global food system Chainreversal consumer producer trade retail retail Past Present trade consumer product push short term linkage oriented market pull long term chain oriented producer Canada, November 1999
33
34 Questions? Comments?
35 However, when reducing our impact on the world s climate we must carefully consider the social and economic benefits of air freight for international development and growth of the organic market as a whole. Some highly perishable fresh food are imported all year round by air. This represents a very small but growing proportion of the carbon emissions from food distribution. The cost of air freighting food is extremely high and likely to rise. Consequently the vast majority of imported organic food comes by ship or road. Businesses avoid air freight when ever possible. Supermarkets strive for continual availability of even the most perishable and exotic produce all year round. Air freight also enables importers to respond to unexpected shortfalls in continuity of supply. There are a range of existing air freight initiatives: Tesco and Marks & Spencer have started labelling air freighted food; some organic box schemes have no air-freight policies. Air freight is the fastest growing form of food transport. UK consumer demand for all year round fresh produce has seen air freight more than double since 1992 and growth is predicted to continue. Air freight has the highest global warming potential of any form of transport. It is less than 1% of the total UK food miles but is responsible for 11% of the CO 2 emissions from UK food transport. Air freight can generate 177 times more greenhouse gas than shipping. (Air Freight Green Paper, 2005)