Complete Week 11 Package
|
|
|
- Grace Thomas
- 5 years ago
- Views:
Transcription
1 Complete Week 11 Package 2015
2 Table of Contents Unit 4 Pacing Chart Day 51 Bellringer Day 51 Activity Day 51 Practice Day 51 Exit Slip Day 52 Bellringer Day 52 Practice Day 52 Exit Slip Day 53 Bellringer Day 53 Activity Day 53 Practice Day 53 Exit Slip Day 54 Bellringer Day 54 Activity Day 54 Practice Day 54 Exit Slip Weekly Assessment
3 CCSS Algebra 1 Pacing Chart Unit 4 Unit Week Day CCSS Standards Mathematical Practices Objective I Can Statements 4 Statistics 4 Statistics 4 Statistics 4 Statistics 11 Representi ng Data 11 Representi ng Data 11 Representi ng Data 11 Representi ng Data CCSS.MATH.CONTENT.HSS.ID.A.2 Use statistics appropriate to the shape of the data distribution to compare center (median, mean) and spread (interquartile range, standard deviation) of two or more different data sets. CCSS.MATH.CONTENT.HSS.ID.A.1 Represent data with plots on the real number line (dot plots, histograms, and box plots). CCSS.MATH.CONTENT.HSS.ID.A.1 Represent data with plots on the real number line (dot plots, histograms, and box plots). CCSS.MATH.CONTENT.HSS.ID.A.2 Use statistics appropriate to the shape of the data distribution to compare center (median, mean) and spread (interquartile range, standard deviation) of two or more different data sets. CCSS.MATH.CONTENT.HSS.ID.A.1 Represent data with plots on the real number line (dot plots, histograms, and box plots). CCSS.MATH.CONTENT.HSS.ID.A.2 Use statistics appropriate to the shape of the data distribution to compare center (median, mean) and CCSS.MATH.PRACTIC E.MP3 Construct viable arguments and critique the reasoning of others. CCSS.MATH.PRACTIC E.MP4 Model with mathematics. CCSS.MATH.PRACTIC E.MP4 Model with mathematics. CCSS.MATH.PRACTIC E.MP5 Use appropriate tools strategically. CCSS.MATH.PRACTIC E.MP7 Look for and The student will be able to compare data sets and be able to summarize the similarities and differences between the shape, and measures of centers and spreads of the data sets. The student will be able to graph numerical data on a real number line using dot plots, histograms, and box plots. The student will be able to describe and give a simple interpretation of a graphical representation of data. The student will be able to determine which type of data plot would be most appropriate for a specific situation. I can compare data sets and be able to summarize the similarities and differences between the shape, and measures of centers and spreads of the data sets. I can graph numerical data on a real number line using dot plots, histograms, and box plots. I can describe and give a simple interpretation of a graphical representation of data. I can determine which type of data plot would be most appropriate for a specific situation Page 1
4 CCSS Algebra 1 Pacing Chart Unit 4 4 Statistics 11 Representi ng Data spread (interquartile range, standard deviation) of two or more different data sets. make use of structure. 55 Assessment Assessment Assessment Assessment 2015 Page 2
5 Day 51 Bellringer Day 51 23, 45, 13, 26, 19, 21, 33, 21, Given the data above, find the mean. 2. Given the data above, find the median. 3. Given the data above, find the mode. 4. Given the data above, find the range Page 3
6 Day 51 Bellringer Answer Key Day Page 4
7 Day 51 Activity In your math class you and your friends have the following grades. John Sejah Jack Lucy Jorge Your teachers announced that to calculate grades, mean will no longer be used. The new measure will be the median. Who does this help? Who does this hurt? Why? (Please organize your findings so that I can understand the results.) 2015 Page 5
8 Day 51 Activity Answer Key Mean Median John Mean Sejah Same Jack Median Lucy Median Jorge Same 2015 Page 6
9 Day 51 Practice 1. Michelle's mean score on eight math quizzes is 89. What must she score on her next quiz to raise her mean score to exactly 90? 2. Construct a set of data that has at least three different numbers and that has 20 as its mean, median, and mode. Tell whatever the mean, median, mode, or range is being used. 3. Half of the homes are priced at $150,000 for less. 4. The most popular shoe size is 7 1/2. 5. The average bill for a customer at Big Burg s is $ The interest-rates for different types of accounts varied by 2.25% 7. The best-selling T-shirt colors are white and navy. Dining out. The price for different entrées at Casa Mexicana are $12, $14, $15, $x, $15, and $14. Find a possible value of X such that 8. There is one mode 9. There are two modes 10. There is no mode 11. Miss Shannon had graded all the tests and determined that the mean of the scores was 78. She forgot to enter one score in her grade book. The tests she had entered were 90, 95, 75, 80, 85, 65, 70, 80, and 60. Find the missing score. A circle graph of the ages of 240 students at McKinley High School was drawn. The table gives the measure, in degrees, of the central angle of the sector representing each age. Age Angle Age Angle Find the number of students of each age Page 7
10 Day 51 Practice 13. Find the mean, median, and mode of the ages. 14. What must be true about a new item of data if it causes the mode of a set to change? 15. What must be true about a new item of data if it causes the mean of a set to decrease? 16. Find two sets of five scores that of a mean of 30, the same range, and different medians. Explain your work Page 8
11 Day 51 Practice Answer Key x 9 = x = 8 x = Example 17,20,20,23 3. Median 4. Mode 5. Mean 6. Range 7. Mode or $ $12 because all values appear the same number of times x 10 x = 80 = x = :6 17:120 16:96 18: mean = , median = 17, mode = the data item must equal at least one item already in the set. 15. the new item must be less than the mean. 16. answer will vary Page 9
12 Day 51 Exit Slip Find the mean, median, mode, and range of the data set: 14, 18, 12, 20 Mean = Median = Mode = Range = 2015 Page 10
13 Day 51 Exit Slip Answer Key Mean = 16 Median = 16 Mode = none, Range = Page 11
14 Day 52 Bellringer Day 52 Find the median of the following sets of data , 45, 13, 26, 19, 21, 33, 21, 40, , 8, 3, , 56, 49, 58, , 6, 7, 2, 0, Page 12
15 Day 52 Bellringer Answer Key Day Page 13
16 Day 52 Practice Name Interpreting Box-and-Whisker Plots 1) Below are the prices of snowboards at two competing snowboard stores: Middletown Snowboards Snowboard Central 345, 350, 356, 360, 375, , 370, 386, 392, 395, 402 a) Identify the 5 main statistics of each set of data. Middletown Snowboards Snowboard Central b) Draw a double box-and-whisker plot of the above data on the scale below: c) What is the median price for a snowboard at Middletown Snowboards? What is the lowest price you could pay for a snowboard at Snowboard Central? What is the most expensive board at Middletown Snowboards? What is the range of prices for snowboards at Snowboard Central? Which price represents the 75 th percentile for Middletown Snowboards? Which store would you rather buy a snowboard from? Why? 2015 Page 14
17 Day 52 Practice Name 2) The accompanying box-and-whisker plot represents the cost, in dollars, of twelve CD s. a) Which cost is the upper quartile? b) What is the range of the costs of the CD s? c) What is the median? d) Which cost represents the 100 th percentile? e) How many CD s cost between $14.50 and $26.00? f) How many CD s cost less than $14.50? 3) The accompanying box-and-whisker plot represents the scores earned on a math test. a) What is the median score? (1) 75 (2) 70 (3) 85 (4) 77 b) What score represents the first quartile? (1) 55 (2) 70 (3) 100 (4) 75 c) What statement is not true about the box and whisker plot shown? (1) 75 represents the mean score (3) 85 represents the 3rd quartile (2) 100 represents the maximum score (4) 55 represents the minimum score d) A score of an 85 on the box-and-whisker plot shown refers to: (1) the third quartile (3) the maximum score (2) the median (4) the mean 2015 Page 15
18 Day 52 Practice Name 4) What is the median price for a snowboard at Middletown Snowboards? What is the median score? (1) 70 (3) 77 (2) 75 (4) 85 5) What is the value of the third quartile shown on the box-and-whisker plot below? (1) 6 (3) 10 (2) 8.5 (4) 12 6) A movie theater recorded the number of tickets sold daily for a popular movie during the month of June. The box-and-whisker plot shown below represents the data for the number of tickets sold, in hundreds. Which conclusion can be made using this plot? (1) The second quartile is 600. (2) The mean of the attendance is 400. (3) The range of the attendance is 300 to 600. (4) Twenty-five percent of the attendance is between 300 and Page 16
19 Day 52 Practice Name 7) The accompanying box-and-whisker plots can be used to compare the annual incomes of three professions. Based on the box-and-whisker plots, which statement is true? (1) The median income for nuclear engineers is greater than the income of all musicians. (2) The median income for police officers and musicians is the same. (3) All nuclear engineers earn more than all police officers. (4) A musician will eventually earn more than a police officer. 8) The data set 5, 6, 7, 8, 9, 9, 9, 10, 12, 14, 17, 17, 18, 19, 19 represents the number of hours spent on the Internet in a week by students in a mathematics class. Which box-and-whisker plot represents the data? 2015 Page 17
20 Day 52 Practice Name 9) The accompanying stem-and-leaf plot represents Ben s test scores this year. What is the median score for this set of data? (1) 73 (3) 80 (2) 79 (4) 81 10) Jorge made the accompanying stem-and-leaf plot of the weights, in pounds, of each member of the wrestling team he was coaching. What is the mode of the weights? (1) 145 (3) 152 (2) 150 (4) Page 18
21 Day 52 Practice Name Answer Key 1. a. Identify the 5 main statistics of each set of data. Middletown Snowboards Snowboard Central min: 345 min: 343 max: 405 max: 402 Q1: Q1: med: 358 med: 389 Q3: Q3; b. Middletown Snowboard c =59 $ a. 26 b. 29-7=22 c d: 29 e. 6 f a. 75 b. 70 c. 75 represent the mean score \ d. the third quartile Twenty-five percent of the attendance is between 300 and (2) the median income for police officers and musicians is the same Page 19

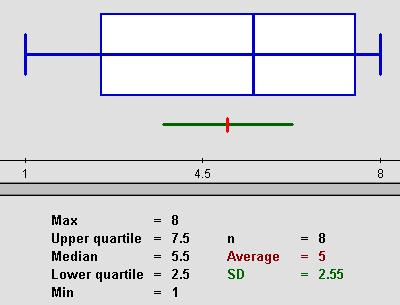
22 Day 52 Exit Slip 1. What is the median? 2. What is the lower quartile? 3. What is upper quartile? 4. What is the minimum value? 5. What is the maximum value? 6. What is the range of the data? 7. What percentage of data is below upper quartile> 8. What percentage of data is located between the lower quartile and the median? 9. What percentage of data is above the median 2015 Page 20
23 Day 52 Exit Slip Answer Key % 8. 25% 9. 50% 2015 Page 21
24 Day 53 Bellringer Day 53 Create a Box Plot for the following data , 9, 18, 4, 6, 10, 9, 15, 13, , 8, 3, 2, 1, 8, 5, Page 22

25 Day 53 Bellringer Day Page 23
26 Day 53 Activity During a lesson, a teacher asks his students to take out their last 50 point-math-quiz for revision. He selects 7 students at random and records their marks as follows: 25, 26, 28, 32, 36, 42, Find their mean score. 2. List the scores that are above the mean score. 3. Find the range of scores. 4. Calculate the interquartile range of the scores. 5. Calculate the standard deviation of the scores Page 24
27 Day 53 Activity Answer Keys Day 53: 1. Mean = , 42 and Range =24 4. Interquartile range = Standard deviation = Page 25

28 Day 53 Practice Temperature in degrees Celsius per day 1. What is the mean temperature for these days? 2. It was warmer than 22 on how many days? 3. It was colder than 22 on how many days? 4. What is the median temperature? 2015 Page 26
29 Day 53 Practice Customer complaints per company 5. How many companies received between 10 complaints and 40 complaints in July? 25% 100% 75% 50% 6. What was the maximum in March? 7. What was the upper quartile (Q3) in April? 2015 Page 27

30 Day 53 Practice Tourist visitors in thousands 8. How many more tourists did February have than January? 9. In how many months were there at least 14 thousand tourists? 10. How many more tourists did October have than November? 2015 Page 28
31 Day 53 Practice Answer Key = % Page 29
32 Day 53 Exit Slip The stem-and leaf plot shows the number of video games sold at a store each day over two weeks. Find the mean median Mean: Median: Mode: Range: 2015 Page 30
33 Day 53 Exit Slip Answer Key Mean 26 Median 29.5 Mode 10,35 Range Page 31
34 Day 54 Bellringer Day 54 You and your friends bring treats to a soccer game. The number of treats are listed below for your group of 8 friends. 16, 18, 34, 23, 34, 21, 17, 21 Another friend shows up for the game and only brings 5 treats. 1. How does the mean change when the ninth friend arrives? 2. How does the median change when the ninth friend arrives? 3. How does the mode change when the ninth friend arrives? 2015 Page 32
35 Day 54 Bellringer Answer Key Day The mean decreases by 2, from 23 to The median does not change. 3. The mode does not change Page 33
36 Day 54 Activity The Standard Deviation is a measure of how spread out numbers are. Part I Before we begin the attached worksheet, we are going to think about the meaning of typical, or standard, deviation from the mean. First, examine the following dot plot which has the mean marked in the plot. Think about how large the deviations would be for each data point (dot). Next we will draw in each deviation from the mean. Now, think about the average size (length) of all of those deviations, and use this as an estimate for the size of the Standard Deviation. Don t worry about whether the deviation is to the left or right of the mean. Just consider all of the lengths. Draw the length of the standard deviation below. Based on the scale in the graph, estimate a numerical value for the length of the line you drew above Page 34

37 Day 54 Activity Repeat the process with this dot plot to help you draw and estimate the length of the standard deviation. Now, try to draw and estimate the length of the standard deviation with the following histogram. The mean of the scores is 2.5. (Hint: Sketch in the appropriate number of dots in each bar of the histogram to make sure you have the appropriate number of deviations.) 2015 Page 35
38 Day 54 Activity Comparing Standard Deviations Below, you will find five pairs of graphs. The mean for each graph ( ) is given just above each histogram. For each pair of graphs presented, Indicate which one of the graphs has a larger standard deviation or if the two graphs have the same standard deviation. Explain why. (Hint: Try to identify the characteristics of the graphs that make the standard deviation larger or smaller.) 1. A = 1.93 B = 2.00 FREQUENCY FREQUENCY A has a larger standard deviation than B B has a larger standard deviation than A Both graphs have the same standard deviation SCORE SCORE 6 Explain Page 36
39 Day 54 Activity 2. A = 5.33 B = 5.48 FREQUENCY FREQUENCY A has a larger standard deviation than B B has a larger standard deviation than A Both graphs have the same standard deviation SCORE SCORE Explain. 3. A = 5.43 B = 5.57 FREQUENCY FREQUENCY A has a larger standard deviation than B B has a larger standard deviation than A Both graphs have the same standard deviation SCORE SCORE Explain Page 37

40 Day 54 Activity 4. A = 2.50 B = 2.56 A has a larger standard deviation than B B has a larger standard deviation than A Both graphs have the same standard deviation Explain. 5. A = 2.50 B =2.50 FREQUENCY FREQUENCY A has a larger standard deviation than B B has a larger standard deviation than A Both graphs have the same standard deviation SCORE SCORE 6 Explain. Reference delmas, R.C. (2001b). What makes the standard deviation larger or smaller? STAR library. Retrieved October 21, 2007, from Page 38
41 Day 54 Activity Answer Key Day 54 Activity 1. B 2. A 3. C 4. A 5. A 2015 Page 39
42 Day 54 Practice STANDARD DEVIATION 1. Use the statistical features of your calculator to find the standard deviation to the nearest tenth of a data set of the miles per gallon from a sample of cars. Mean 14.9, 13.7, 15.7, 20.4, 25.9 Standard deviation 2. Twenty-five people were attending an event. The ages of the people are indicated below: 3,3,3,4,4,4,5,5,6,6,6,6,6,6,7,7,7,7,7,8,8,8,9,9,11,18,18,18 Use the statistical features of your calculator to find the mean and the standard deviation of the data set. Mean Standard deviation 3. Suppose that a teacher plans to give four students a quiz. The minimum possible score on the quiz is 0 and the maximum possible score is 20. a. What is the smallest possible standard deviation of the students' scores? Give an example of a possible set of four student scores that would have this standard deviation. b. What is the set of four students that would make the standard deviations as large as it could possibly be? Use your calculator to find this largest possible standard deviation Page 40

43 Day 54 Practice 4. At a track meet there were three men's 100m races. The sprinters' times were recorded to the nearest 1/10 of a second. The results of the three races are shown in the dot plots below. a. Remember that the size of the standard deviation is related to the sizes of the deviations from the mean. Without doing any calculations, rank the three races from smallest to largest standard deviation of times. Justify your answer. b. Use your calculator to find the mean and the standard deviation for each of the three races. Write your answers in the table below to the nearest thousandths. Race 1 Race 2 Race 3 Mean Standard Deviation 2015 Page 41
44 Day 54 Practice 5. Twenty-two students from the junior class and twenty-six students from the senior class at Davao City High School participated in a walkathon to raise money for the school's band. Dot plots indicating the distances in miles students from each class walked are shown below. DISTANCE WALKED IN MILES (JUNIORS) a. Estimate the mean number of miles walked by a junior and marks it with an "X" on the junior class dot plot. How did you estimate this position? Repeat the same steps for seniors. b. What is the median of the junior data distribution? Senior distribution? c. Is the mean number of miles walked by a junior approximately equal to, or different than the median number of miles? Explain. How about the seniors? 2015 Page 42
45 Day 54 Practice Answer Key 1. Mean: Standard Deviation: Mean: 7.63 Standard Deviation: a. smallest deviation is 0. Any four scores that are the same. b. 0,0,20,20 Standard Deviation: a. 3,1,2 Answers will vary, but should include details about distance from mean. b. Mean Standard Deviation Race Race Race a. Answers may vary b. Senior 5, Junior 5 c. Junior s Mean: 4.8 Senior s Mean: 4.9 They are both approximately the same 2015 Page 43
46 Day 54 Exit Slip Please write the definition of standard deviation in your own words Page 44
47 Day 54 Exit Slip Answer Key The Standard Deviation is a measure of how spread out numbers are Page 45

48 Complete Week 11 Algebra 1 Teachers Weekly Assessment Package Unit 4 Created by: Jeanette Stein Algebra 1 Teachers
49 Complete Week 11 Algebra 1 Common Core Semester 1 Skills Number Unit CCSS Skill 19 4 S.ID.1 Create box plots 20 4 S.ID.2 Calculate and compare measures of central tendencies 21 4 S.ID.3 Understand the effects of outliers 22 4 S.ID.5 Use two way frequency tables to make predictions 23 4 N.QA.1 Convert Units 24 4 N.QA.3 Understand Accuracy 47
50 Complete Week 11 Unit 4 Weekly Assessments 48
51 Complete Week 11 Week #11 1. Find the inverse of f(x) = 2x 7 2. For the group data 4, 4, 6, 10, 13, what is the relationship between the mean and median? 3. Create a box plot for the given data. 21, 20, 5, 18, 7, 16, 8, 5, 22, 19, 12, 9, 8, 20, 20 49
52 Complete Week Find the rate of change between 1980 and 2009 of the given data. Write your answers as a full sentence. The National Data Book Number of dropouts (1,000) to 17 years s.html 5. Predict how much money the average household will spend on clothes in
53 Complete Week 11 Unit 4 - KEYS Weekly Assessments 51
54 Complete Week 11 Week #11 Key 1. Find the inverse of f(x) = 2x 7 2. For the group data 4, 4, 6, 10, 13, what is the relationship between the mean and median? y = x Mean = 7.4 Median = 6 The mean is 1.4 greater than the median. 3. Create a box plot for the given data. 21, 20, 5, 18, 7, 16, 8, 5, 22, 19, 12, 9, 8, 20, 20 52
55 Complete Week Find the rate of change between 1980 and 2009 of the given data. Write your answers as a full sentence. The National Data Book Number of dropouts (1,000) to 17 years = There are approximately 20 fewer dropouts per year from 1980 to Predict how much money the average household will spend on clothes in $