Reverse Logistics. Moving forward in Reverse. Brian Mantel Sprint Tim Long Clover Wireless
|
|
|
- Emory Garrison
- 5 years ago
- Views:
Transcription


1 Reverse Logistics Moving forward in Reverse Brian Mantel Sprint Tim Long Clover Wireless
2 What is Logistics? Forward Logistics: the process that controls the efficient, effective flow and storage of goods from the point-of-origin to the point-of-consumption in order to meet customers requirements (CSCMP - Council of Supply Chain Management Professionals). Reverse Logistics: the movement of products, materials in the opposite direction for the purpose of creating or recapturing value, or for proper disposal (Rogers and Tibben-Lembke, 1999, 2001).


3 What is Logistics? Forward Logistics Place Purchase Order Schedule Delivery Receive & Store Receive Order for Shipment Pick, Pack & Ship Order to Sales Channel Channel Sales Experience Retail Web Manage OS&D Happy Customer

4 What is Logistics? Reverse Logistics

5 What is Logistics?
6 Size of Reverse Logistics There's a good chance your holiday returns will end up in a landfill by Laura Sanicola CNN Money December 26, 2017: 6:54 AM ET Each year, U.S. consumers return about $380 billion worth of goods -- $90 billion of which are processed during the holiday. Only half of returns make it back onto shelves But many returns are sold for pennies on the dollar to liquidators and discounters before ending up at regional wholesalers, who send the goods to pawn shops, dollar stores or even out of the country. The National Retail Federation estimates 15% to 30% of items bought online will be returned -- about $32 billion worth. Returned electronics can lose much of their value over a six-month period. Globally, returns and excess inventory cost retailers $1.75 trillion annually. Due to brand concerns, many companies choose to shred, incinerate or throw away items they can t sell as new "A-stock."


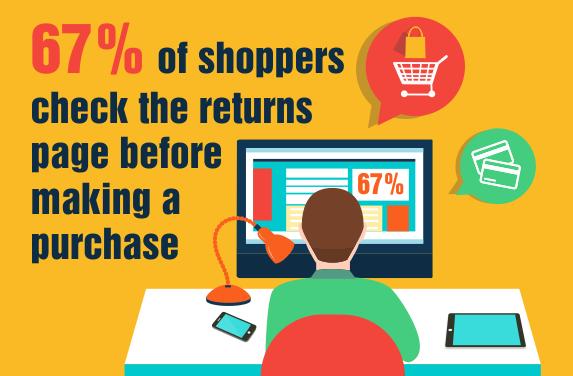


7 Size of Reverse Logistics Infographic by- Invesp Conversion Rate Optimization Company

8 The Return Process Pipeline Recall $$$$ $$$$ Balance $$$ $$ Policy Returns Warranty & Defective 2-21 days 1-3 days Grade & Value Decision Engine Movement $$ $ $
9 Key Elements and Metrics Disposition cycle time: Cycle times can be an important measure of reverse logistics. The more standardized and streamlined the processes are, the shorter the cycle time should be. Products lose value daily.time is money! Amount of product reclaimed and resold: What percentage of product that moves to the reverse logistics system is re-used vs. resold? How much value is recaptured? Do you have a sales channel for your returned goods? Percentage of material recycled: This metric tracks the percentage of product in the reverse logistics stream that is recycled in an appropriate manner. What is your yield in your process? Waste: How much product and secondary materials are moved to landfills, incinerated, or disposed of as waste? The objective is to minimize product in the waste streams. How Green is your company? Percentage of cost recovered: Are you maximizing the profitability of product that did not sell well or has been returned by consumers? Do you have a multi sales channel option or approach? Per item handling cost: A cost-per-touch type of metric can be readily computed by dividing total facility costs per month by the number of items processed. This is also a valuable way to compare the efficiencies of different facilities. How will you benchmark various competitors? Total Cost of Ownership: What is the total cost of ownership related to originally acquiring the product, reselling it, bringing it back as a return, and moving it through a secondary market or placing it in a landfill? How will you calculate your COGS and what is worth additional investment?

10 Reverse Logistics Value Pipeline 20% New Product or Restock Loss in Asset Value ~>45% Grade C Grade B Inbound Returns Flow Product Grading 5% Scrap or Parts Grade D Grade A New 15% End of Life or Auction Scrap 45% Low Touch Refurbishment 15% High Touch Refurbishment or Auction Key element How to move product from lower grades to higher grades (more value)
11 Key Element - Valuation What is your returned inventory worth? This will drive your next best action. GAAP can be valued at Lower of Cost or Market (LCM) Net Realizable Value (NRV) = Estimated Selling Price - Cost of processing and disposal (how much the business can sell the product for) Market = Current Replacement Cost (how much the business would pay to obtain the same product right now) If Current Replacement Cost > Net Realizable Value (NRV), then NRV is Market. If Current Replacement Cost < (NRV - Normal Profit Margin), then (NRV - Normal Profit Margin) is Market. Return Value Cost to Improve Refurb Cost Key Considerations: Is Refurb Cost > Cost of New? Is Cost of New Auction value > Refurb Cost Is Return Value + Cost to Improve < Auction Is Refurb cost + Margin (loss) > Auction
12 Key Element Refurbishment and Re-Use n Remanufacturing and Refurbishment The advantage of Refurbishment is felt through cost savings, grade improvement and value recovery. Five categories of remanufacturing and refurbishment: Make the product reusable for its intended purpose 1) Repair 2) Refurbishing 3) Remanufacturing Retrieving reusable parts from old or broken products 4) Cannibalization Reusing parts of products for different purpose 5) Recycling What are the 5 R s?


13 Remanufacture: An industrial process that re-captures the intrinsic value of products and associated parts & materials. Reuse: Simply reusing the product after data clear & light cleaning Repair: Fixing a functional or mechanical failure, data clear, no cosmetic enhancement. Refurbish: Fixing a functional or mechanical failure, clearing data, some level of cosmetic enhancement. Re-claim: Extracting the individual raw material and processing for use in the production of new or remanufactured product. Disassemble Test Reclaim Repair Refurbish Recondition Recondition: Fixing a functional or mechanical failure, clearing data, restoring original cosmetics; Finished product is Like New Inbound Cores Receiving Triage, Inspection & Warranty Adjudication. Pack/Ship Distribution Centers Demand Channels Unknown state Needs Repair Finished Good Scrap/Liquidation

14 Remanufacture: High Level Process Overview Receipt &Verification Make, model, date received TAT / Aging clock begins Triage & Inspection IW vs OOW Functional & Cosmetic condition Next Best Action Repair /Refurb Disassembly Parts reclaim Test Assemble Final Test Quality AQL In-line & OBA Functional & Cosmetic Pick / Pack / Ship CPO Kitting? Bulk? End User? Disassemble Test Reclaim Repair Refurbish Recondition Inbound Cores Receiving Triage, Inspection & Warranty Adjudication. Pack/Ship Distribution Centers Demand Channels Scrap/Liquidation Unknown state Needs Repair Finished Good
15 Key Elements and Metrics Demand / Supply Forecasting: How many finished goods to you require per day, week, month? Based on your current Yield, how many Cores will you need to send? Your success will depend on your ability to provide accurate and timely Demand and Core Supply forecasts. Product / Process Yield: What percentage of your Core Supply is returned to Finished Goods? What s possible, vs model assumptions, vs actual results? How will you react to an intra day, week, month change? Reclaim Rate: What percent of BOM parts are you able to recover or re-use? What is the Reclaim Rate of your highest cost components? Production / Forecast Attainment: How much of your Demand is being produced? What s the root cause of any negative variances you may have? How will you react to Staffing issues and/or parts delivery delays? What pre-determined business rules are needed, how is the decision made and when? WIP: What s the current state of workable material that s currently available for production? Is the material moving as planned? DBR / BER Rate: Damaged Beyond Repair means the production can not be repaired. Using a car analogy, it s totaled! Beyond Economical Repair means the product can be repaired but the cost no longer makes sense there is a more profitable action to take (liquidate, etc). TAT: Turn Around Time Number of days from Core receipt to Finished Good or Scrap. Cost Per Repair (CPR): Your total cost divided by total Finished Goods. Bounce: Percentage of finished goods that are returned by the end user within days post sale.,
16 Strategic Considerations Who and Where? Roles & Responsibilities? Scope? OEM vs certified repair facility? Domestic, near shore, or off-shore? TAT Labor & Transport cost Single source or multiple suppliers? Reclamation In-house vs outsourced Certifications OEMs SKU s Who will have first touch on returned product? Who will Grade or assign current value? Who will Scrap material you couldn t repair or recover? What s the next best action and who is making that decision? Disassemble Test Reclaim Repair Refurbish Recondition Yield Only Low cost, Low yield New OEM, used OEM, or 3 rd party Max yield, Higher cost per unit Contracts? Lead Times? Supplier qualification & reliability Inbound Cores Receiving Triage, Inspection & Warranty Adjudication. Pack/Ship Distribution Centers Demand Channels Unknown state Needs Repair Finished Good Scrap/Liquidation


 Value")

17 Reclamation - Maximizing overall Value Recovery Serious Commitment Requires deep knowledge of the product including materials, specifications and tolerances, its operating environment, and the associated failure modes. Dedicated Engineering resources Capital equipment Time and Experience Significant Benefits Saves the cost of buying new OEM replacement parts. Creates a secondary parts source: Protect against supply delays / shortages that can shut down production Improves overall product Yield Avoids waist Requirement Definition Input Value adding activities Information Flow Control Environment Ensure requirement s can be met Infrastructure Definition & Resource Allocation Management Policies & Procedures Requirements Review Trends & Establish Policies Create & Deliver Value Operational Process Execution Value adding steps to convert input into valuable output Controls that assure transformation to desired outputs Measure, Analyze and Improve Output Identify Trends & Improvement Opportunities Device Replacemen t (Logistics and Repairs) Value Management System - Continuous Improvement Cycle Behavioral & Emotional Response Customer Experience Life Cycle Value Added Services Product Development Voice of the Customer Sales Channels & Environment Welcome Package & Customer Communicati ons Claims Process

18 Forecasting and Planning Product Life Cycle Management Demand Planning Product Pre-Launch Launch Sustaining Planned Phase Out Last Time Build End of Life Rolling 90/60 demand view Financial commitment? Parts lead times Capacity planning / staffing PHASE I II III IV V VI Disassemble Test Reclaim Repair Refurbish Remanufacture Core Supply Forecasting Core condition Yield assumptions Product Parts Inbound Cores Receiving Triage, Inspection & Warranty Adjudication. Pack/Ship Distributio n Centers Demand Channels Predictability & Timing Scrap/Liquidation Unknown state Needs Repair Finished Good

19 Triage & Inspection: Your Requirements will drive Yield, Cost, and Customer Satisfaction Functional & Cosmetic Specifications Like New or Lightly Used? Disassemble Test Reclaim Repair Refurbish Remanufacture What s the definition of Lightly Used? Balancing customer sat with Yield / Cost. Inbound Cores Receiving Triage, Inspection & Warranty Adjudication. Pack/Ship Distribution Centers Demand Channels What s an acceptable Bounce rate? Sometimes you need to cross the line to find it.. Scrap/Liquidation Calibration and audit Evaluating the need for change daily Unknown state Needs Repair Finished Good
20 Distribution & Shipping Distribution 1. Cascading distribution assignment 2. Multi-tiered customer shipments Disassemble Test Reclaim Repair Refurbish Remanufacture 3. Volume shipping and personnel cost savings 4. Full shipment quality audit Inbound Cores Receiving Triage, Inspection & Warranty Adjudication. Pack/Ship Distribution Centers Demand Channels 5. Systematic order consolidation 6. Broad spectrum of shipment processing Scrap/Liquidation Pick/pack, pick to order, picking Unknown state Needs Repair Finished Good waves for high volume, and pick and hold options

21 Summary and Conclusion How can Reverse Logistics work for you? Dedicated focus on the process Be efficient and consistent in your product handling Have a return policy and stick to it Product value drives next available action Choose refurbishment options to match your market Being Green doesn t have to cost you money Reverse logistics is not simply a matter of moving the product the opposite way.