Orange County Housing Report: Starting to Pull Back. June 3, Good morning!
|
|
|
- Robert Rodgers
- 5 years ago
- Views:
Transcription

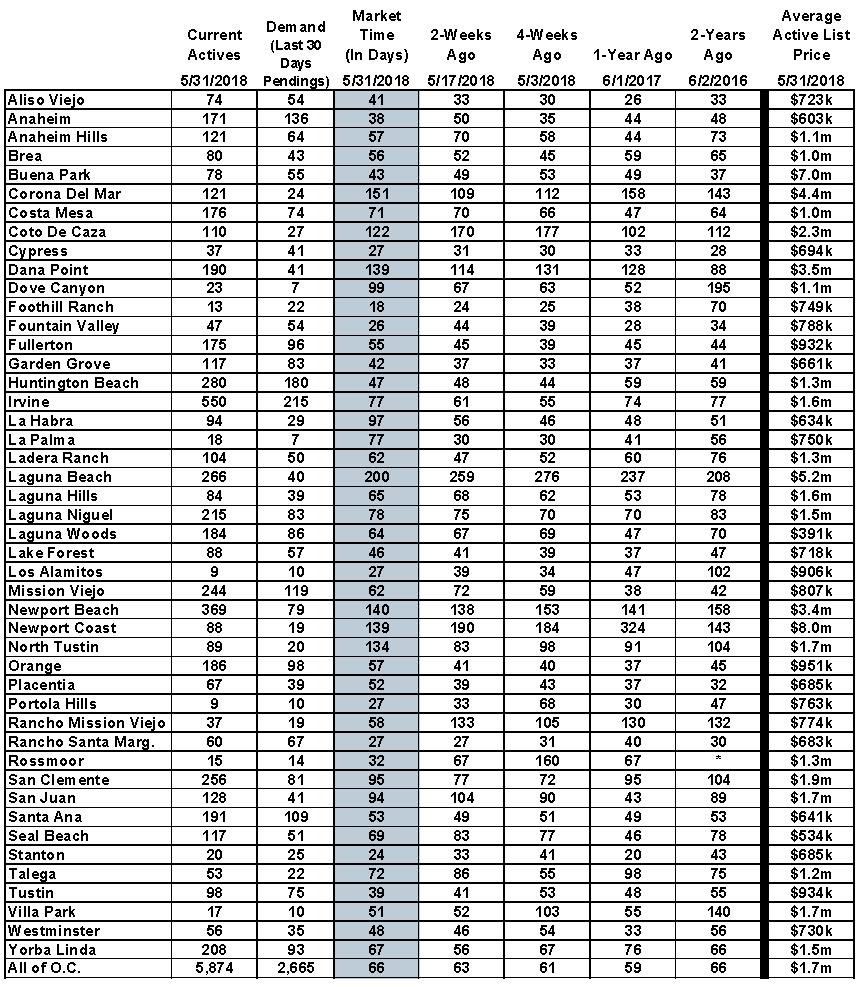
1 Orange County Housing Report: Starting to Pull Back June 3, 2018 Good morning! In the tug-of-war between buyers and sellers, buyers are beginning to pull back. Tug-of-War: There is a noticeable shift in housing as buyers are starting to approach the market with caution. The housing market is like a big game of tug-of-war between buyers and sellers. Sellers have been dominating since 2012 with multiple offers and buyers tripping over themselves to be the winning bidder. As a result, prices have escalated and reached record levels. During the Great Recession, buyers dominated and called the shots. Prices dropped dramatically from 2007 through There is change in the air, and now buyers are beginning to pull back. In the tug-of-war, sellers are still winning, but not if they are overpriced. Sellers are no longer getting away with arbitrarily stretching their asking prices. Buyers are approaching housing a bit different than they did from 2012 through They are much more cautious. Why the caution? The biggest culprits are interest rates and values. Values have increased significantly. The median sales price was up nearly 6% from April 2017 to April Remember, it has been a hot seller s market dating back to 2012, six solid years of home price appreciation. From 2012 to 2018, the median has risen by an astounding 73%. At the end of May 2017, interest rates were at 3.95%. They are at 4.66% today, an 18% increase in a year. With higher values and higher mortgage rates, buyers still want to buy; but, they are getting to the point that they just do not want to pay much more than the most recent comparable sale. The numbers illustrate how buyers are pulling back by simply comparing the current market to last year. They are tugging the rope harder in every single price range except for homes priced between $1.5 million to $2 million (that range still has an expected market time of 123 days and only represents 6% of demand). There may be 43 fewer homes priced below $500,000, but there are also 174 fewer pending sales. There are 103 fewer homes on the market between $500,000 and


2 $750,000, but there are 132 fewer pending sales. These two price ranges account for 54% of all Orange County demand. When the inventory is down, that is great for sellers. It means less competition. Yet, when demand is down significantly, that is not good for sellers. It means fewer successful sellers. Between $750,000 and $1 million, there are 25 more homes on the market and only 2 additional pending sales. That means there is more competition in selling a home and just about the same number of successful sellers. Like the lower ranges, it is a bit harder to sell. This price range represents 23% of demand. The biggest year over year change is occurring in the $1 million to $1.25 million price range. There are 104 more sellers to compete against AND demand is down by 16 pending sales. This price point is a lot harder to sell compared to last year. For homes priced above $2 million, demand may be up, but there is a lot more competition. Overall, there are 95 more homes on the market above $2 million, while demand is up by only 26. Even with the increase in demand, it feels more sluggish in these higher price ranges. The word from the real estate trenches is clear: buyers are approaching housing very carefully and sellers are wondering what happened to the HOT SELLER s market that everybody has been talking about for years. Sellers who are not priced extremely close to their Fair Market Values are not finding success. They are sitting on the market for a long time because buyers are not willing to write offers on their homes. A huge indicator that overpricing is rampant can be found in the number of price reductions. Currently, 11% of the active inventory is reducing their asking price every single week. The bottom line is clear: it may still be a seller s market, but sellers must carefully price their homes in order to be successful in this evolving market. In the tug-of-war between buyers and sellers, buyers are starting to pull back. Active Inventory: The active inventory grew by 3% in the past two weeks. The active listing inventory continued its climb in the past two weeks, just not at the same clip that it had been for the prior six weeks. It rose by 3%, adding 144 homes, and now totals 5,874, its highest level since August Expect the inventory to continue to grow until peaking sometime between July and August. It will eclipse last year s peak of 5,983 homes within the next week or two, and will continue to climb, breaking through the 6,000 home mark for the first time since October 2016.

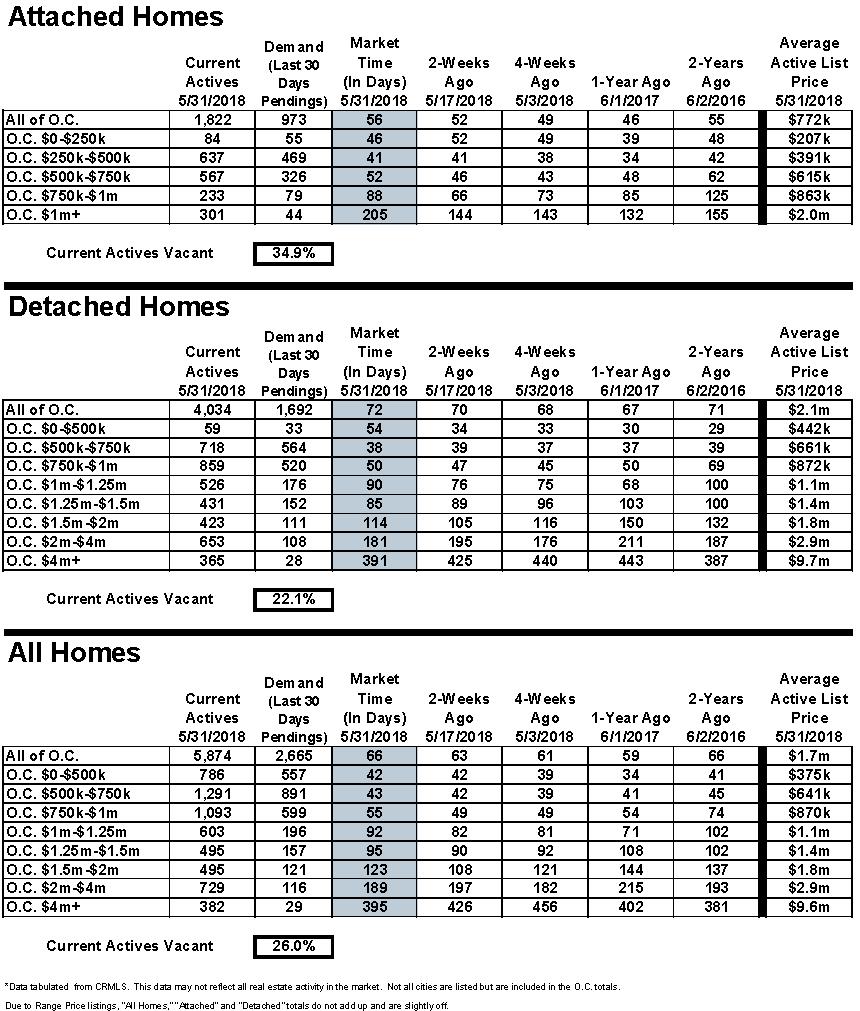
3 Last year at this time, there were 5,757 homes on the market, 2% fewer than today. Four weeks ago marked the first time where there were more homes on the market compared to the prior year since August 2016, ending a 20-month streak. It looks like this new trend of more homes on the market year over year is here to stay. Demand: It appears that demand has peaked for 2018, falling by 2% in the past couple of weeks. In the past two weeks, demand, the number of pending sales over the prior 30 days, decreased by a 61 pending sales. It now totals 2,665, the lowest demand reading for this time of the year since Demand most likely reached a peak for 2018 two weeks ago at 2,726 pending sales. That would be the lowest peak since From here, expect demand to remain the same for the next month and then drop slightly in July and August. The expected market time, the amount of time it would take for a home that comes onto the market today to be placed into escrow down the road, increased from 63 to 66 days in the past two weeks. At 66 days, it is a slight seller s market (between 60 to 90 days) where seller still get to call the shots, but appreciation is muted. Last year at this time, the expected market time was at 59 days, still a hot seller s market (less than 60 days). Luxury End: Demand for luxury homes dropped by 3% in the past couple of weeks. In the past two weeks, demand for homes above $1.25 million decreased by 14 pending sales, down 3%, and now totals 423. The luxury home inventory increased by two homes and now totals 2,101, nearly unchanged. With a drop in demand and a similar supply, the overall expected market time for homes priced above $1.25 million increased from 144 to 149 days over the past two-weeks. Year over year, luxury demand is up by 72 pending sales, or 21%, and the active luxury listing inventory is up by an additional 120 homes, or 6%. The expected market time last year was at 169 days, slower than today. For homes priced between $1.25 million and $1.5 million, the expected market time increased from 90 to 95 days. For homes priced between $1.5 million and $2 million, the expected market time increased from 108 to 123 days. For homes priced between $2 million and $4 million, the expected market time decreased from 197 to 189 days. For homes priced above $4 million, the expected market time decreased from 426 to 395 days. At 395 days, a seller would be looking at placing their home into escrow around the start of July Orange County Housing Market Summary: The active listing inventory increased by 144 homes in the past two weeks, up 3%, and now totals 5,874. Expect the inventory to increase from now through mid-summer. Last year, there were 5,757 homes on the market, 117 fewer than today.
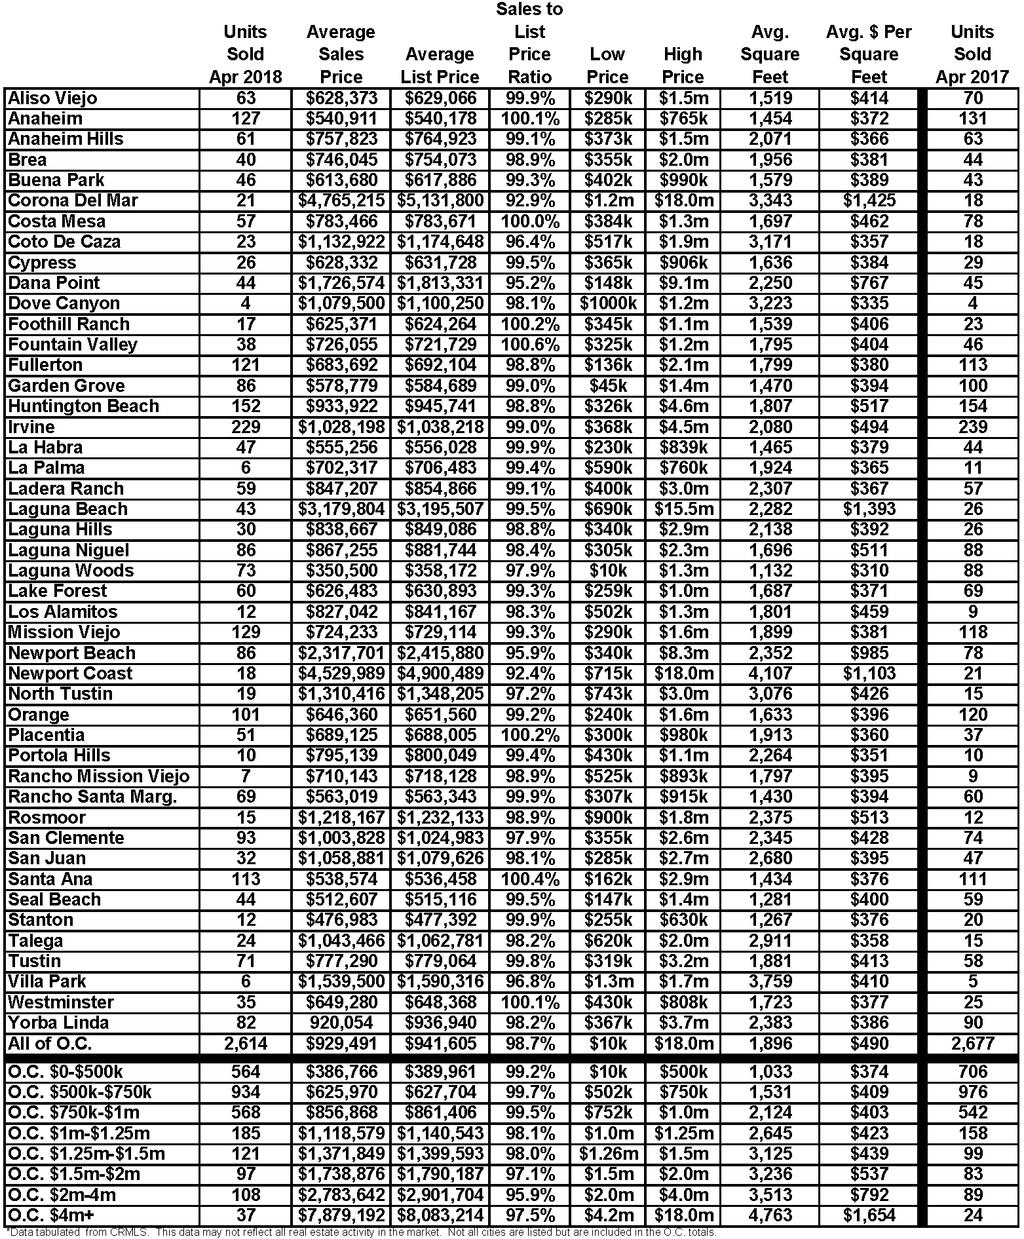
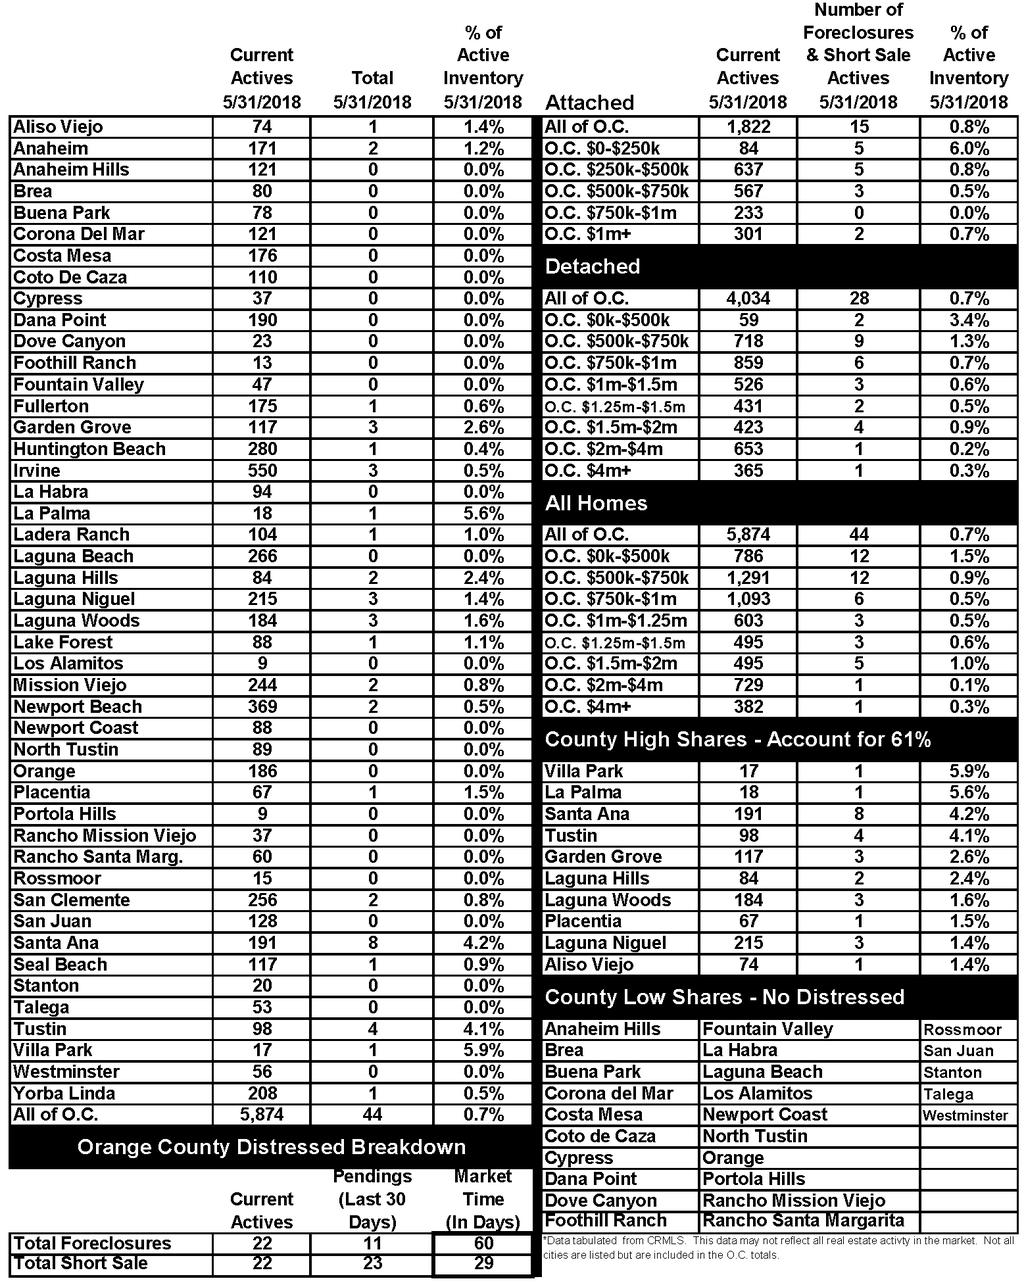
4 This year, 19% fewer homes have come on the market below $500,000 today compared to last year, and there have been 25% fewer closed sales so far this year. Fewer and fewer homes and condominiums are now priced below $500,000. This price range is slowly vanishing. Demand, the number of pending sales over the prior month, decreased in the past two-weeks by 61 pending sales, down 2%, and now totals 2,665. It appears that demand peaked two weeks ago. Last year, there were 2,904 pending sales, 9% more than today. The average list price for all of Orange County remained at $1.7 million over the past two weeks. This number is high due to the mix of homes in the luxury ranges that sit on the market and do not move as quickly as the lower end. For homes priced below $750,000, the market is HOT with an expected market time of just 43 days. This range represents 35% of the active inventory and 54% of demand. For homes priced between $750,000 and $1 million, the expected market time is 55 days, a hot seller s market (fewer than 60 days). This range represents 19% of the active inventory and 23% of demand. For homes priced between $1 million to $1.25 million, the expected market time is 92 days, a balanced market (between 90 and 120 days) where it does not favor buyers or sellers. For luxury homes priced between $1.25 million and $1.5 million, the expected market time increased from 90 to 95 days. For homes priced between $1.5 million and $2 million, the expected market time increased from 108 to 123 days. For luxury homes priced between $2 million and $4 million, the expected market time decreased from 197 to 189 days. For luxury homes priced above $4 million, the expected market time decreased from 426 to 395 days. The luxury end, all homes above $1.25 million, accounts for 36% of the inventory and only 16% of demand. The expected market time for all homes in Orange County increased from 63 to 66 days in the past two weeks, a slight seller s market (from 60 to 90 days). Distressed homes, both short sales and foreclosures combined, made up only 0.7% of all listings and 1.3% of demand. There are only 22 foreclosures and 22 short sales available to purchase today in all of Orange County, 44 total distressed homes on the active market, up two in the past two weeks. Last year there were 76 total distressed homes on the market, 73% more than today. There were 2,614 closed residential resales in April, down by 2% from April 2017 s 2,677 closed sales. April was nearly identical to March 2018 s closings. The sales to list price ratio was 98.7% for all of Orange County. Foreclosures accounted for just 0.5% of all closed sales, and short sales accounted for 0.6%. That means that 98.9% of all sales were good ol fashioned sellers with equity. Have a great week. Sincerely, Steven Thomas Quantitative Economics and Decision Sciences Copyright Steven Thomas, Reports On Housing - All Rights Reserved. This report may not be reproduced in whole or part without express written permission by author.
5
6
7
8
9