Orange County Housing Report
|
|
|
- Marilyn Butler
- 5 years ago
- Views:
Transcription

1 Orange County Housing Report A MARKET CHANGE May 20, 2018 Housing is starting to transition into the Summer Market with a lot more FOR SALE signs and Open House directional arrows. The Summer Market: The active listing inventory is rising and so is the time it takes to successfully sell a home; summer is here. Every year it is the same thing. Multiple open house directional arrows are scattered on the corners of busy intersections. More and more FOR SALE signs are popping up CalBRE # each office independently owned and operated OPEN HOUSE in neighborhoods. There are not quite as many buyer showings as there were only a few weeks ago. The word from the real estate trenches is that it is not as busy and homes are not flying off the shelves as they did before. Sellers are growing concerned. What is going on? Why the sudden shift? It is called SUMMER. The Summer Market begins with the completion of the school year. It is the season of end of the year school concerts, theatrical plays, AP testing, and final exams. It is the season of caps and gowns, commencement speeches, diplomas, and graduations parties. College kids head home for their summer break. Summer has arrived with all of its distractions. Family vacations, bike rides, hiking, trips to the beach, relaxing at the pool, picnicking at the park, fireworks, local concerts, and so much more all pave the way to a bit less real estate activity than the Spring Market. longer it will take to sell. This year, the unmistakable summer shift is much more dramatic than last year. Last year the change was only slight, so the overall market felt a bit hotter. Yet, that was out of the ordinary. This year the shift is not only a lot more palpable, it came a little early, as the market has been cooler than last few years. So many mistakenly feel that now is the best time of the year to come on the market. That just is not true. In fact, in 2018 the best time of the year occurred between February and March. That is when the expected market time, the amount of time it takes to place a home on the market today and place it into escrow down the road, was at its lowest point of the year, between 52 to 54 days. Since then the expected market time has been growing and is at 63 days today. It will continue to rise until the active inventory peaks, sometime between July and August. The longer homeowners wait to place their homes on the market, the As the summer distractions set in, the active listing inventory methodically rises until peaking in two to three months. At the same time, demand peaks now and slowly diminishes through August. With a rising inventory coupled with declining demand, the expected market time rises. The Summer Market is not a time to stretch the asking price. Many sellers are learning the hard way that an overzealous approach to pricing results in wasted, valuable market time. This is precisely why currently 11% of the active inventory is reducing their asking prices every single week. These price improvements are occurring in every price range, even the entry market. Buyers are not willing to overpay for a home. A seller will only find success by carefully pricing their home according to its Fair Market Value. How does a seller determine the Fair Market Value? By carefully comparing their home to the most recent closed and pending sales and relying on the professional analysis and advice of a seasoned REALTOR.


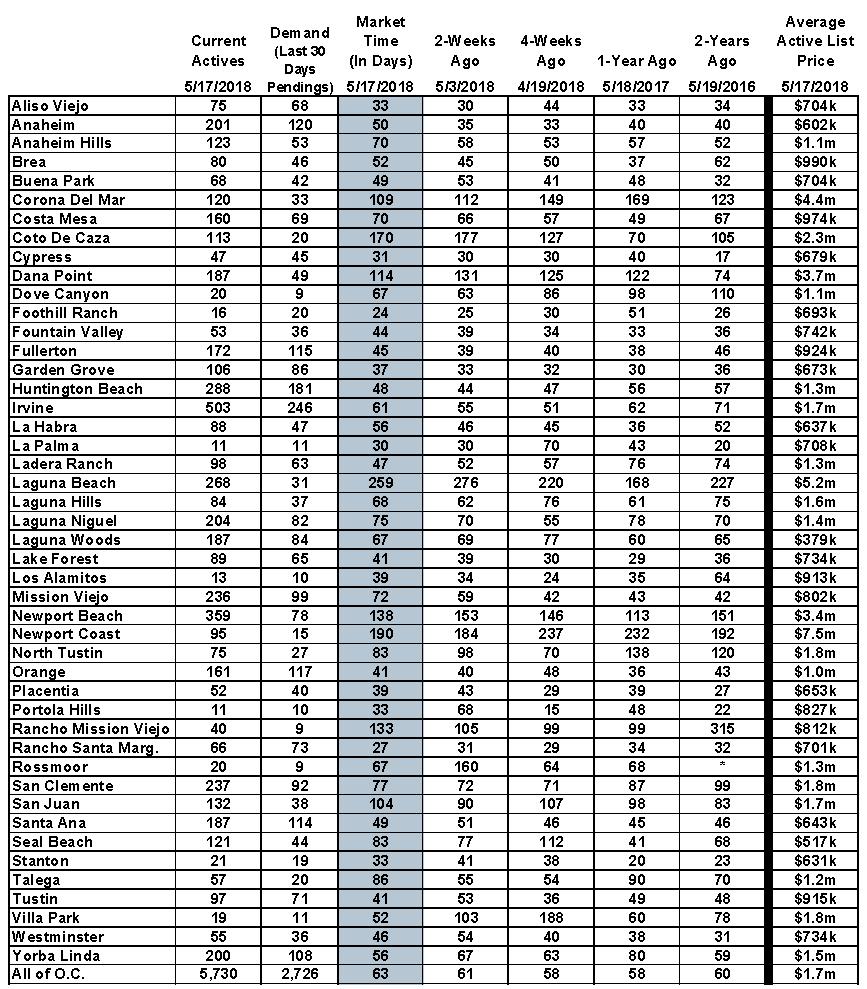
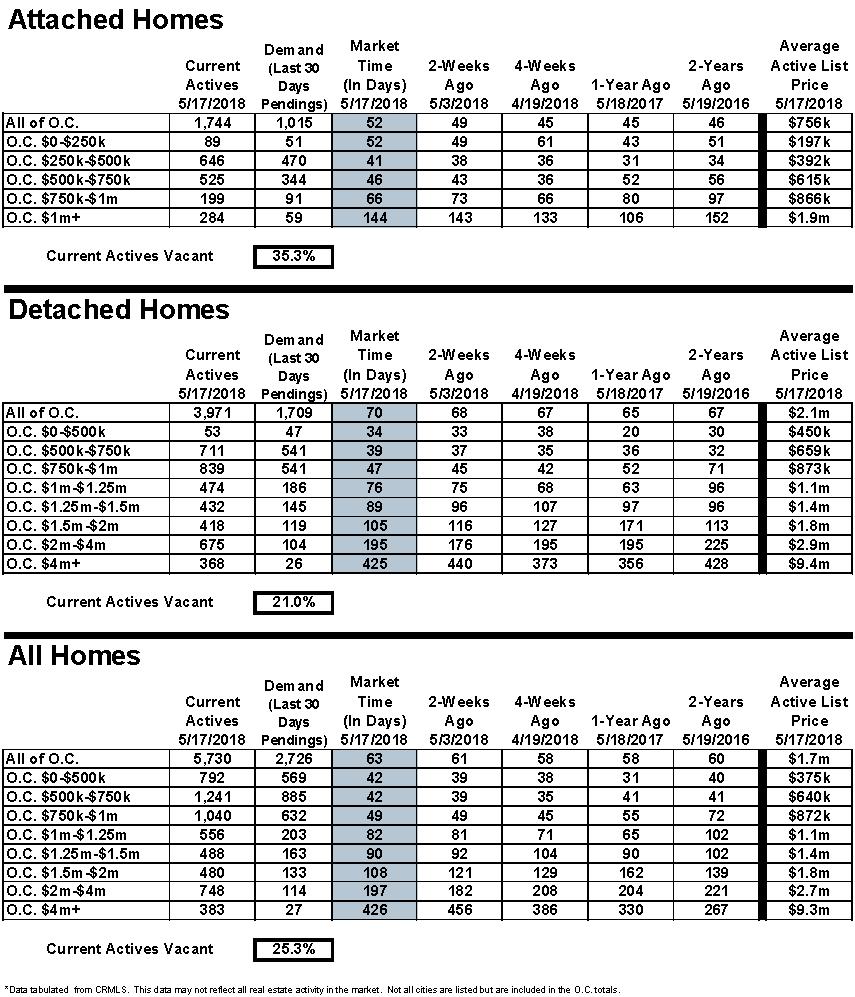
2 The bottom line: there are only 90-days left to take advantage of the second best time of the year to sell a home, the Summer Market. After that, the kids will head back to school and housing will transition into the Autumn Market. Active Inventory: The active inventory grew by 5% more homes in the past two weeks. The active listing inventory continued its swift climb in the past two weeks, adding 296 homes, up 5%, and now totals 5,730, its highest level since August Since the start of April, it has risen by 22%, 995 homes, the largest increase since Expect the inventory to continue to grow until peaking sometime between July and August. Last year at this time, there were 5,623 homes on the market, 2% fewer than today. Two weeks ago marked the first time where there were more homes on the market compared to the prior year since August 2016, ending a 20-month streak. It looks like this new trend of more homes on the market year over year is here to stay. Demand: Demand increased by 2% in the past two weeks. In the past two weeks, demand, the number of pending sales over the prior 30 days, increased by an unimpressive 51 additional pending sales. It now totals 2,726, the lowest demand reading for this time of the year since Demand has most likely reached a peak. Expect it to remain the same for the next month and then drop slightly in July and August. The expected market time, the amount of time it would take for a home that comes onto the market today to be placed into escrow down the road, increased from 61 to 63 days in the past two weeks. It is no longer a hot, seller s market (less than 60 days); instead, it is a slight seller s market (between 60 to 90 days) where seller still get to call the shots, but appreciation is muted. Last year at this time, the expected market time was at 58 days, still a hot seller s market. Luxury End: The luxury inventory and demand increased in the past couple of weeks. In the past two weeks, demand for homes above $1.25 million increased by 25 pending sales, up 6%, and now totals 437. The luxury home inventory increased by 74 homes and now totals 2,099, up 4%. With a larger increase in luxury demand, the overall expected market time for homes priced above $1.25 million decreased from 147 days to 144 days over the past two-weeks. Year over year, luxury demand is up by 68 pending sales, or 18%, and the active luxury listing inventory is up by an additional 134 homes, or 7%. The expected market time last year was at 160 days, slower than today. For homes priced between $1.25 million and $1.5 million, the expected market time decreased from 92 to 90 days. For homes priced between $1.5 million and $2 million, the expected market time decreased from 121 to 108 days. For homes priced between $2 million and $4 million, the expected market time increased from 182 days to 197. For homes priced above $4 million, the expected market time decreased from 456 to 426 days. At 426 days, a seller would be looking at placing their home into escrow around the end of July
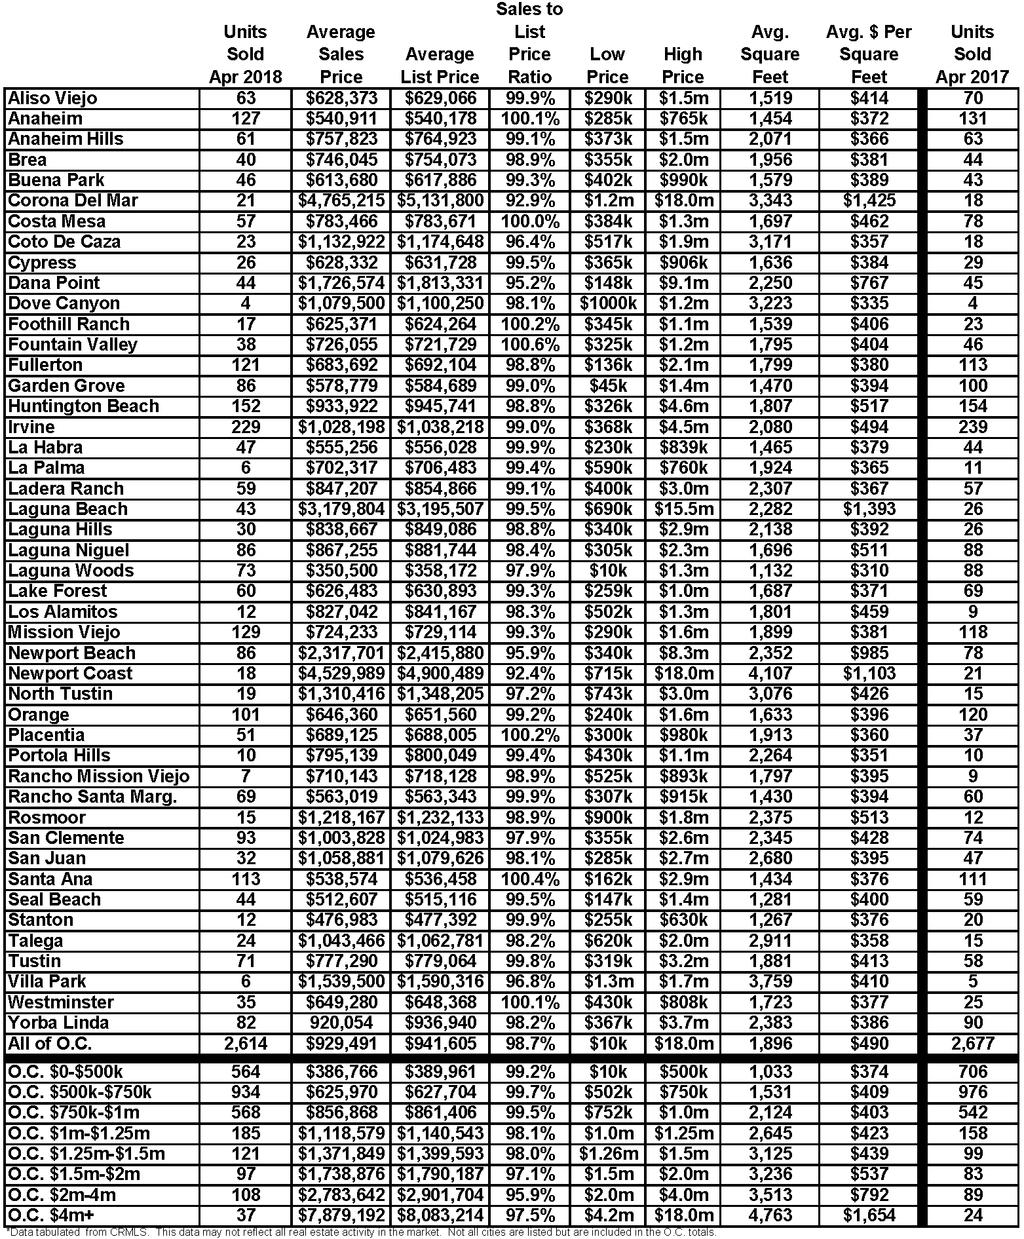
3 Orange County Housing Market Summary: The active listing inventory increased by a substantial 296 homes in the past two weeks, up 5%, and now totals 5,730. Expect the inventory to increase from now through mid-summer. Last year, there were 5,623 homes on the market, 107 fewer than today. This year, 18% fewer homes have come on the market below $500,000 today compared to last year, and there have been 26% fewer closed sales so far this year. Fewer and fewer homes and condominiums are now priced below $500,000. This price range is slowly vanishing. Demand, the number of pending sales over the prior month, increased in the past two-weeks by 51 pending sales, up 2%, and now totals 2,726. Last year, there were 2,914 pending sales, 7% more than today. The average list price for all of Orange County remained at $1.7 million over the past two weeks. This number is high due to the mix of homes in the luxury ranges that sit on the market and do not move as quickly as the lower end. For homes priced below $750,000, the market is HOT with an expected market time of just 42 days. This range represents 35% of the active inventory and 53% of demand. For homes priced between $750,000 and $1 million, the expected market time is 49 days, a hot seller s market (fewer than 60 days). This range represents 18% of the active inventory and 23% of demand. For homes priced between $1 million to $1.25 million, the expected market time is 82 days, a slight seller s market (between 60 and 90 days). For luxury homes priced between $1.25 million and $1.5 million, the expected market time decreased from 92 to 90 days. For homes priced between $1.5 million and $2 million, the expected market time decreased from 121 to 108 days. For luxury homes priced between $2 million and $4 million, the expected market time increased from 182 to 197 days. For luxury homes priced above $4 million, the expected market time decreased from 456 to 426 days. The luxury end, all homes above $1.25 million, accounts for 37% of the inventory and only 16% of demand. The expected market time for all homes in Orange County increased from 61 to 63 days in the past two weeks, a slight seller s market (from 60 to 90 days). Distressed homes, both short sales and foreclosures combined, made up only 0.7% of all listings and 1% of demand. There are only 20 foreclosures and 22 short sales available to purchase today in all of Orange County, 42 total distressed homes on the active market, down two in the past two weeks. Last year there were 68 total distressed homes on the market, 61% more than today. There were 2,614 closed residential resales in April, down by 2% from April 2017 s 2,677 closed sales. April was nearly identical to March 2018 s closings. The sales to list price ratio was 98.7% for all of Orange County. Foreclosures accounted for just 0.5% of all closed sales, and short sales accounted for 0.6%. That means that 98.9% of all sales were good ol fashioned sellers with equity. Sincerely, Steven Thomas Quantitative Economics and Decision Sciences Copyright Steven Thomas, Reports On Housing - All Rights Reserved. This report may not be reproduced in whole or part without express written permission by author.
4
5
6

7

8 WE WANT TO HELP YOU FIND A PLACE CALLED... Home CONTACT US WITH ANY QUESTIONS, WE'D LOVE TO HELP GLOBAL NETWORK OF REAL ESTATE PROFESSIONALS AROUND THE WORLD #KeepingItRealEstate Since 1994 America's Middle East Caribbean Europe Africa Asia Australia South Pacific Knowledge Honesty Integrity DOUG ECHELBERGER CalBRE # Doug@Echelberger.com Each office independently owned and operated. Keller Williams Realty does not guarantee accuracy of all data, including all measurements and calculations of area. Information is obtained from various sources and has not been, and will not be, verified by Broker or Agent of MLS. All information should be independently reviewed and verified for accuracy. Broker CalBRE #