Improving the Customer Experience in VMware using surveys and more
|
|
|
- Neal O’Connor’
- 5 years ago
- Views:
Transcription

1
2 Welcome
3 #TC18 Improving the Customer Experience in VMware using surveys and more Natalia Avilés Fioravanti Senior Research Analyst VMware linkedin.com/navilesf
4 Agenda VMware CX Journey Survey Analysis Executive Dashboards Tips
5 VMware CX journey


6 At VMware, we listen differently We take action In Customer Advocacy we continuously uncover insights to influence business improvements across VMware to maximize customer, partner, and employee experience and ultimately, VMware profitability
7 VMware exists to delight our customers, partners and employees. Our Customer Advocacy team plays a critical role in helping us achieve that goal Pat Gelsinger CEO, VMware

8 We measure great experiences using Net Promoter Score How likely are you to recommend VMware to a colleague or associate? NPS = % of Promoters - % of Detractors

9 Ranking How VMware does stack up in CX? 1 VMware EDS SAP Analytics Microsoft Biz Apps MS Desktop Apps VMware SAS Institute HPE Outsourcing IBM Software HPE Outsourcing EMC Intel IBM SPSS Microsoft Servers MS Desktop Apps VMware Microsoft Servers VMware SAS Institute Google VMware IBM Software DellEMC MS Server Software Tested against 60 other B2B technology companies in Temkin s annual NPS benchmark research, VMware is the only company to rank in the top 5 for 6 years running 5 Microsoft Servers Oracle Outsourcing VMware Oracle Outsourcing Microsoft Biz Apps Trend Micro VMware s NPS in 2018: 51 Average NPS: Source: Temkin August 2018 survey to 800 IT decision makers of North American companies with at least $250 million annual revenue
10 Tableau has a key role Speed of Insights Engaging visualizations Broader audience Storytelling Ease of use
11 Survey analysis

12 How to analyze survey data? Survey tools Data formatting & cleaning Weighting survey data NPS Calculation Create NPS Formula 7pt scale questions Full distribution Top 2 box Show demographic results Filters Parameters


13 Survey Tools


14 Our Survey Twice a year answers NPS + 7pt scale question Main segments: Geographic Segmentation Business Segmentation Role Segmentation
15 Data download & formatting 1. Download the data 2. Change header names from questions to a more significant name 3. Review data format 4. If you are planning to add weighting, now is a good moment
16 Weighting is used to adjust the results of a study to bring them more in line with what is known about a population.
17 To weight or not to weight?
18 Calculated Field: Promoter Calculated field: Promoters Calculated field: Promoters weighted Calculated field: Promoters IF [NPS] > 8 THEN 1 ELSE 0 END Calculated field: Promoters (w) IF [NPS] > 8 THEN [Weight Value] ELSE 0 END
19 Calculated Field: NPS Calculated field: NPS Formula int(round(100*(sum([promoters])/sum([number of Records])-sum([Detractors])/sum([Number of Records])),0))
20 Create your visualization
21 Net Promoter Score (weighted) Calculated field: Detractors (w) IF [NPS] < 7 THEN [Weight Value] ELSE 0 END Calculated field: Passives (w) IF [NPS] > 6 AND [NPS] < 9 THEN [Weight Value] ELSE 0 END Calculated field: Promoters (w) IF [NPS] > 8 THEN [Weight Value] ELSE 0 END Calculated field: Total NPS (w) SUM [Detractors (w)] + SUM [Passives (w)] + SUM [Promoters (w)] Calculated field: NPS Formula (w) int(round(100*(sum([promoters (w)])/[total NPS (w)]-sum([detractors (w)])/[total NPS (w)]),0))
22 How satisfied are you with <product or service>? Extremely Dissatisfied Extremely Satisfied
![Quick table calculations Calculated field: % of Total SUM([Number of Records]) /](/docs-images/90/104341144/images/23-0.jpg "TOTAL(SUM([Number of Records])) Calculated field: % of Total (w) SUM([Weight Value]) /")
23 Quick table calculations Calculated field: % of Total SUM([Number of Records]) / TOTAL(SUM([Number of Records])) Calculated field: % of Total (w) SUM([Weight Value]) / TOTAL(SUM([Weight Value]))
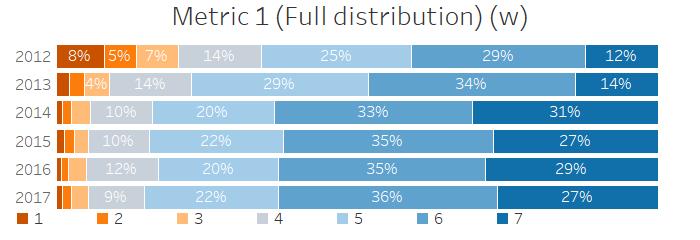
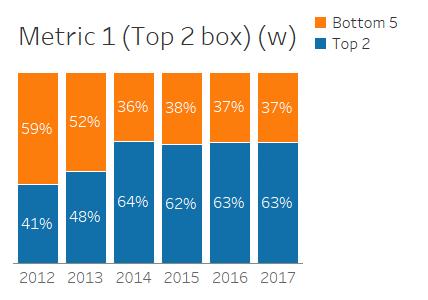
24 Full distribution vs Top 2 box
25 7 point scale Full distribution
26 7 point scale Top 2 box
27 Showing demographic details

28 Demographic details Parameters Calculated field: Breakdown Views CASE [Parameter Breakdown Views] WHEN 1 THEN [Geo] WHEN 2 THEN [Role] WHEN 3 THEN [Segment] END
29 Demographic details Parameters
30 Demographic details Filters
31 Executive dashboard tips
32 Useful tips 1 Know your audience & identify the usage of the dashboards 2 Add counts and KPIs summary 3 Stories, parameters & filters are your friends 4 Leverage online ideas, but trust your own style


33 Useful tips 1 Know your audience & identify the usage of the dashboards 2 Add counts and KPIs summary 3 Stories, parameters & filters are your friends 4 Leverage online ideas, but trust your own style

34 Useful tips 1 Know your audience & identify the usage of the dashboards 2 Add counts and KPIs summary 3 Stories, parameters & filters are your friends 4 Leverage online ideas, but trust your own style Numbers are not real VMware scores

35 Useful tips 1 Know your audience & identify the usage of the dashboards 2 Add counts and KPIs summary 3 Stories, parameters & filters are your friends 4 Leverage online ideas, but trust your own style

36 Useful tips 1 Know your audience & identify the usage of the dashboards 2 Add counts and KPIs summary 3 Stories, parameters & filters are your friends 4 Leverage online ideas, but trust your own style

37 Please complete the session survey from the Session Details screen in your TC18 app
38 #TC18 Thank you!
39 Net Promoter Score Calculated field: Detractors IF [NPS] < 7 THEN 1 ELSE 0 END Calculated field: Promoters IF [NPS] > 8 THEN 1 ELSE 0 END Calculated field: NPS Formula int(round(100*(sum([promoters])/sum([number of Records])- sum([detractors])/sum([number of Records])),0))