Market Structure - Oligopoly
|
|
|
- Alexis Adela Wade
- 5 years ago
- Views:
Transcription
1 Market Structure - Oligopoly
2 The Term Oligopoly has been derived from two Greek words. Oligi which means few and Polien means sellers. Thus Oligopoly is an abridged version of monopolistic competition. It is a competition among few big sellers each one of them selling either homogenous or hetrogenous products.
3 Sources of Oligopoly Factors that give rise to oligopoly are : Huge capital investment Economies of scale. Patent rights Control over certain raw materials Merger and takeover.
4 1. Few Sellers : An oligopoly market is characterized by a few sellers and their number is limited. Oligopoly is a special type of imperfect market. It has a large number of buyers but a few sellers. 2. Homogeneous or Differentiated Product : The Oligopolists produce either homogenous or differentiated products. Products may be differentiated by way of design, trademark or service
5 3. Interdependence : The most important feature of the Oligopoly is the interdependence in decision making of the few firms which comprise the industry. The reactions of the rival firms may be difficult to guess. Hence price is indeterminate under Oligopoly. 4. High Cross Elasticities : The cross elasticity of demand for the products of oligopoly firms is very high. Hence there is always the fear of retaliation by rivals. Each firm is conscious about the possible action and reaction of competitors while making any change in price or output
6 6. Competition : Competition is unique in an oligopoly market. It is a constant struggle against rivals. 7. Group Behaviour : Each Oligopolist closely watches the business behaviour of other Oligopolists in the industry and designs his moves on the basis of some assumptions of their behaviour.
7 9. Uncertainty : The interdependence of other firms for one s own decision creates an atmosphere of uncertainty about price and output 10. Price Rigidity : In an oligopoly market each firm sticks to its own price to avoid a possible price war. The price remains rigid because of constant fear of retaliation from rivals.
8 Various forms of oligopoly 1. Perfect and Imperfect Oligopolies : If the product of the rival firm are homogenous then it is Perfect Oligopoly, if the product are differentiated it is Imperfect Oligopoly. 2. Open and Closed Oligopolies : If entry is open to new firms it is termed as Open Oligopoly, and if entry is strictly restricted it is termed as Closed Oligopoly.
9 3. Collusive Oligopoly : If the firms under oligopoly market combine together instead of competing it is known as Collusive Oligopoly. The collusive may take place in the form of a common agreement or an understanding between the firms. 4. Partial and Full Oligopoly : Partial oligopoly is formed when the dominant firm which is the price leader and all other firms follow the price of the price leader. If no firm acts as a price leader then it is called Full Oligopoly.
10 Oligopoly models Economists have established a number of price-output models for Oligopoly market, depending upon the behaviour pattern of the members of the group. Non collusive oligopoly- Cournot model Sweezy model Collusive Oligopoly- Cartel Price leadership
11 Cournot s duopoly model
12 Duopoly meaning Duopoly is a special case of the theory in which there are only two sellers. The sellers are completely independent and no agreement exists between them. A change in price and output of one will effect the other and may set a chain of reaction. Each seller takes into account the effect of his policy on that of his rival.
13 COURNOT MODEL Developed by a french economist A Cournot in Took the case of two mineral water springs situated side by side and owned by two firms A and B.
14 ASSUMPTION OF COURNOT MODEL Two independent sellers Produce and sell a homogeneous product Each seller faces a demand curve with constant negative slope. Cost of production is assumed to be zero Each seller aims at obtaining maximum net revenue or profit
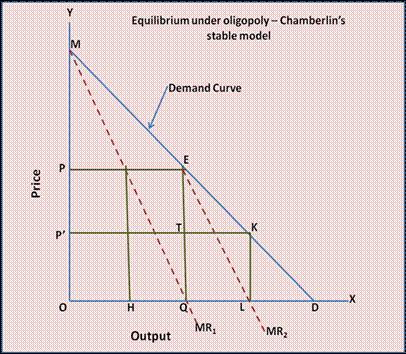
15
16 MD represents the linear demand curve for the homogeneous products of the duopolists. Suppose producer A is operating in the market, he views the whole market demand curve MD facing him and corresponding to which MR 1 is the marginal revenue curve. He will equate marginal revenue with marginal cost to reach his equilibrium which is attained at OQ output and will fix price equal to OP..
17 Now, suppose producer B enters the market. He thinks ED portion of the demand curve to be the relevant demand curve facing him and corresponding to this MR 2 is his marginal revenue curve. With MC being equal to zero, he will produce half of QD that is QL where MR curve intersects X-axis. This reduces the price to P which leads to total profits earned by producer B as rectangle QLKT and for producer A it will get reduced from OPEQ to OP TQ..
18 Faced with this situation, firm A adjusts its price and output to the changed conditions. Assuming that B will continue to supply to ¼ of the market, A assumes ¾ of the market available to it. To maximize its profit, A supplies to 3/8 (1/2 x ¾) of the market. This process goes on till both A and B have equal i.e. 1/3 share in the market and both charge the same price. One third of the market remains unsupplied..
19 Kinked demand curve model (Sweezy model) In many oligopolistic industries, prices remain sticky or inflexible for a long time even though the economic conditions change. Many explanations have been given for this price rigidity under Oligopoly and the most popular explanation is the Kinked Demand Curve Hypothesis given by an American economist Paul Sweezy. It is the best known model explaining relatively more satisfactorily the behavior of oligopolistic firms.
20 According to the kinked demand curve hypothesis, the demand curve facing the Oligopolist has a Kink at the level of the prevailing price. The kink is formed at the prevailing price level because the segment of the demand curve above the prevailing price level is highly elastic and the segment of the demand curve below the price level is inelastic.
21
22
23 There are three ways in which rival firms may react to change in price made by one firm : i) The rival firms follow the price changes, both cut and hike ii)the rival firms do not follow the price changes. iii)rival firms follow the price cuts but not the price hikes.
24 The figure shows a kinked demand curve with a kink. the prevailing price is OP and the firm produces and sells OQ output. The upper segment of the demand curve is relatively elastic and the lower segment is relatively inelastic. The differences in elasticity's is due to the particular competitive reaction pattern assumed by kinked demand curve hypothesis. The assumed pattern is Each Oligopolist believes that if he lowers the price below the prevailing level, his competitors will follow him and accordingly lower their prices, whereas if he raises the price above the prevailing level, his competitors will not follow his increase in price
25 For finding out the profit maximizing price-output combination, MR curve corresponding to kinked demand dd has been drawn. MR curve associated with kinked demand curve dd is always is discontinuous The length of this discontinuity depends upon relative elastics of two segments dk and kd of the demand curve. Between MR & dd which has a discontinuous gap HR. When MC curve of the oligopolistic passes through discontinuous HR through point E oligopolist maximizing its profit at prevailing OP price level. Thus it will not encourage price changes.. When the marginal cost curve shifts upwards from MC to MC due to rise in cost the output remain unchanged since the new MC also passes through HR
26 A } Price Reduction : If an oligopolist reduces the price below the prevailing price to increase sales, the competitors will fear that their customers would go away from them and buy from the firm which has made a price cut. Therefore, in order to retain it s customers, they will also lower the prices. Besides the competitors quickly follow the price reduction by an oligopolist, he will gain only very little sales. Thus the segment of the demand curve which his below the prevailing price OP is inelastic showing that very little increase in sales is obtained
27 B } Price Increase : If an oligopolist raise the price above the prevailing price level, there will be a substantial reduction in sales. as a result of price rise, its customers will withdraw from it and go to its competitors who welcome new customers will gain in sales. The oligopolist who raises its price will lose a great deal and therefore, refrain from increasing price. The segment of the demand curve which lies above the current price level OP is elastic following a large fall in sales if a producer raises his price.
28 Each oligopolist will find himself in such a situation that on one hand, he expects rivals to match his price cuts very quickly and on the other hand, he does not expect his rivals to match his price increase. Given this expected competitive pattern, each oligopolist will have a kinked demand curve dd, with the upper segment dk being relatively elastic and the lower segment kd being relatively inelastic
29 C } Price Rigidity : An oligopolist facing a kinked demand curve will have no incentive to raise its price or lower it. The Oligopolist will not gain any larger share of the market by reducing his price below the prevailing level. There will be a substantial reduction in sales if he increasing the price above the prevailing level. Each Oligopolist will adhere to the prevailing price seeing no gain in changing it.
30 The prevailing price is OP at which a kink is found in the demand curve dd. The price OP will remain stable or rigid as every Oligopoly firm will find no gain to lower it or increase it. Thus rigid or sticky prices are explained according to the kinked demand curve theory.
31 In conclusion, we can opine that mutual interdependence among the firms and price rigidity are two typical features in oligopoly market. Although the firms are rivals, they are mutually interdependent. No firms likes to resort to price change which will harm his business. Hence price competition is not significant is oligopoly market..
32 Criticism of Sweezy model 1. The oligopoly model provides a theoretical explanation as to why stable prices exist in oligopolistic industries. But it takes prevailing prices as given and provides no justification as to why that price level rather than some other is the prevailing price i.e. the kinked demand model can be viewed as incomplete. 2. Stigler had tested the kinked demand curve empirically on several oligopolies. He found that oligopolistic rivals are just as likely to follow price increase as price decreases indicating little support for the kinked demand curve.
33 3. The kinked demand Oligopoly theory does not apply to oligopoly cases of price leadership and price cartels. 4. In case of pure oligopoly, the kinked demand curve does not provide adequate explanation for price rigidity. 5. The explanation of price stability by Sweezy s kinked demand curve theory applies to depression periods. In periods of boom and inflation, when the demand for the products increase, price is likely to rise rather than remain stable.
34 Price leadership models Price leadership is an alternative cooperative method used to avoid tough competition. Under this method, usually one firm sets a price and the other firms follow. Here any firm in the oligopolistic market can act as a price leader. The firm, which is highly efficient, and having low cost can be a price leader or the firm, which is dominant in the market acts as a leader. Whatever the case may be, the firm, which sets the price, is the price leader. We have three forms of price leadershipa) Price leadership by low cost firm. b) Dominant price leadership c) Barometric price leadership.
35 Barometric price leadership Barometric price leadership is said to occur in the market where there is no dominant firm. The firm having a good reputation in the market usually sets the price. This firm acts as a barometer and sets the price to maximize the profits. It is important to note here that the firm in question does not have any power to force the other firms to follow its lead. The other firms will follow only as long as they feel that the firm in action is acting fairly. Though this method is quite ambiguous regarding price leadership, it is legally accepted. Barometric price leadership has been seen in the automobile sector.

36 Price leadership by Low-cost firm
37 Dominant firm price leadership In dominant price leadership, the largest firm in the industry sets the price. If the small firms do not conform to the large firm, then the price war may take place due to which the small firms may not be able to survive in the market

38 Price leadership by a dominant firm
39 Cartel A cartel is an agreement between firms to restrict output and raise price The cartel tries to maximise joint profit the full cartel outcome Cartels aim at market sharing loose cartel Joint profit is maximised by setting MR= MC1=MC2

40
41 The market demand for all members of the cartel is given by DD and marginal revenue (represented by dotted line) as MR. The cartels marginal cost curve given by MCc is the horizontal sum of the marginal cost curves of the member firms. In this the basic problem is to determine the price, which maximizes cartel profit.
42 Reasons for failure of cartels Mistakes in the estimation of market demand Errors in estimating MC Slow process of cartel negotiation cheating on quotas Stickiness of negotiated price. Fear of govt interference Fear of entry Lack of freedom in innovation