Data Warehousing Class Project Report
|
|
|
- Eunice Ross
- 5 years ago
- Views:
Transcription

1 Portland State University PDXScholar Engineering and Technology Management Student Projects Engineering and Technology Management Winter 2018 Data Warehousing Class Project Report Gaya Haciane Portland State University Chuan Chieh Lu Portland State University Rassaniya Lerdphayakkarat Portland State University Rudraxi Mitra Portland State University Let us know how access to this document benefits you. Follow this and additional works at: Part of the Business Analytics Commons, and the Databases and Information Systems Commons Citation Details Haciane, Gaya; Lu, Chuan Chieh; Lerdphayakkarat, Rassaniya; and Mitra, Rudraxi, "Data Warehousing Class Project Report" (2018). Engineering and Technology Management Student Projects This Project is brought to you for free and open access. It has been accepted for inclusion in Engineering and Technology Management Student Projects by an authorized administrator of PDXScholar. For more information, please contact

2 Assignment #7 Class Project Report Course Title: Data Warehousing Course Number: ETM 538/638 Instructor: Mike Freiling, Daniel Sagalowicz Term: Winter 2018 Student Name: Gaya Haciane, Chuan Chieh Lu, Rassaniya Lerdphayakkarat, Rudraxi Mitra 0
3 Table of Content I- Introduction 1 II- The Data 1 III- The Need for the project 1 1- Key Business Objectives 1 2- Key business questions 1 3- Concepts the Organization is already using to analyze the data 2 IV- Procedure of analysis 2 1- Key attributes to use 2 2- Any bucketing you plan to use for key attributes 2 3- Algorithms you think are worth trying. (Only in the class are allowed) 3 4- Evaluation criteria 3 V- Applying the Algorithms R Rule (Bucketing#2) 3 2- Bayesian Naive (Bucketing#2) 4 3-Instant based Classification (Bucketing#2) 4 VI- Conclusion 5 VII- References 6 VIII- Appendix 7 Appendix A: The description of 26 attributes 7 Appendix B : Data and Pivot tables of R1 8 Appendix C : Bayesian Model Probabilities Data 9 Appendix D: Full data table for Instant-Based learning 12 1
4 I- Introduction Data mining is widely described or defined as the discipline of: making sense of the data. In today s day and age, the rise of ubiquity of information calls for more advanced and developed techniques to mine the data and come up with insights. Data mining finds applications in many different fields and industries: Whether it is in Embryology, Crops, Elections, or Business Marketing...etc. It is not a wild assumption to consider that every organization in the world has some data mining capabilities or its main activity necessitates it and they have some third party organization doing that for them. One particular area where data mining is really important is in the business world. Being able to find patterns in the data can tell whether the business survives for another couple of years or not. It can make the difference between being a fortune 500 company and bankruptcy and everybody who is interested in growth and sustainability knows that. During the whole course, we learned methodology and did assignments for practicing data mining and data warehousing. In this class project, we try to put to practice as many concepts as those learned in class and apply 3 algorithms from class (1-R, Bayesian, and Instant-based). II- The Data The data set that was used for this project was retrieved from IBM Watson Analytics online community platform where other datasets are made available [1]. This is dataset comes from a car insurance company whose name was undisclosed. The data set has 26 attributes and 9134 records. It has no missing values and the dependent variable is the attribute: CLV, standing for customer lifetime value. The description of 26 attributes along with their nature (numerical, categorical, answer, question, link) is shown in Appendix A. Definition: Customer lifetime value is a marketing concept that refers to the amount of money that will be made from a customer over its lifetime as a company customer. In its calculation the analyst should be mindful of the Cost of Customer Acquisition (CAC), periodic profit made from this customer over a certain period of time and the duration this customer will still be a customer of the company. CLV is popular concept in Banks, insurance companies (cars, health etc.) and virtually any business. III- The Need for the project 1. Key Business Objectives The Key business objectives of this project is to increase the Customer Lifetime Value (CLV) of customers of a car insurance company. The objective will be met by analyzing the different attributes and how they impact the CLV. The project insights will serve in designing predictive analytical methods that will help the business owner tell whether a prospective customer will have a high lifetime value or not and based on that have our client act on some aspects to either keep the CLV high or take action to increase it. 2. Key business questions 1. Who are the customers that have the higher customer lifetime value? This can be categorized by (gender, location, age, income, vehicle type, employment...etc). 1
5 2. What type of insurance generates the most value by claims? 3. Which vehicles type and size has the most claim amount? 4. What policy type is more profitable? 5. What channel has is the most conversion rate? 6. Who are the customers that have the highest risk of recurring claims? (categorize them by education) 7. What are expiration date of different insurance policies by their coverage type? 8. What are coverage type of insurance that have most complains? 9. What is the number of complains of a certain policy types? 10. What are the months since last inception and months since last claim for a certain no of policy types? 3. Concepts the Organization is already using to analyze the data This dataset was made available by IBM Watson analytics for, mostly, academic reasons. The name of insurance company as specified earlier was no disclosed. The tool that is used to analyze the data is IBM Watson Analytics which is an advanced data analysis and visualization solution in the cloud and the concepts involved are: Natural language dialogue, Automated predictive analytics, One-click analysis, Smart data discovery, Simplified analysis, Accessible advanced analytics, Self-service dashboards. IV- Procedure of analysis 1. Key attributes to use In this project the key attributes to use are: VehicleClass, Monthly premium amount called Premium, and type of insurance coverage called Coverage. We use three different algorithms, but all of three key attributes were used in the 3-different algorithm as well. 2. Any bucketing you plan to use for key attributes Two attributes (Customer Lifetime Value and Premium) that were used in all the analyses were bucketed. The bucketing happened twice. While running the Bayesian Naive algorithm we made the following buckets: Bucketing#1 Customer lifetime value (CLV) Bucket A: CVL <= $5,000 per year Bucket B: $5000 < CVL <= $20000 per year Bucket C: $20000 < CVL <= $40000 per year Bucket D: $40000 < CVL <= $60000 per year Bucket E: $60000 < CVL per year Monthly premium buckets (Premium) Low: premium<= $100 Medium: $100< premium <=$150 High: $150 < premium Bucketing#2 Customer lifetime value (CLV) Bucket A: CVL <= $3,000 per year Bucket B: $3,000 < CVL <= $6,000 per year Bucket C: $6,000 < CVL <= $12,000 per year Bucket D: $12,000 < CVL <= $24,000 per year Bucket E: $24,000 < CVL per year Monthly premium buckets (Premium) Low: premium <= $100 Medium: $100 < premium <= $150 Mid-high: $150 < premium <= $200 High: $200 < premium 2
6 The need for bucketing again stems from the fact that the first buckets did not give satisfying answers and therefore needed to be checked out. The results of our analyses that we present here are the ones associated with Bucketing#2 3. Algorithms you think are worth trying. (Only in the class are allowed) Algorithms that are worth trying are: R1, Bayesian Naive, and Instant based classification. 4. Evaluation criteria Depending on the algorithm, evaluation criteria might change, but the universal: Low error rate, high support and high probability should be the main evaluation criteria. Therefore, a good rule will be one that has a lot of support (big enough sample to study it), has low error and its probability of happenstance is considerable high. V- Applying the Algorithms 1. 1-R Rule (Bucketing#2) After getting the new buckets, we used 1-R to find the best rules to predict CLV based on the three attributes as mentioned. We did 1-R in a single condition, two conditions, and three conditions. For the single condition, we did calculate the error as you can see in Appendix B. The two and three conditions R1, we showed the best rules with the support, and accuracy as following. We used count of CLV buckets instead of average the CLV because CLV has huge range of data which will not provide insight data where the majority is from. From the Pivot table The best 1-condition rule: 1). if Premium = high, then CVL Bucket = D, error =56.27% 2). if Coverage = extended, then CVL Bucket = C, error = 55.22% 3). if VehicleClass = Luxury Car, then CVL Bucket = D, error = 54.6% Note: the errors from 1-condition rule are high because there are five bucket which means it has less percent to have the same result from one condition. The best 2-condition rule: 1). if Coverage = Premium & Premium = high, Then CLV = C (support = 31, confidence = 31/48, accuracy = 64.6%) 2). if Coverage = Premium & VehicleClass = Luxury SUV, Then CLV = C (support = 17, confidence = 17/26, accuracy = 65.4%) 3). if Premium = low & VehicleClass = Sports Car, Then CLV = C (support = 8, confidence = 8/12, accuracy = 66.7%) Note: in finding support and accuracy, for each rule, we found from Pivot table by adding sup-row to show counting of each CLV in each condition. The best 3-condition rule: 1). if Coverage = Premium & VehicleClass = Luxury SUV & SalesChannel = Agent, Then CLV = C (support = 16, confidence = 16/19, accuracy = 84.2%) 2). if Premium = low & Vehicle Class = Sports car & EmploymentStatus = Employed, Then CLV = C (support = 6, confidence = 6/7, accuracy = 85.7%) 3
 Note: in finding support and accuracy, for each rule, we used the pivot tables form 2-")
7 3). if Coverage = Premium & Premium = high & SalesChannel = Agent, Then CLV = C (support = 25, confidence = 25/28, accuracy = 89.3%) Note: in finding support and accuracy, for each rule, we used the pivot tables form 2-condition and filtered the third condition to find the best rules with high accuracy. 2. Bayesian Naive (Bucketing#2) The Bayesian model was run to find the value of CLV associated with each combination of values of the attributes (VehicleClass, Coverage and Premium) along with returning the probability of accurate decision for each decision. The full data will be presented in an Excel file that will be attached with this report. Also, it can be found at the Appendix C. Following is an example of one of the best rules that we can come up with by running the Bayes Naive Algorithm. Once the Bayes model is set up, The insurance company, whenever faced with a new customer profile, they can pick their data and enter them to the model and then the model will be able to predict with relatively good accuracy in what CLV bucket category this customer will be falling and hence will help the insurance company take action based on that. 3. Instant based Classification (Bucketing#2) In the instant-based classification method, the second buckets of the data were used. Only three attributes were considered: VehicleClass, Coverage type, and Premium Amount. A few instances (records) of those variables were taken to run the algorithm. As seen in class, the Instant-based classification can turn out to be very time-consuming with long running times when you have large amounts of data. The full data will be presented in an Excel file that will be attached with this report. The training set is shown in the table below. In interpretation of the results, only 14 out of 72 (20%) possible combinations of the data take on one CLV value without ambiguity. (Shown across). It is clear from the results that this Algorithm is not adapted for all possible variables. It appears to do well when Premium Coverage value is selected. As the table shows. This Algorithm despite its ability to work very well with the data takes a long running time and performed poorly, and therefore we do not recommend using it to analyze this data with no automatic system. The recommendations we can infer from the results to make the algorithm more robust as far as analyzing out insurance company data are the following: 4

8 1- Experiment with different bucketing schemes. 2- Make the training sample a bit bigger. (which could be very time consuming if done manually). VI- Conclusion In this class project, an insurance company data set was analyzed. The team worked on applying all the important algorithms learned in class, and we tried to put to practice all the different concepts and techniques that were seen. The algorithms performed differently, which puts in perspective the idea of using the right algorithms for the the right application. Insights from this class project are summarized in what follows: a) Insights regarding the methods: Algorithms can be application dependent. Bucketing can change the results of your analysis and therefore, one has got to be mindful of selecting robust and rational bucketing schemes to ensure the data is not completely skewed. Increasing the number of attributes used in an analysis, in most cases (in this project) increases the accuracy of prediction, but one has to be mindful to select just the right number of attributes. Overfitting issues might rise, and that will make the analysis insights basically useless. b) Insights regarding the results of our application Depending on the application, our client can use any algorithm to predict the CLV of prospective customers. Ex: 1-R 3-condition can be used to target new customers offering premium coverage, with high monthly premium amount and reach out to them via agent will lead to C-level CLV. The algorithms results can either be used by the insurance company to either improve their Customer Relationship Management, or even to acquire new customers. Once the models are set up, our client can use them to answer any of the business questions they might have. The attributes that our client should focus on should be: VehicleClass, Coverage, Premium amount, and Sales Channel. 5
9 VII- References [1] SAMPLE DATA: Marketing Customer Value Analysis, IBM Analytics Communities, 11- Apr [Online]. Available: [Accessed: 09-Mar-2018]. [2] IBM Watson Analytics, IBM Watson Analytics - Overview - United States, 10-Mar [Online]. Available: [Accessed: 09- Mar-2018]. [3] Witten, I., Frank, Eibe, & Hall, Mark A. (2011). Data mining : Practical machine learning tools and techniques (3rd ed., Morgan Kaufmann series in data management systems). Burlington, MA: Morgan Kaufmann. 6
10 VIII- Appendix Appendix A: The description of 26 attributes The attributes along with their nature are shown in the following table: Attribute Description Type Nature Customer Different customers with their own ID Text and Integer Link State Name of states in which insurance is sold Text Answer Customer Lifetime Value (CLV) The time period since a particular person has been paying premiums Currency Key- Answer Response No or yes response to the coverage of insurance type Text Answer Coverage The coverage type of insurance Text Answer Education The education of customers buying the insurance Text Answer Effective to Date The time period until the insurance is active Date Answer Employment Status The employment status of customer Text Answer Gender The gender of each customer buying insurance Text Answer Income The income of customers buying insurance Currency Answer Location Code The location of each customer Text Answer Marital Status The marital status of each customer Text Answer Monthly Premium Auto The insurance premiums paid for each auto Integer Answer Premium The amount paid for an insurance policy Text Answer Months Since Last Claim The number of months passed since the insurance is claimed. Integer Answer 7
11 Months Since Policy Inception The insurance was first purchased Integer Answer Number of Open Complaints The number of complaints by each customer Integer Answer Number of Policies The number of policies sold by each customer Integer Answer Policy Type The types of insurance policy Text Answer Policy Name of policy Text Answer Renew Offer Type The type of offer Text Answer Sales Channel The channel through which insurance is sold Text Answer Total Claim Amount Claimed amount of each policy type of insurance Currency Answer Vehicle Class The class of vehicles being most claimed Text Answer Vehicle Size The size of vehicles that has auto insurance Text Answer Appendix B: Data and Pivot tables of R1 The training Data: 8


12 The Pivot Table for Premium The Pivot Table for Coverage The Pivot Table for Vehicle Class Appendix C : Bayesian Model Probabilities Data Vehicle Class: 9


13 Coverage Type: Monthly Premium: 10

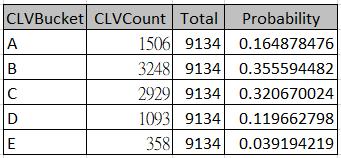

14 CLV Bucket: Predictive Model: 11
15 Appendix D: Full Table for Instant Based Learning 12
16 Observation Sequence Decision Error 1 Two-Door low Extended A-A-B-B-B-C B 50% 2 Two-Door low Basic A-A-C-C A-C 50% 3 Two-Door low Premium 4A-4B-3C-D A-B 67% 4 Two-Door medium Extended 2A-3B-2C-D B 62.50% 5 Two-Door medium Basic C-D C-D 50% 6 Two-Door medium Premium B-C-2D D 50% 7 Two-Door Extended 2A-3B-1C B 50% med- 8 Two-Door high Basic 2A-3C-1D C 50% Premium B-D B-D 50% 9 Two-Door 10 Two-Door high Extended 2A-3B-C-D B 58% 11 Two-Door high Basic 2A-3C-2D C 58% 12 Two-Door high Premium D D 0% 13 Four-Door low Extended 2A-3B-C B 50% 14 Four-Door low Basic 2A-2C A-C 50% 15 Four-Door low Premium 4A-4B-3C-D A-B 67% 16 Four-Door medium Extended 2A-3B-2C-D B 62.50% 17 Four-Door medium Basic C-D C-D 50% 18 Four-Door medium Premium B-C-2D D 50% 19 Four-Door 20 Four-Door Extended 2A-3B-1C B 50% Basic 2A-3C-D C 50% Premium B-D B-D 50% 21 Four-Door 22 Four-Door high Extended 2A-3B-C-D B 57% 23 Four-Door high Basic 2A-3C-2D C 57% 24 Four-Door high Premium D D 0% 25 SUV low Extended 2A-3B-C B 50% 26 SUV low Basic 2A-3C-D C 50% 27 SUV low Premium D D 0% 28 SUV medium Extended C-D C-D 50% 29 SUV medium Basic C-D C-D 50% 30 SUV medium Premium B-C-D B-C-D 66% 31 SUV 32 SUV Extended B B 0% Basic B-C-D B-C-D 66% Premium B B 0% 33 SUV 34 SUV high Extended 2A-4B-2C-2D B 60% 35 SUV high Basic C-D C-D 50% 36 SUV high Premium B-D B-D 50% 37 Luxury Car low Extended 2A-3B-C-2E B 54% 38 Luxury Car low Basic 2A-2C-D A-C 60% 39 Luxury Car low Premium D D 0% 40 Luxury Car medium Extended 2E E 0% 41 Luxury Car medium Basic C-D C-D 50% 13
17 42 Luxury Car medium Premium D D 0% 43 Luxury Car Extended 2E E 0% 44 Luxury Car Basic 2A-3C-3D-2E C-D 70% 45 Luxury Car Premium D D 0% 46 Luxury Car high Extended 2E E 0% 47 Luxury Car high Basic 2E-D E 30% 48 Luxury Car high Premium D D 0% 49 LuxurySUV low Extended 2A-3B-C-D-E B 62% 4A-3B-3C-2D- 50 LuxurySUV low Basic E A 70% 4A-4B-3C-3D- 2E A-B 75% 51 LuxurySUV low Premium 52 LuxurySUV medium Extended D-E D-E 50% 53 LuxurySUV medium Basic C-D C-D 50% 54 LuxurySUV medium Premium B-C-3D-2E D 57% 55 LuxurySUV 56 LuxurySUV Extended D-E D-E 50% Basic 2A-3C-3D-E C-D 67% Premium B-2D-2E D-E 60% 57 LuxurySUV 58 LuxurySUV high Extended D-E D-E 50% 59 LuxurySUV high Basic D-E D-E 50% 60 LuxurySUV high Premium 2D-E D 33% 61 Sport car low Extended 2A-3B-C B 50% 62 Sport car low Basic 2A-2C-D A-C 60% 63 Sport car low Premium E E 0% 64 Sport car medium Extended C-D-E C-D-E 33% 65 Sport car medium Basic C-D C-D 50% 66 Sport car medium Premium E E 0% 67 Sport car 68 Sport car Extended 2A-3B-C-D-4E E 63% Basic 2A-3C-2D-E C 62.50% Premium D-3E E 25% 69 Sport car 70 Sport car high Extended 2A-3B-C-D B 57% 71 Sport car high Basic 2A-3C-4D-4E D-E 70% 72 Sport car high Premium D-E D-E 50% 14