Orange County Housing Report: A Different Start. January 14, Good morning!
|
|
|
- Janice Cummings
- 5 years ago
- Views:
Transcription


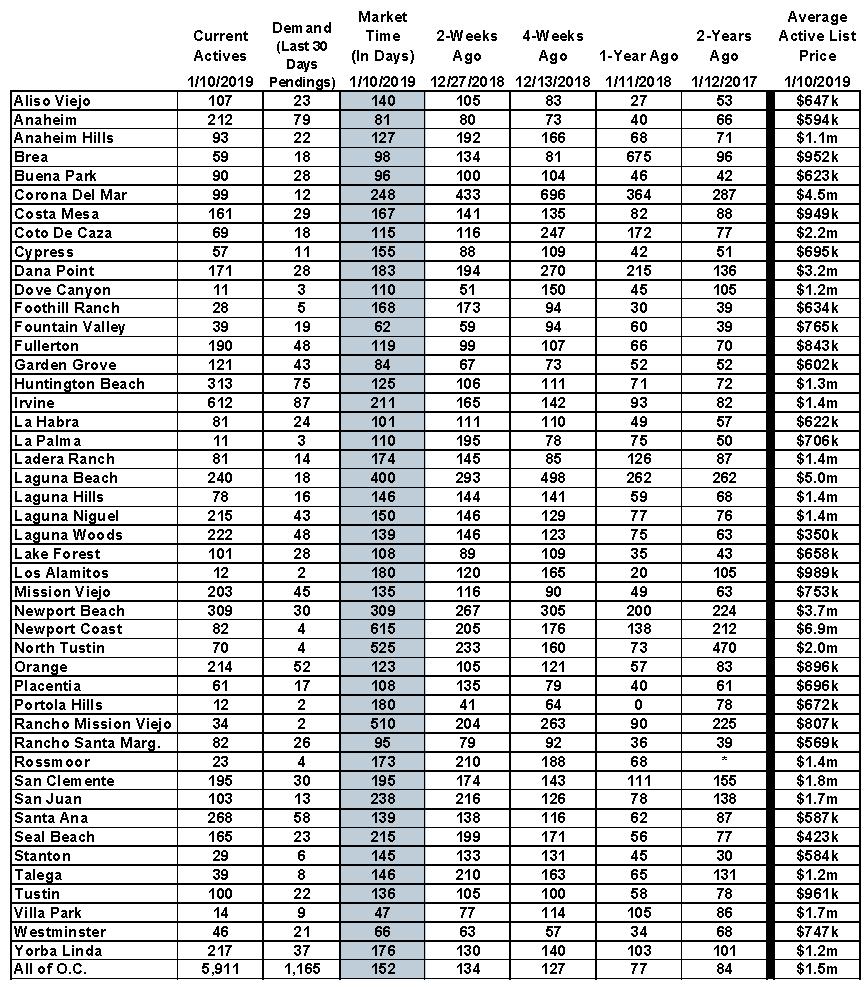
1 Orange County Housing Report: A Different Start January 14, 2019 Good morning! The start to 2019 is unlike the last 6-years, paving the way for a much different year. The 2019 Start: There are a lot more homes, demand is down, and the Expected Market Time is at its highest level since January The holiday decorations have been taken down, placed in their appropriate boxes, and carefully tucked away in the attic. Everybody is slowly coming out of the fog after enjoying the festive season full of so many distractions. It is already two weeks into the New Year. This is when the housing market awakens and starts to thaw. Yet, something is different this year. Orange County housing is starting off on a completely different foot and it is all due to the shift in the market in The shift was a move away from the theme of not enough homes on the market to not enough demand. For years, the story was that housing was suffering from a supply problem, but that morphed into a demand problem last year. It is good old fashioned supply and demand from Econ 101. These shifts caused the market to change. Since 2012, housing has had very little supply and plenty of demand, which favors sellers. But, in 2018, as the supply increased, and demand dropped, the market shifted from a Seller s Market to a Balanced Market to a slight Buyer s Market. That is precisely where housing is starting 2019, a slight Buyer s Market. Sellers are no longer calling the shots. A slight Buyer s Market does NOT mean that prices are falling like a rock. Lowball offers are a waste of time and indicate that a buyer is not in touch with reality. Instead, it is a market where buyers no longer have to trip over each other to purchase. They can take their time and call more of the shots in the purchase contract. They are in control. There were 64% more homes on the market to start 2019 compared to last year and it was the highest inventory start since Do not expect a repeat of 2012, though. That year the inventory dropped from week to week until the end of the year and never did rise, not even in the spring. Demand also grew substantially as housing shook crawled out of the Great Recession. On January 1, 2019, there were 5,565 homes on the market, a lot more choices for buyers. Demand, the last 30-days of pending activity, started the year with 1,190 pendings sales, 21% fewer than last year. That was the lowest level to start a year since 2008 when demand was only at 944. With a lot more homes on the market, coupled with muted demand, the Expected Market Time (the amount of time it would take to place a home on the market and open up escrow down the road) was at 140 days on January 1, the highest reading since The start to 2011 had a very similar feel. The housing run in Orange County is over. There is a completely different flavor to the market. For years sellers have been in control. For the past few years the Expected Market Time started the year below 90-days, a Seller s Market; AND,

2 that was in January. This year housing started the year at 142 days and increased to 152 by January 10 th. It is a Buyer s market at the start of the year for the first time in nine years. The Orange County housing market will thaw and improve from here, moving towards a Balanced Market. The best time of the year is around the corner, from February, right after the Super Bowl, through April. There will be no Hot Seller s Market this year. It will be balanced at best. In May,the Expected Market Time rises and the market slowly cools. Words of caution for sellers: if you are holding out for the Spring Market in anticipation of a quick sale and a price higher than the last comparable sale, that simply will not happen. Instead, sellers will be looking at a much more sluggish market with muted demand and buyers taking their time to purchase. Properly pricing is absolutely crucial in order to find success. Stretch the price and a seller will sit on the market. One out of every four homes will expire in Words of caution for buyers: home values are not dropping much at all right now, so lowball offers is just a waste of everybody s time including your own. The market is going to improve a bit over the coming weeks and move more towards a Balanced Market during the spring. After isolating a home they like, buyers need to offer the Fair Market Value for a home. A home in great condition that is priced right will not last long even in a slight Buyer s Market. The old saying you snooze, you lose applies. Active Inventory: In the past couple of weeks, the active inventory increased slightly. In the past couple of weeks, the active inventory increased by 82 homes, a 1% rise, and now totals 5,911. It s the first increase since mid-october. From January 1 st to today, the active listing inventory has risen from 5,565 to 5,911 homes, an increase of 346 homes, or 6%. From here, expect the inventory to continue to rise until peaking sometime over the summer. This is the time of the year where more and more homeowners opt to place their homes on the market now that the holidays are in the past. Some had taken their homes off the market to skip the slowest time of the year and are ready to give it another shot. And, others are just getting a jump start on the Spring Market, knowing that it is going to take a little more time to sell this year. Last year at this time there were 3,707 homes on the market. That means that there are 59% more homes available today. There is a lot more supply to start this year, the highest since January 2012.

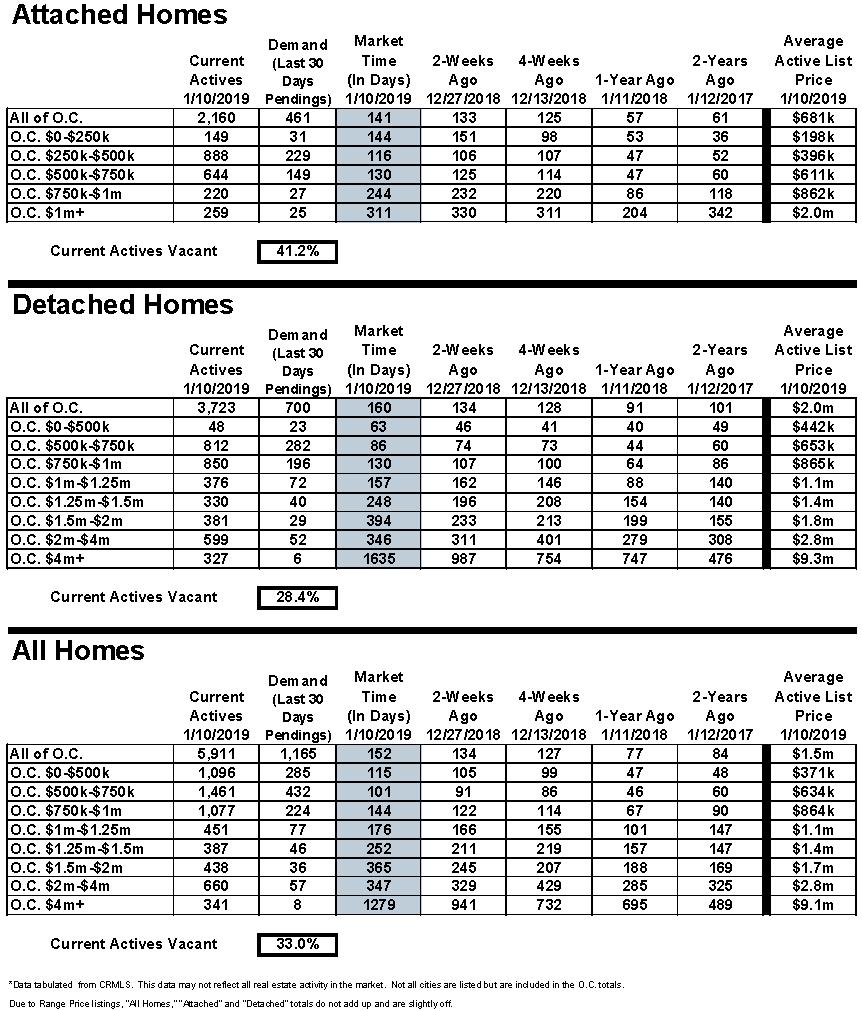
3 Demand: In the past couple of weeks, demand dropped quite a bit, as it always does to start a year. Demand, the number of new pending sales over the prior month, decreased from 1,303 to 1,165, a drop of 138, or 11%. It is the lowest demand ready since the start to January Expect demand to increase from here and peak sometime in May. It will continue to be muted compared to recent years and the demand reading will be comparable to 2007 levels throughout Last year at this time, there were 282 additional pending sales, 24% more. The current Expected Market Time rose from 134 days to 152 days in the past two weeks. But, that will reverse course as the market wakens from its holiday slumber and moves towards the Spring Market. Last year, the Expected Market Time was at 77 days. Luxury End: The luxury housing market continued to slow considerably. In the past two-weeks, demand for homes above $1.25 million decreased by 29 pending sales, a 16% drop, and now totals 147. It dropped to levels not seen in quite some time. The luxury home inventory increased by 30 homes and now totals 1,826, a 2% increase. The overall expected market time for homes priced above $1.25 million increased from 306 to 373 days over the past two-weeks. Year over year, luxury demand is down by 23 pending sales, or 14%, and the active luxury listing inventory is up by an additional 450 homes, or 33%. The expected market time last year was at 243 days, significantly better than today. For homes priced between $1.25 million and $1.5 million, in the past two-weeks, the expected market time increased from 211 to 252 days. For homes priced between $1.5 million and $2 million, the expected market time increased from 245 to 365 days. For homes priced between $2 million and $4 million, the expected market time increased from 329 to 347 days. For homes priced above $4 million, the expected market time increased from 941 to 1,279 days. At 1,279 days, a seller would be looking at placing their home into escrow around the middle of July 2022.

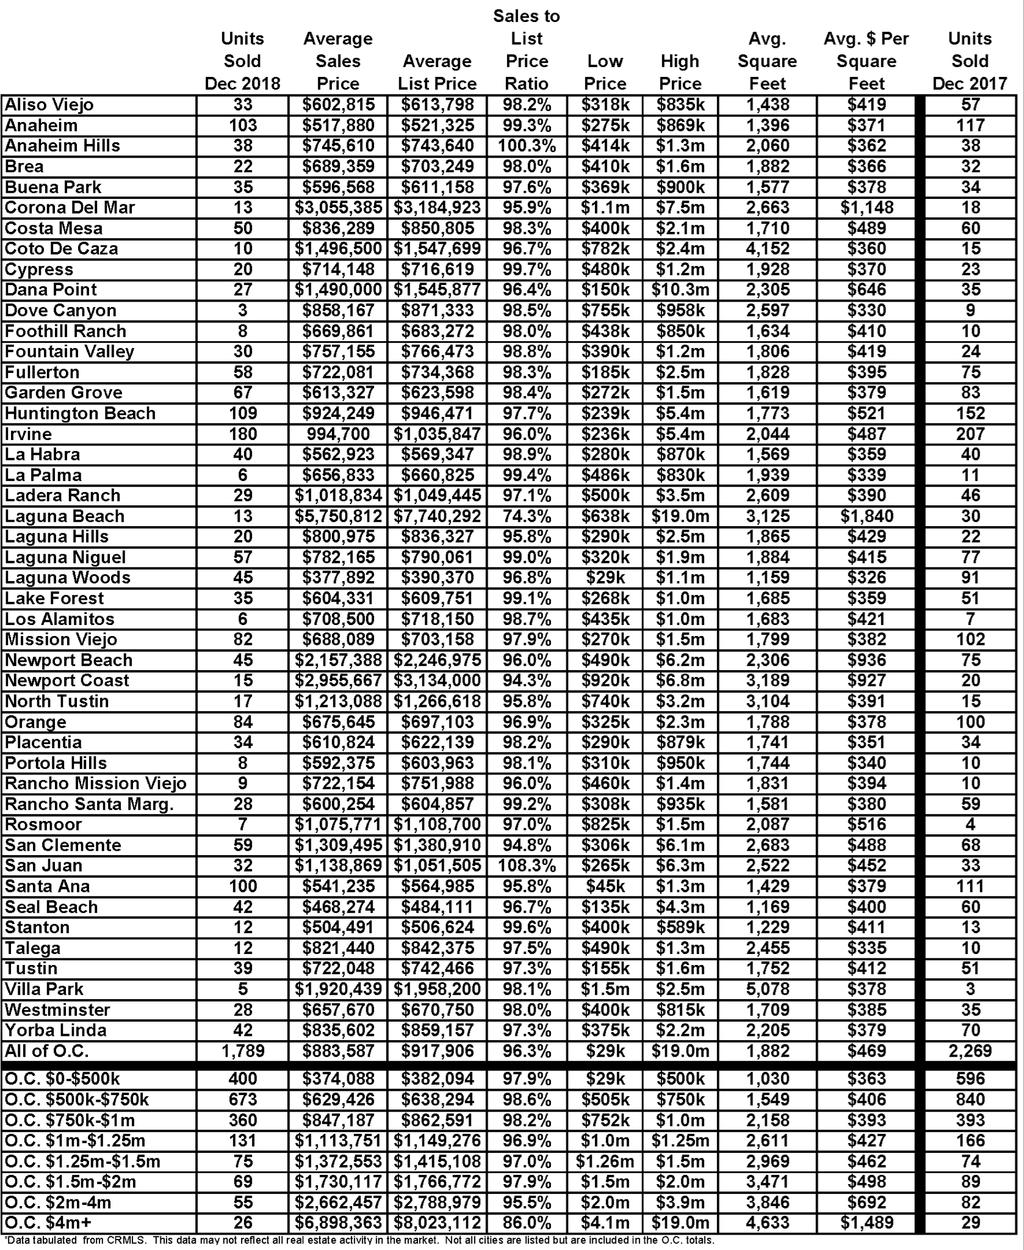
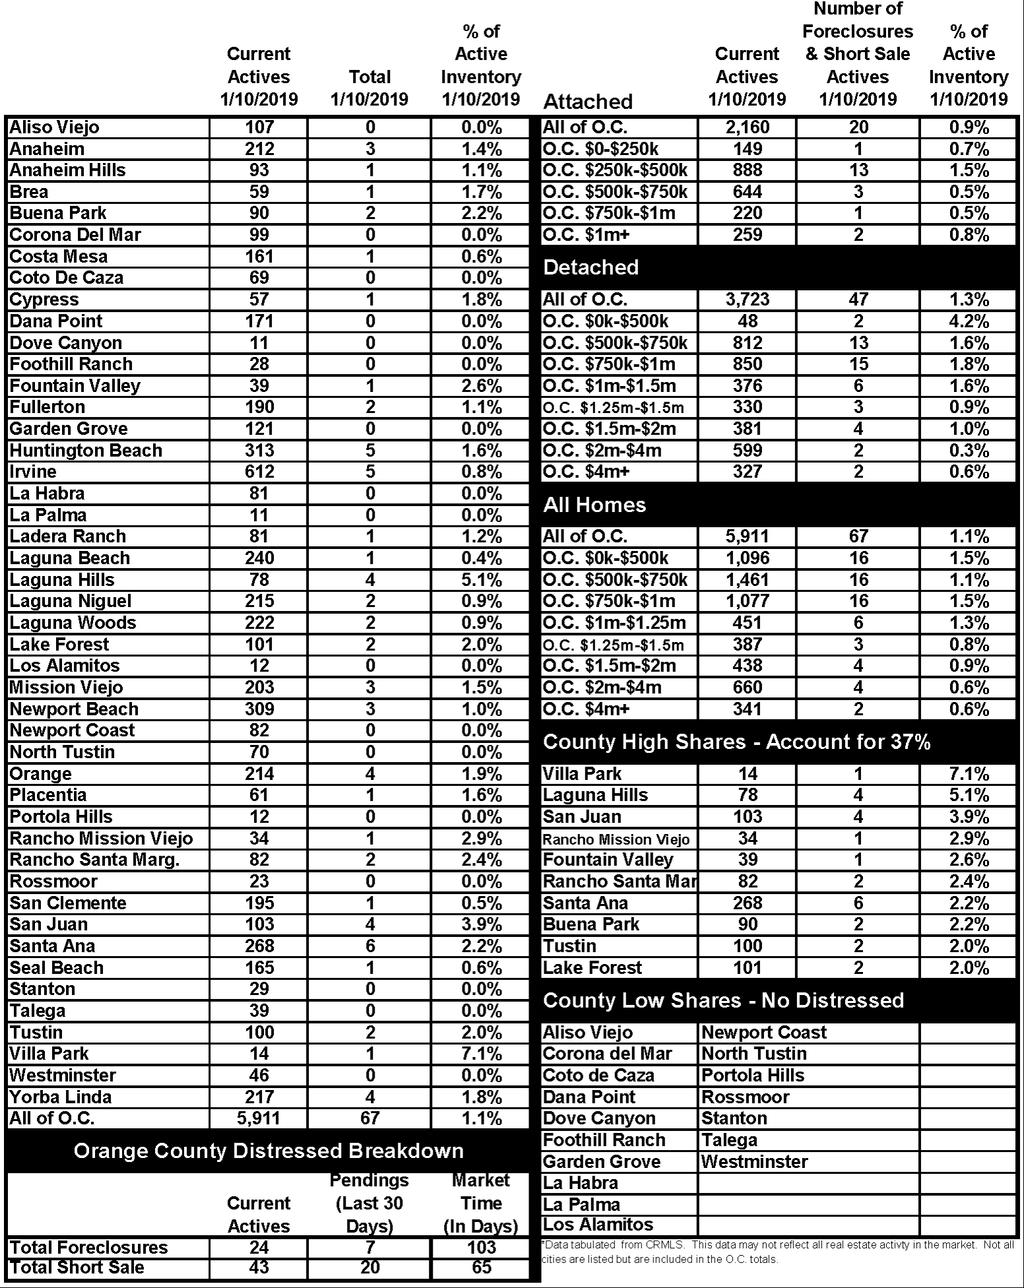
4 Orange County Housing Market Summary: The active listing inventory increased by 82 homes in the past two weeks and by 346 homes since January 1. It now totals 6,911. Last year, there were 3,707 homes on the market, 2,204 fewer than today. There are 59% more homes than last year. In 2018, 11% fewer homes came on the market below $500,000 compared to 2017, and there were 26% fewer closed sales. Fewer and fewer homes and condominiums are now priced below $500,000. This price range is slowly vanishing. Demand, the number of pending sales over the prior month, decreased in the past two-weeks by 138 pending sales and now totals 1,165, its lowest level since Last year, there were 1,447 pending sales, 24% more than today. The Expected Market Time for all of Orange County increased from 134 days two weeks ago to 152 days today, a Buyer s Market and the highest level since January It was at 77 days last year. For homes priced below $750,000, the market is a Balanced Market (between 90 and 120 days) with an expected market time of 107 days. This range represents 43% of the active inventory and 61% of demand. For homes priced between $750,000 and $1 million, the expected market time is 144 days, a slight Buyer s Market. This range represents 18% of the active inventory and 19% of demand. For homes priced between $1 million to $1.25 million, the expected market time is 176 days, a Buyer s Market. For luxury homes priced between $1.25 million and $1.5 million, in the past two weeks, the expected market time increased from 211 to 252 days. For homes priced between $1.5 million and $2 million, the expected market time increased from 245 to 365 days. For luxury homes priced between $2 million and $4 million, the expected market time increased from 329 to 347 days. For luxury homes priced above $4 million, the expected market time increased from 941 to 1,279 days. The luxury end, all homes above $1.25 million, accounts for 31% of the inventory and only 13% of demand. Distressed homes, both short sales and foreclosures combined, made up only 1.1% of all listings and 2.3% of demand. There are only 24 foreclosures and 43 short sales available to purchase today in all of Orange County, 67 total distressed homes on the active market, up two from two-weeks ago. Last year there were 50 total distressed homes on the market, slightly less than today. There were 1,789 closed residential resales in December, 21% fewer than December 2017 s 2,269. December marked a 12% drop over November The sales to list price ratio was 96.3% for all of Orange County. Foreclosures accounted for just 0.4% of all closed sales, and short sales accounted for 0.7%. That means that 98.9% of all sales were good ol fashioned sellers with equity. Have a great week. Cheers, Fred
5 !
6 !
7 !
8 !
9 !