Orange County Housing Report: The Holiday Chill. December 2, Good morning!
|
|
|
- Gilbert Joseph
- 5 years ago
- Views:
Transcription


1 Orange County Housing Report: The Holiday Chill December 2, 2018 Good morning! Now that the Holiday Market is here, housing shifts to its slowest time of the year. Holiday Market: The slowest time of the year, the Holiday Market, runs from Thanksgiving through the first couple of weeks of the New Year. This is the time of the year where the country gets pummeled by blizzards, freezing temperatures, and undrivable roads. School days are cancelled to the delight of so many children. It is no wonder that the housing market cools to its slowest season of the year; who wants to look for a home when the weather is not cooperating. And, there are not as many sellers willing to allow buyers to trapes through their homes, dragging the snow with them. It is easy to understand precisely why housing slows for the rest of the country, but why does it occur here in sunny Southern California? Yes, it is a bit cooler than the rest of the year, but the temperature bounces around in the 60 s. There is no snow, just a little bit of rain. Regardless of the weather, housing begins to slow during the Autumn Market, after the kids go back to school. It slows further when the distractions of the holidays set in. The holidays are here and with it come weekly parties, plenty of shopping, family gatherings, eggnog, spirits, and nonstop festive music. It just is not the time to hunker down and tiresomely search for a home. It is also not a time when a wave of homeowners place their homes on the market. Most everybody is laser focused on enjoying the holidays and all of the hubbub. Since Thanksgiving, 150 sellers placed their homes on Hold Do Not Show so that they could enjoy the season. The Holiday/Winter Market is the time of the year when typically, both supply, the active inventory, and demand, new pending sales over the prior month, drops like a rock until after we ring in a New Year.

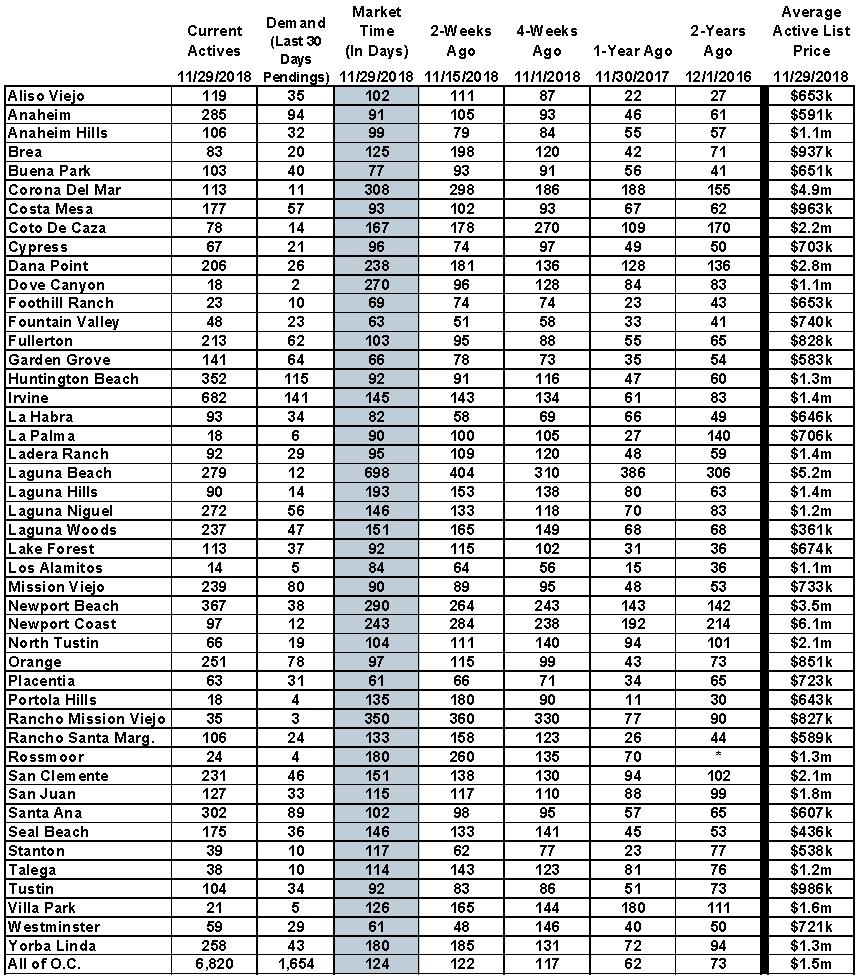
2 After peaking two months later than normal, and then hovering around that peak for an additional month, the active listing inventory is finally dropping. It declined by 6% in the past two weeks, shedding 398 homes, and now totals 6,820, the highest level for this time of the year since Normally, the active inventory peaks sometime between July and August and then falls for the remainder of the year. With the delayed peak, there is not as much time for the inventory to drop, so the start to 2019 is going to be the highest since The current active inventory is 58% higher than last year s 4,323 mark. There are 2,497 more homes on the market, a lot more competition for sellers. Expect the active listing inventory to continue to drop until New Year s Day, but it will remain elevated at levels not seen in years. Demand, the number of new pending sales over the prior month, has been dropping since August, the end of the Summer Market. In the past couple of weeks, it accelerated and dropped the most this year, 122 homes, or 7%, and now is at 1,654 pending sales. It s the lowest level for a start to December since Last year, demand was 26% higher with an additional 428 pending sales. The Expected Market Time, the amount of time it would take to place a home listed today into escrow down the road, had been climbing at a very rapid rate since August. The quick pace was due to the active listing inventory peaking late and remaining elevated while demand dropped. Today, with both supply and demand dropping, the Expected Market Time only increased slightly from 122 to 124 days, a Slight Buyer s Market (over 120 days). It was at 62 days last year. For housing, the holiday chill is here. That means that fewer homeowners will place their homes on the market and many current sellers will opt to throw in the towel and wait until next year. For buyers and seller who remain, it is best to properly set their expectations. Seller Expectations: the market is lining up in favor of buyers for the first time since the start to 2011 and it is taking a lot longer to sell. Price is king. Upgraded homes in great condition without deferred maintenance and priced accurately will sell quicker than everybody else. Pricing based upon location, condition, and upgrades is absolutely

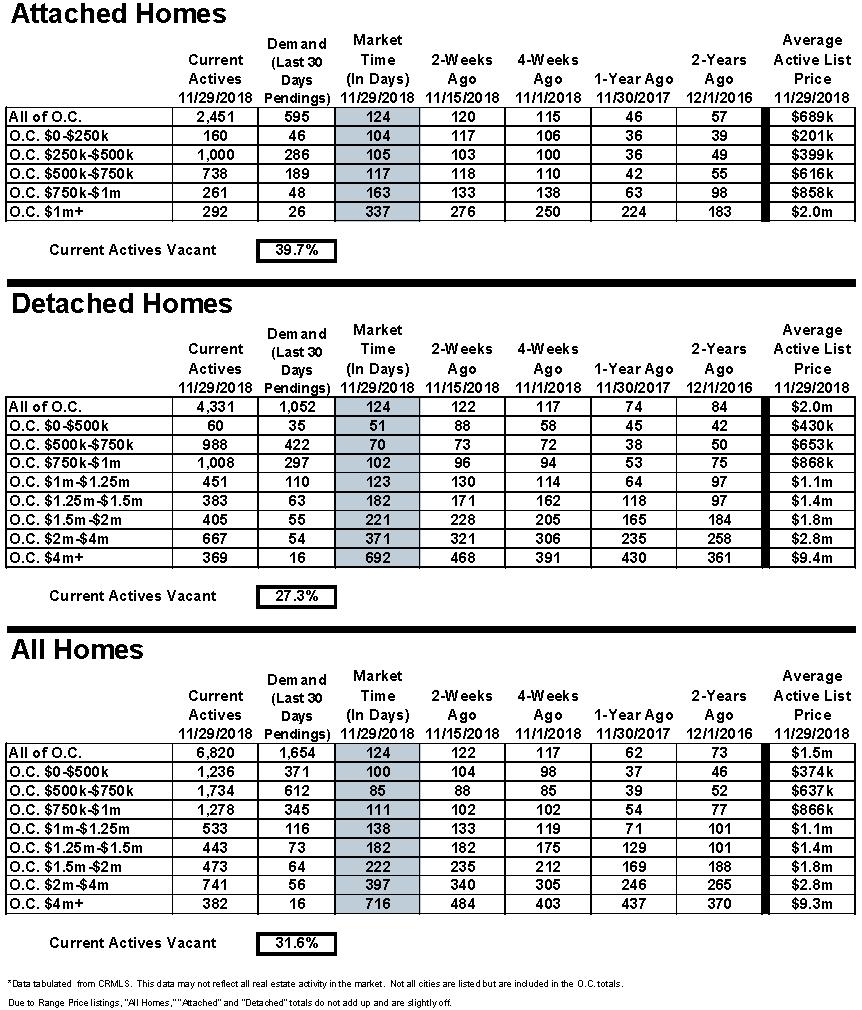
3 fundamental. Homes that need a bit of work or have an inferior location need to adjust their price. After arriving at a realistic Fair Market Value, sellers are required to pack their patience. This market is far from instant. Buyer Expectations: buyers may be in the driver s seat, but a slight Buyer s Market does not mean that prices are dropping right now. Buyers cannot get ahead of themselves. They have the upper hand and can call more of the shots, but this is not a market for writing unrealistic, lowball offers in hopes that some desperate seller is going to bite. This is NOT a deep buyer s market. That occurs when the Expected Market Time surpasses the 150-day mark. The current market is not even close to that level. There are finally more homes to see. Homes are no longer flying off the shelves in days after generating over a dozen offers. Buyers no longer have to rush. There will be fewer homes coming on the market until after ringing in Active Inventory: In the past couple of weeks, the active inventory experienced its largest drop of the year. In the past couple of weeks, the active inventory dropped by 398 homes, a 6% drop, and now totals 6,820, its lowest level since the end of July. The Holiday Market is here and the giant drop is due to fewer sellers coming on the market combined with unsuccessful sellers throwing in the towel after being exposed to the market for months. The sharp drop will continue until New Year s Day. From there, expect the inventory to increase. Last year at this time there were 4,323 homes on the market. That means that there are 58% more homes available today. Demand: In the past couple of weeks, demand experienced its largest drop of the year. Demand, the number of new pending sales over the prior month, decreased from 1,776 to 1,654, a drop of 122, or 7%. That s the biggest drop so far this year and its lowest level since the start of January. We can expect demand to continue to steadily drop through mid-january. Last year at this time, there were 428 additional pending sales, 26% more. Luxury End: The luxury housing market continued to slow considerably. In the past two-weeks, demand for homes above $1.25 million decreased by 25 pending sales, an 11% drop, and now totals 209. It dropped to levels not seen since the beginning of January. The luxury home inventory decreased by 89 homes and now totals 2,039, a 4% drop. The overall expected market time for homes priced above $1.25 million increased from 273 to 293 days over the past two-weeks. Year over year, luxury demand is down by 27 pending sales, or 11%, and the active luxury listing inventory is up by an additional 454 homes, or 29%. The expected market time last year was at 201 days, significantly better than today. For homes priced between $1.25 million and $1.5 million, in the past two-weeks, the expected market time remained unchanged at 182 days. For homes priced between $1.5 million and $2 million, the expected market time decreased from 235 to 222 days. For homes priced between $2 million and $4 million, the expected market time increased from 340 to
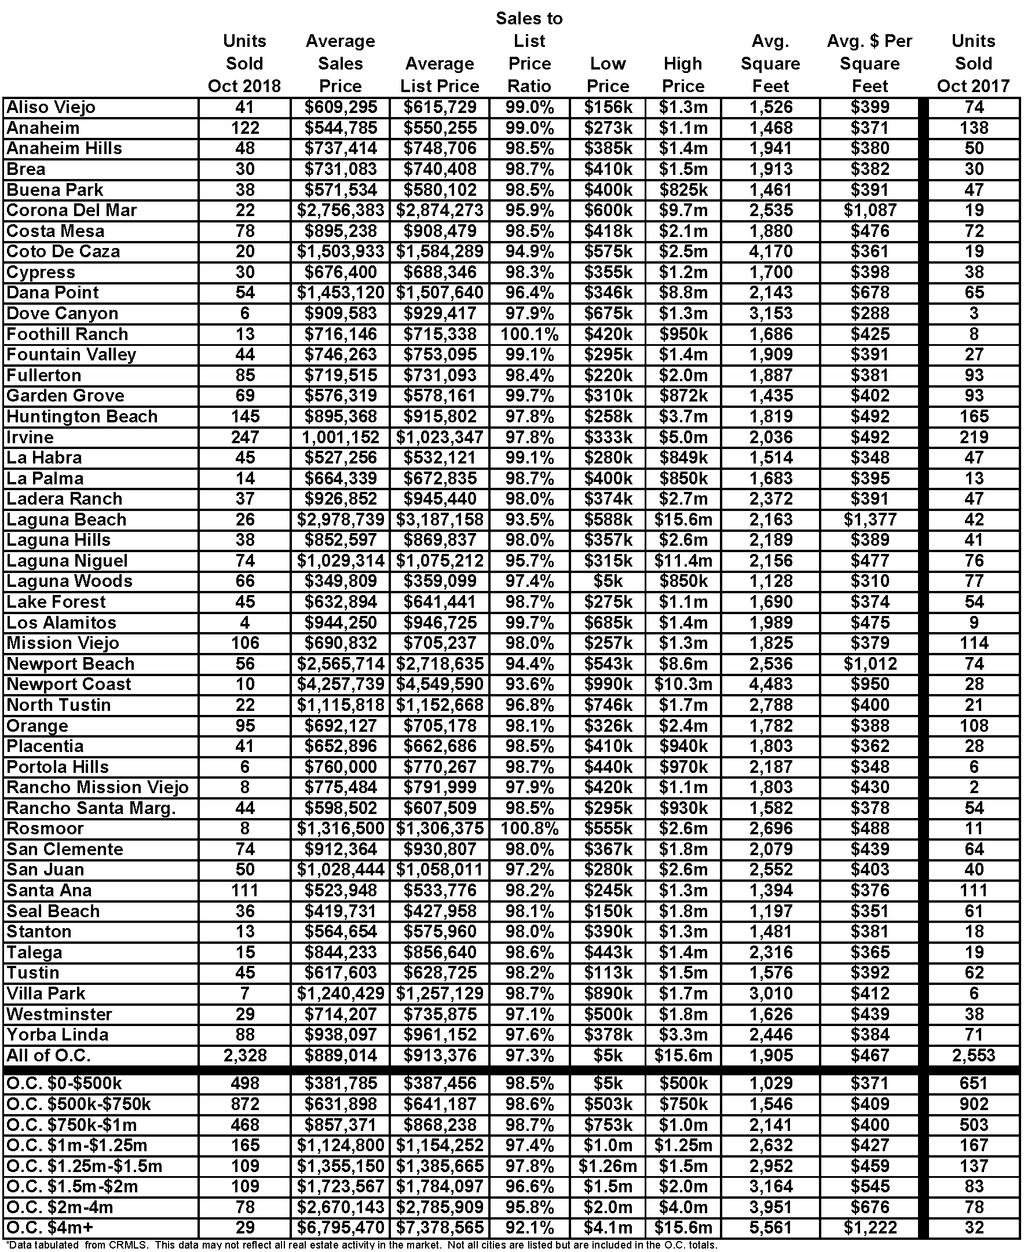
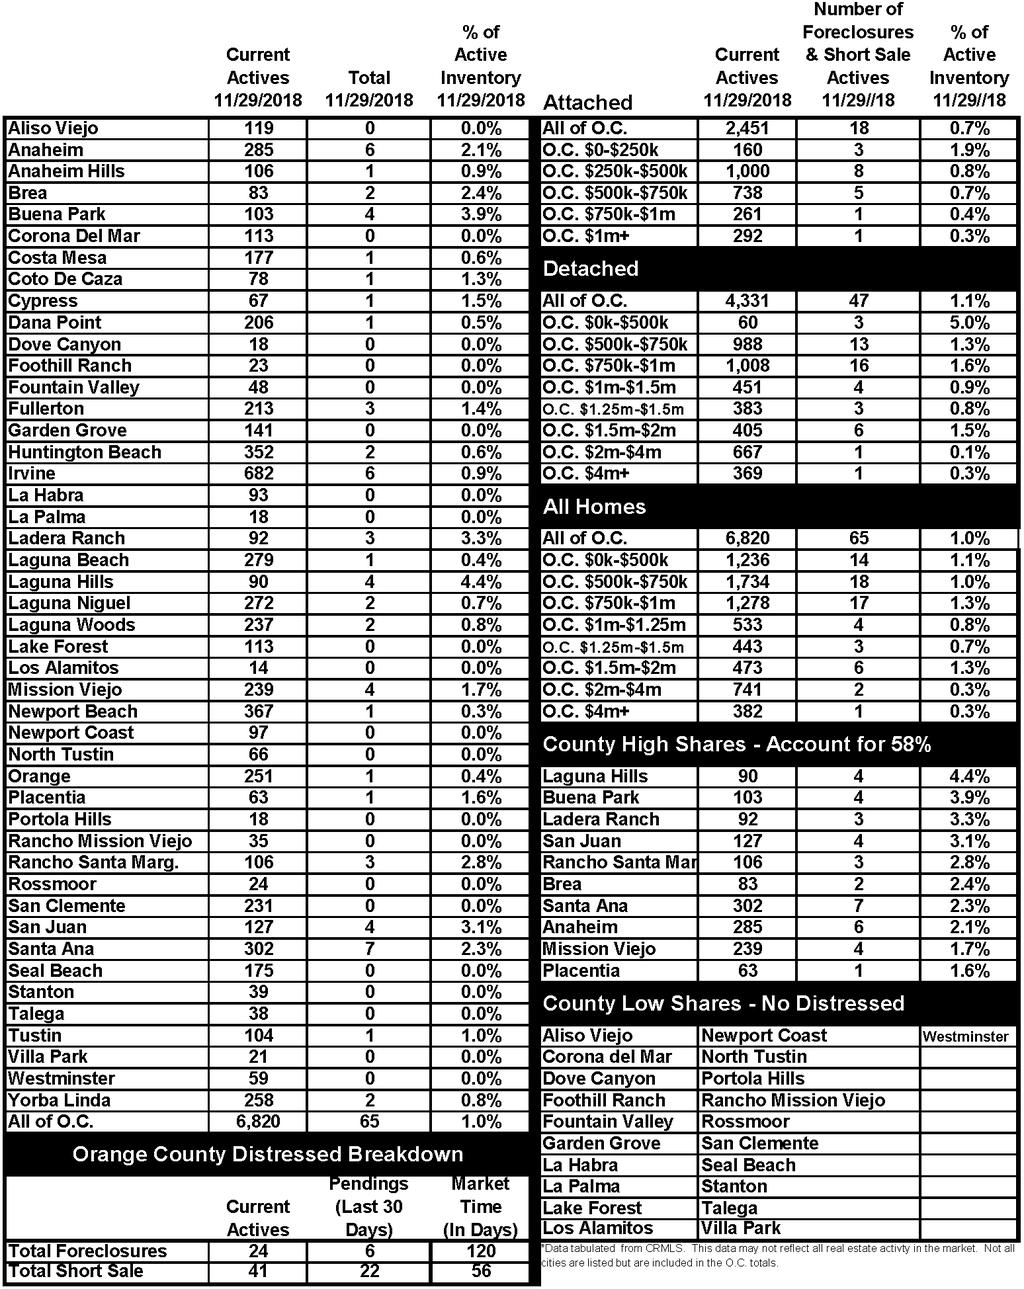
4 397 days. For homes priced above $4 million, the expected market time increased from 484 to 716 days. At 716 days, a seller would be looking at placing their home into escrow around the middle of November Orange County Housing Market Summary: The active listing inventory decreased by 398 homes in the past two weeks, its largest drop of the year, and now totals 6,820. Last year, there were 4,323 homes on the market, 2,497 fewer than today. So far this year, 13% fewer homes have come on the market below $500,000 compared to last year, and there have been 26% fewer closed sales. Fewer and fewer homes and condominiums are now priced below $500,000. This price range is slowly vanishing. Demand, the number of pending sales over the prior month, decreased in the past two-weeks by 122 pending sales, its largest drop of the year, and now totals 1,654. Last year, there were 2,082 pending sales, 26% more than today. The Expected Market Time for all of Orange County increased from 122 days to weeks ago to 124 days today, a slight Buyer s Market (120 to 150 days) and the highest level since January It was at 62 days last year. For homes priced below $750,000, the market is a Balanced Market (between 90 and 120 days) with an expected market time of 91 days. This range represents 43% of the active inventory and 59% of demand. For homes priced between $750,000 and $1 million, the expected market time is 111 days, a Balanced Market. This range represents 19% of the active inventory and 21% of demand. For homes priced between $1 million to $1.25 million, the expected market time is 138 days, a slight Buyer s Market. For luxury homes priced between $1.25 million and $1.5 million, in the past two weeks, the expected market time remained unchanged at 182 days. For homes priced between $1.5 million and $2 million, the expected market time decreased from 235 to 222 days. For luxury homes priced between $2 million and $4 million, the expected market time increased from 340 to 397 days. For luxury homes priced above $4 million, the expected market time increased from 484 to 716 days. The luxury end, all homes above $1.25 million, accounts for 30% of the inventory and only 13% of demand. Distressed homes, both short sales and foreclosures combined, made up only 1.0% of all listings and 1.7% of demand. There are only 24 foreclosures and 41 short sales available to purchase today in all of Orange County, 65 total distressed homes on the active market, down 13 from two-weeks ago. Last year there were 64 total distressed homes on the market, slightly less than today. There were 2,328 closed residential resales in October, 9% fewer than October 2017 s 2,553. October marked an 11% increase over September The sales to list price ratio was 96.9% for all of Orange County. Foreclosures accounted for just 0.4% of all closed sales, and short sales accounted for 0.6%. That means that 99% of all sales were good ol fashioned sellers with equity. Have a great week. Sincerely, Steven Thomas Quantitative Economics and Decision Sciences Copyright Steven Thomas, Reports On Housing - All Rights Reserved. This report may not be reproduced in whole or part without express written permission by author.
5
6
7
8
9