Tangerine Plaza Market Analysis
|
|
|
- Veronica Malone
- 5 years ago
- Views:
Transcription

1 Tangerine Plaza Market Analysis City of St. Petersburg November 30, 2017 Community Solutions 618 E. South Street Suite 700 Orlando, FL 32801
2 Summary, Conclusions, and Findings This study is intended to provide a market scan of potential retail uses (with a focus on grocery) for the 40,000 sf space available at Tangerine Plaza in St. Petersburg (the former neighborhood Walmart Grocery site). The objective is to ascertain area neighborhood spending capacity related to the current patterns of retail spending and existing retail offerings. With this understanding one can begin to identify potential unmet community needs, which could be supported in full or in part by retail offerings that could be located in the available space at Tangerine Plaza. Today, the households within the study / trade area around Tangerine Plaza can support about 30,000 sf of grocery / household retail services. The demand for this need is currently being met by a variety of small and miscellaneous grocery, convenience, and food market outlets within the neighborhoods, in conjunction with the impact of the nearby Wal-Mart Supercenters which offer comprehensive grocery and retail products. This situation is not ideal for the community because local / independent grocery and convenience stores typically operate at a price premiums for household staple items, while quality and consistency of products are sometimes below market standards because of offbrand offerings. Additionally, these types of stores struggle to offer fresh foods (meats, breads and produce) that enhance healthy diet and home cooked meals for the neighborhoods. However, these stores are generally walkable / bikeable within a small neighborhood trade area and they do meet a significant portion of the retail spending capacity. To the extent the neighborhood desires (and can support) traditional grocery offerings, the presence of (2) Wal- Mart Supercenters just outside the study area covers comprehensive services at competitive pricing. Access to the Wal-Mart is not quite as convenient, but is achievable via public bus transit or a short drive for car owners. Taken together, this analysis therefore identifies the presence of a possible gap between the very small neighborhood convenience store, and the large, proximate Wal-Mart Supercenter models which together, meet the market spending capacity, if not the preferred level of neighborhood service. The opportunity to fill this gap is considered very narrow. An 18,000 20,000 sf retail grocer could be nestled within the community at Tangerine Plaza, providing a bit of the retail standardization of the regional Wal-Mart while enjoying the walkable access of the neighborhood convenience. There are models designed to fill this gap that provide comprehensive neighborhood scale grocery at discount pricing. If the City desires to create a more beneficial environment for residents of this area by attracting a smaller grocery format, a financial incentive is most likely going to be required as an economic development strategy. The suggested 20,000 sf grocery model would gain its market share from both the Wal-Mart and the local retail stores, but would also remain in the same competitive environment within an area of limited spending capacity. An incentive for success could represent an offset to operating costs (i.e. rent subsidy or lease based on a percentage of sales) that lowers overall selling, general, and administrative costs and improves profitability to a sustainable level. 1
3 Finally, to complement a smaller grocery format and increase overall occupancy at the Site, the City should pursue a number of discount retailers or other non-retail tenants identified in this report. An example of a non-retail tenant that could provide significant value to the community includes a model for a consolidated health care center. The following are summary of more detailed findings from this analysis: Total annual food, retail, and entertainment spending of households in the defined trade area is estimated at $47 million. Based on that level of spending, households in the defined trade area are estimated to support approximately 30,000 square feet of grocery (food at home) products and services. Approximately 33,000 square feet of a variety of small and miscellaneous grocery, convenience, and food market outlets currently exist within the trade area, meeting some level of household demand. The current supply of small and miscellaneous stores would not be expected to meet the full range of products and services of a traditional grocery format, implying some level of deficiency exists within the defined trade area. Discounting existing supply of small and miscellaneous stores by 50% suggests a deficiency of grocery products and services in the defined trade area of nearly 16,000 square feet. Approximately 80, ,000 of other supply of traditional grocery store formats are outside of the trade area but within 2.5 miles of the Site and are accessible to a significant portion of households. Given the level of household demand in the defined trade area along with the supply of small and miscellaneous store formats accessible to households within the trade area, the Site is currently not capable of supporting a 40,000 square foot traditional grocery store format. A smaller format grocery brand in the range of 18,000 to 20,000 square feet could be supported but is likely to require some level of operating incentive given the low economic status of households within the trade area. Across all retail categories (apparel, grocery and specialty), a strong correlation exists between net margin (profit) and selling, general and administrative costs indicating that lower operating costs are the strongest factor in determining profitability. Other viable retail brands sharing the existing space would also need to be consistent with a lower income primary target market (i.e. discount store brands) and likely require some level of operating incentive. There are a number of non-retail tenants (e.g. Healthcare related) that could complement a smaller grocery store format and provide the opportunity to increase overall occupancy at the Site. 2
4 Introduction ( GAI ) has been requested by the City of St. Petersburg ( City ) to provide a market analysis for a site located at nd Street South, St. Petersburg, Florida ( Site or Tangerine Plaza ). The main focus of the analysis was to examine the market demand for a traditional grocery store format at the Site, as well as provide a scan of other potential retail uses which for which the neighborhood is underserved relative to its inherent spending capacity. Study Area A trade area in general represents the farthest distance consumers are willing to travel to purchase retail goods or services. A local convenience trade area is based on the purchase of products and services needed on a regular basis, such as gasoline or groceries. Because these purchases are relatively frequent, individuals find it more convenient to buy these products from businesses located close to their home or workplace. A convenience trade area is predominately supported by local residents but can also be impacted by individuals working within the trade area but commuting from other communities. The size of a trade area is going to be affected by many factors including the size and retail mix of the overall market, the size and retail mix of competing locations, the transport network available to consumers, and physical and other barriers. Products and services related to groceries, gas, and eating places are generally the types of retail spending that consumers desire to have within relatively close proximity to their household. However, some types of retail formats that provide these goods and services (i.e. Big Box) can draw consumers from a longer distances than would be expected for a local convenience market. For the purpose of this site analysis, we have defined a study area of approximately 2.5 square miles to reflect a local convenience trade area. The area is bounded on the west by Martin Luther King Boulevard, on the south by 34 th Street South, and the east and north by Interstate 275 (see Figure 1). 3

5 Figure 1. Primary Market Area. The market area illustrated in Figure 1 also conforms to Census Tract boundaries 206, 207, 212, and 287. A second market area was defined for comparison purposes representing a circular 2.5 square mile area (0.9 mile radius) centered on the intersection of 49 th Street North and 9 th Avenue North, northwest of the Tangerine Plaza market area. Market Area Demand Because a convenience trade area is predominately supported by local residents, this analysis focused on the demand created by household spending. The impact of consumers commuting to and from or through the trade area is not considered material. In 2015, the defined trade area contained 4,778 households with a population of 13,992. Average household income in 2015 was $35,517 creating nearly $170 million in total annual household income. Using a model of consumer expenditures based on household income, Table 1 provides a summary of spending by retail category generated by the households within the trade area (See Appendix A). 4
6 TABLE 1: TANGERINE PLAZA MARKET AREA Area Total Household Income (average) $ 35,520 $ 169,785,600 Consumer expenditures Total $ 37,216 $ 177,891,524 Food at home 3, % 15,459,476 Food away from home 1, % 8,890,800 Alcoholic beverages % 1,242,800 Housing (incl taxes, utilities, and operations) 13, % 64,577,800 Apparel and services 1, % 6,405,200 Transportation 6, % 29,014,600 Healthcare 3, % 17,447,000 Entertainment 1, % 8,699,600 Personal care products and services % 2,294,400 Reading % 334,600 Education % 2,485,600 Tobacco products and smoking supplies % 1,577,400 Miscellaneous % 2,485,600 Cash contributions 1, % 6,070,600 Personal insurance and pensions 2, % 9,799,000 Food, retail, entertainment $ 47,389,876 At a level of total annual income of $170 million, households in the trade area are estimated to generate nearly $178 million in total annual consumer expenditures between food, housing, transportation, entertainment, and other categories. Specifically related to retail type goods and services (food at home, food away, retail, and entertainment), households are estimated to generate $47million in consumer expenditures. Annual consumer expenditures for groceries (food at home) alone are estimated in excess of $15 million. Annual retail grocery spending per square feet required to support a traditional grocery store format (typically a national brand) averages $500 with some brands and markets generating up to $700 per square feet. Using an average of $500 for a traditional grocery store format, consumer spending in the market area would be estimated to support approximately 30,000 square feet, assuming a significant capture of total household spending. Required spending per square feet to support retail varies more significantly between geographies and type of store format. Table 2 provides a range of sales values per square feet for national brand retailers. 5
7 Table 2. Retail Sales per Square Feet by Format Type of Retail Format Retail Sales Large format $ Medium format Small format Restaurant Services Miscellaneous The determination of supportable general retail square footage based on household spending is less direct because of the relatively wide range of retail formats and the mixing of retail spending between consumer expenditure categories. However, a rough estimate of general retail demand could range between 75,000 to 150,000 square feet, assuming a significant capture of total household spending. Existing Supply and Future Development Opportunities The trade area is currently served by a variety of small and miscellaneous grocery, convenience, and food market outlets and discount retailers that offer a limited assortment of grocery items (i.e. Dollar General and Dollar Tree). The various miscellaneous grocery locations are small in format and are not concentrated in typical strip centers but are integrated in neighborhoods throughout the trade area (see Appendix B). Based on a scan of the trade area, approximately 33,871 square feet of grocery and food market supply currently exists within the trade area (see Table 3). Table 3. Existing Study Area Grocery and Food Market locations Location Address Sq Ft Dollar General ** th Avenue South 2,250 Dollar Tree ** th Avenue South 2, Food Market nd Avenue South 3,000 Obama Express Food th Avenue South 5,424 South City Grocery and Meat nd Street South 1,600 Wildwood Meat th Street South 3,200 Redstone Market nd Street South 2,499 3 Brothers Market th Street South 2,680 Midtown Supermarket th Avenue South 1,400 Dave s Meat Market th Avenue South 1,740 Mair s Grocery 2230 Dr. Martin Luther King Blvd 3,995 Rajax Market 2327 Dr. Martin Luther King Blvd 3,608 TOTAL 33,871 ** Note: Estimate of space dedicated to grocery type items. 6
8 The Dollar General and Dollar Tree plus the miscellaneous formats of grocery and food markets clearly serve some need within the trade area but would not be expected to meet the full range of products and services of a traditional grocery format. There is no standard metric used to convert these small and miscellaneous convenience and market store formats into an equivalent traditional grocery store square footage. However, a discount factor of 50% could be considered in adjusting the gross square footage supply of these formats when comparing with the demand for traditional grocery store demand. Not only do these types of stores lack a full range of products and services, high prices also play a limiting role in meeting the needs of resident households. Based on our research, there is no industry standard for adjusting these types of small and miscellaneous grocery, convenience, and food market outlets to compare with traditional grocery demand. The 50% adjustment is based on our professional opinion. Therefore, discounting the existing supply of small and miscellaneous stores suggests a deficiency of grocery products and services in the defined trade area of nearly 16,000 square feet. Which is consistent with the general feeling that a traditional grocery store format is needed or would succeed. In addition to the supply of small and miscellaneous convenience food market formats within the trade area, there are several notable locations just west of the defined trade area on the west side of Interstate 275 but within 2.5 miles of the Tangerine Plaza site (see Table 4). Table 4. Other Notable Accessible Grocery locations Location Address Sq Ft Wal-Mart Supercenter th Street South 212,063 Wal-Mart Supercenter th Street North 105,065 Aldi th Street South 31,570 C&J Grocery th Avenue South 4,265 TOTAL 352,963 Note: Includes general retail square footage along with grocery Excluding the retail components of the Wal-Mart Supercenter locations, there is up to an additional 80,000 to 100,000 square feet of traditional grocery store supply that is likely drawing consumers from the defined market area. As mentioned earlier, the larger format Supercenters can draw demand for local convenience shopping from a longer distance. These locations are likely contributing to the lack of recent success of grocery brands at the Site. Therefore, the opportunity to fill this gap would be considered very narrow and likely reduces the number of potential national brands that operate within this scenario. A limited number of brands provide a discount grocery business model that could be viable for the Site. Some of the advantages of these types of business models include the following: 7
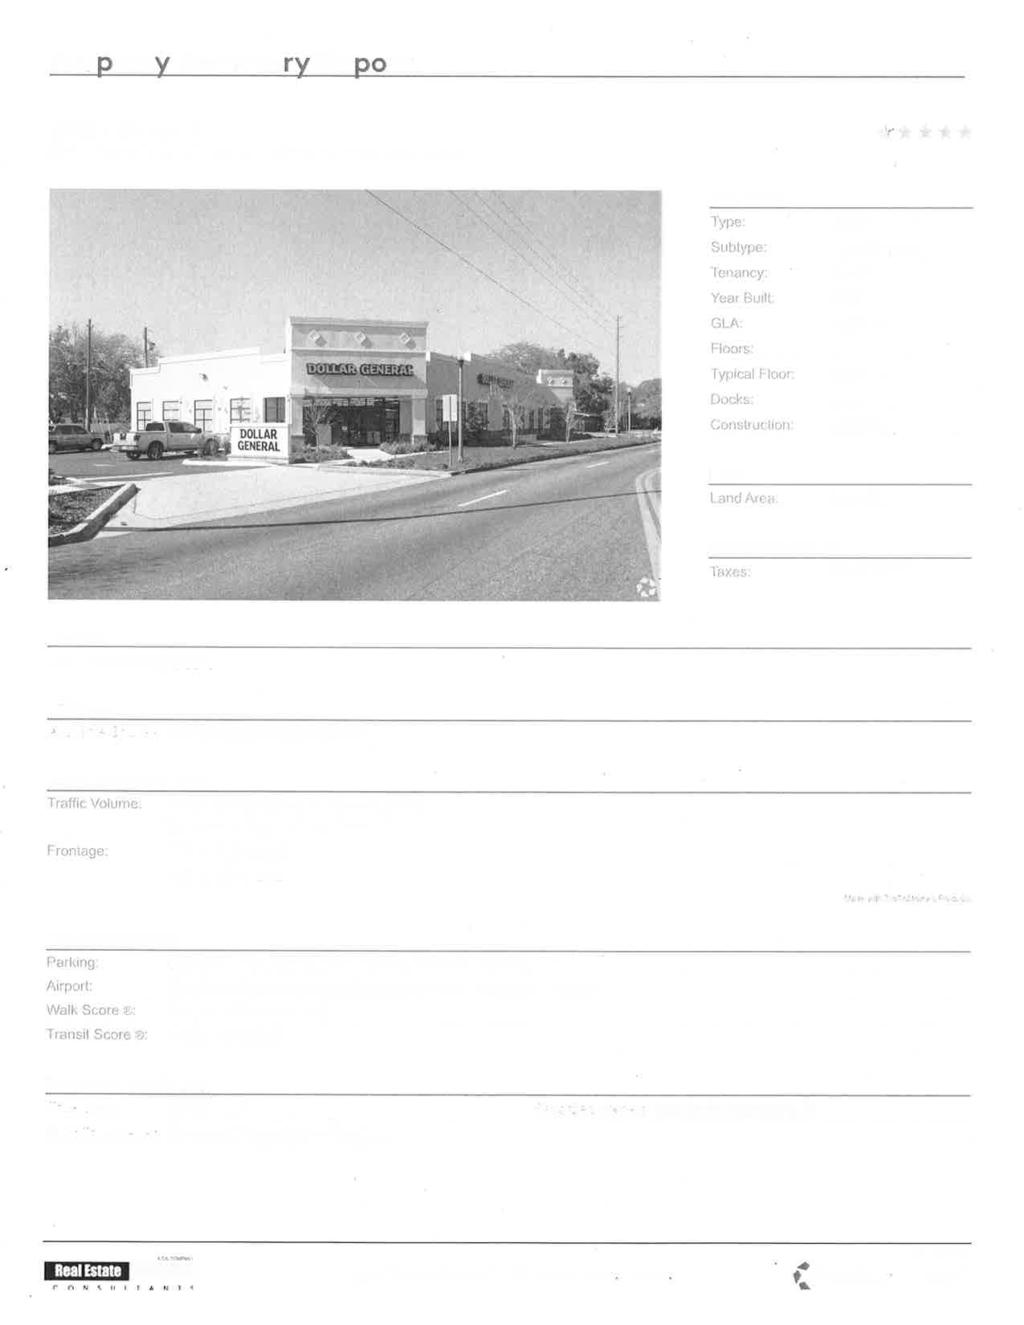
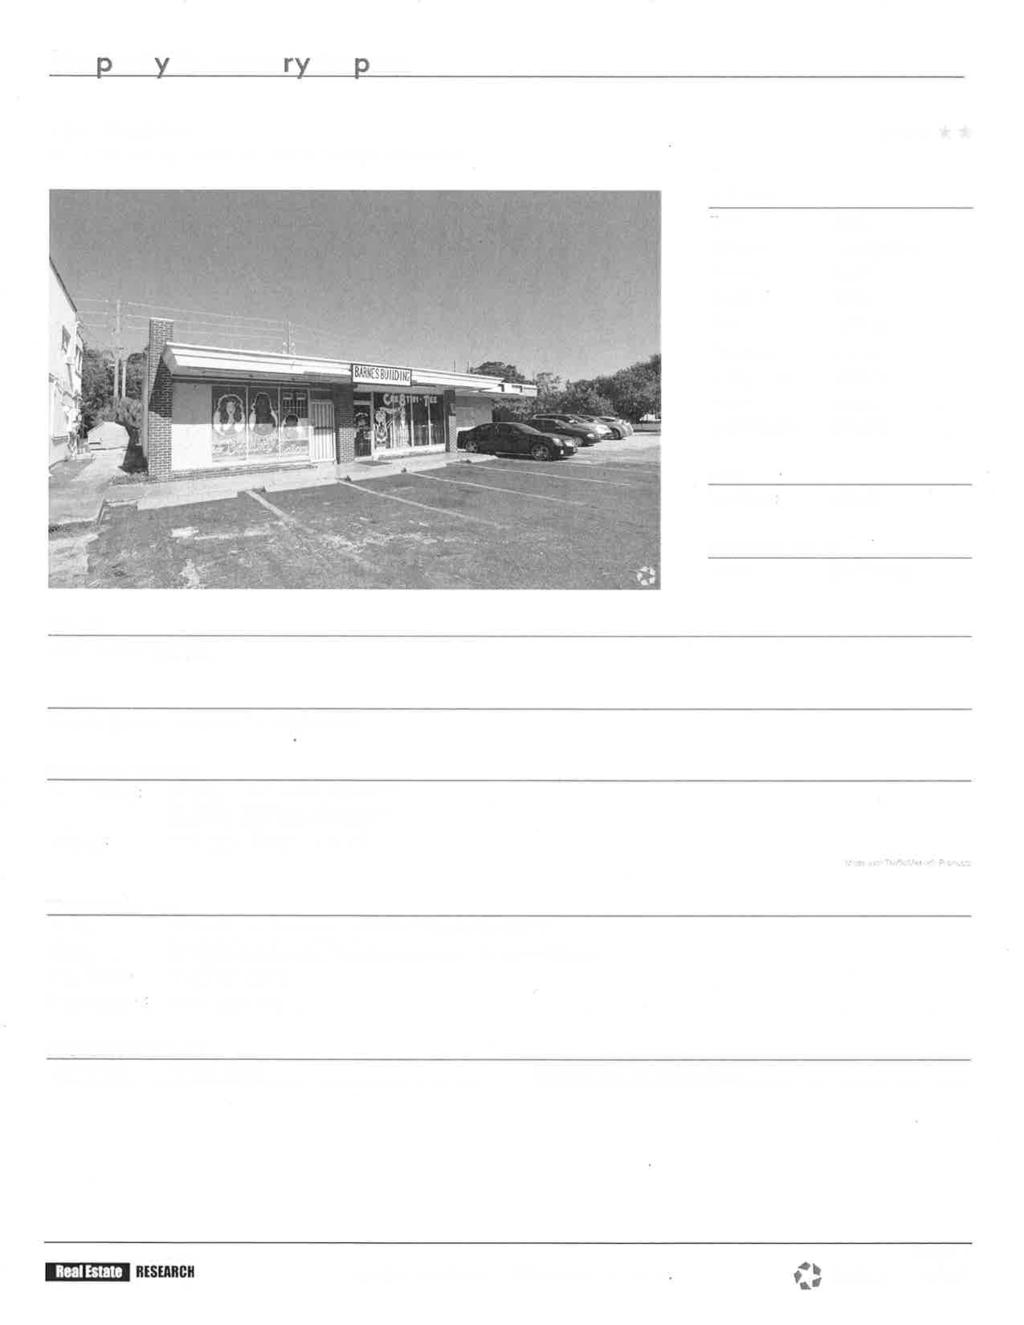
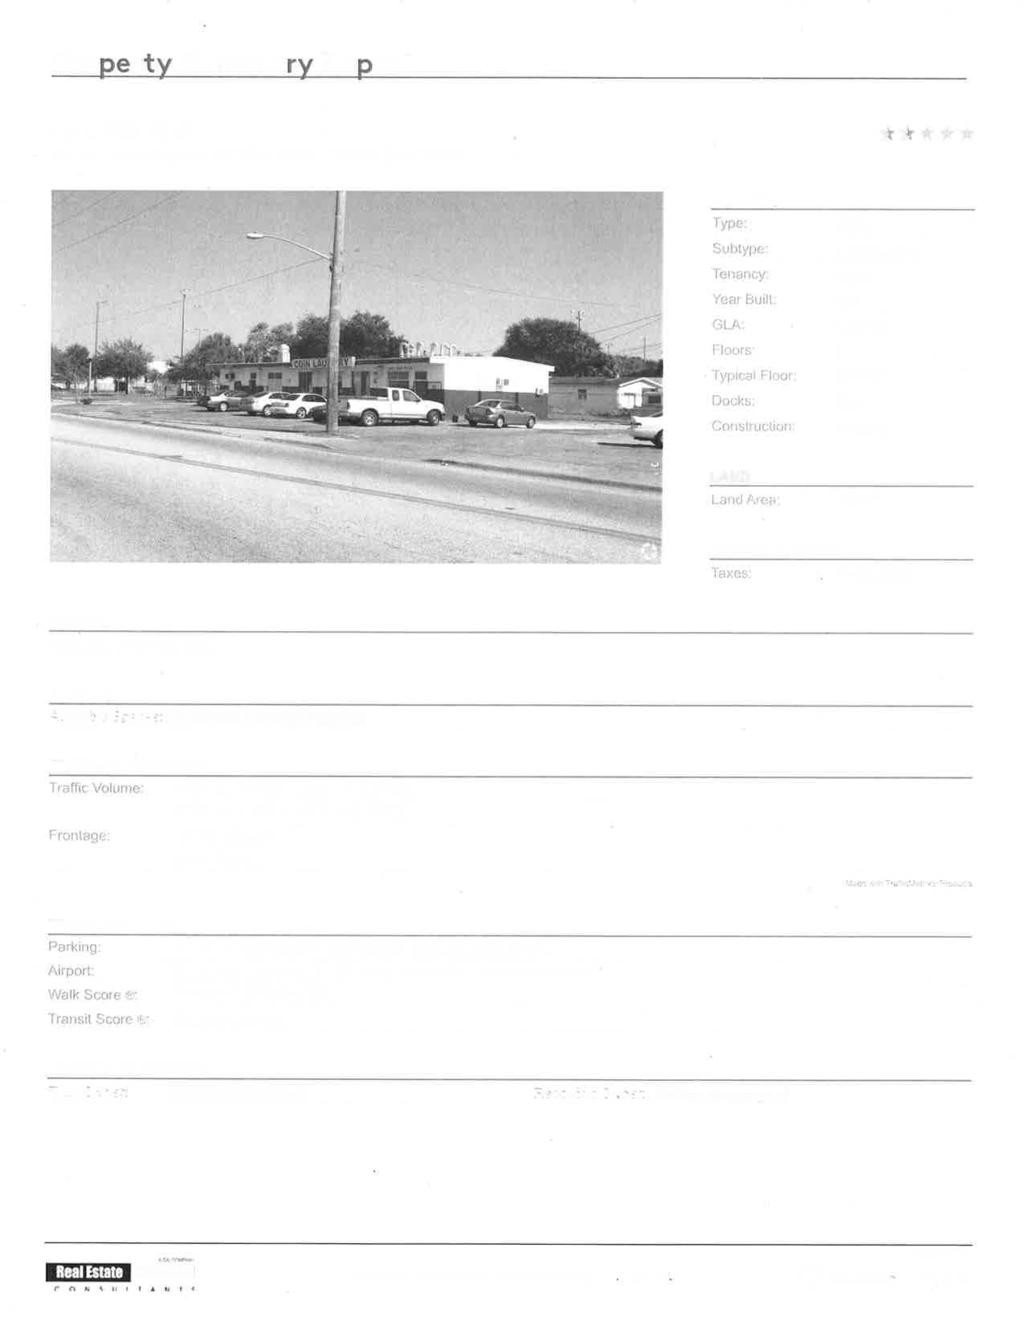
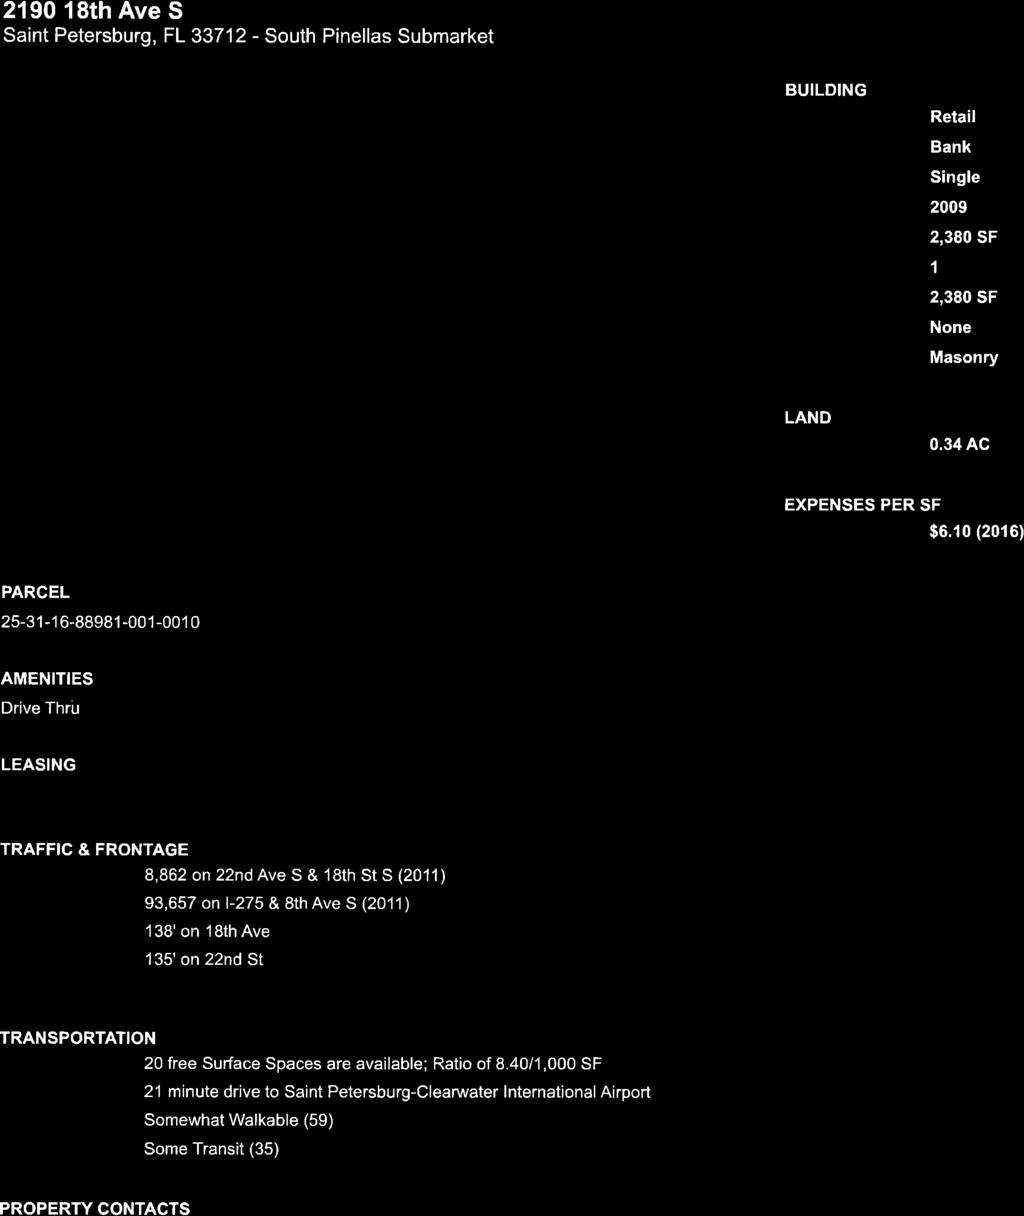
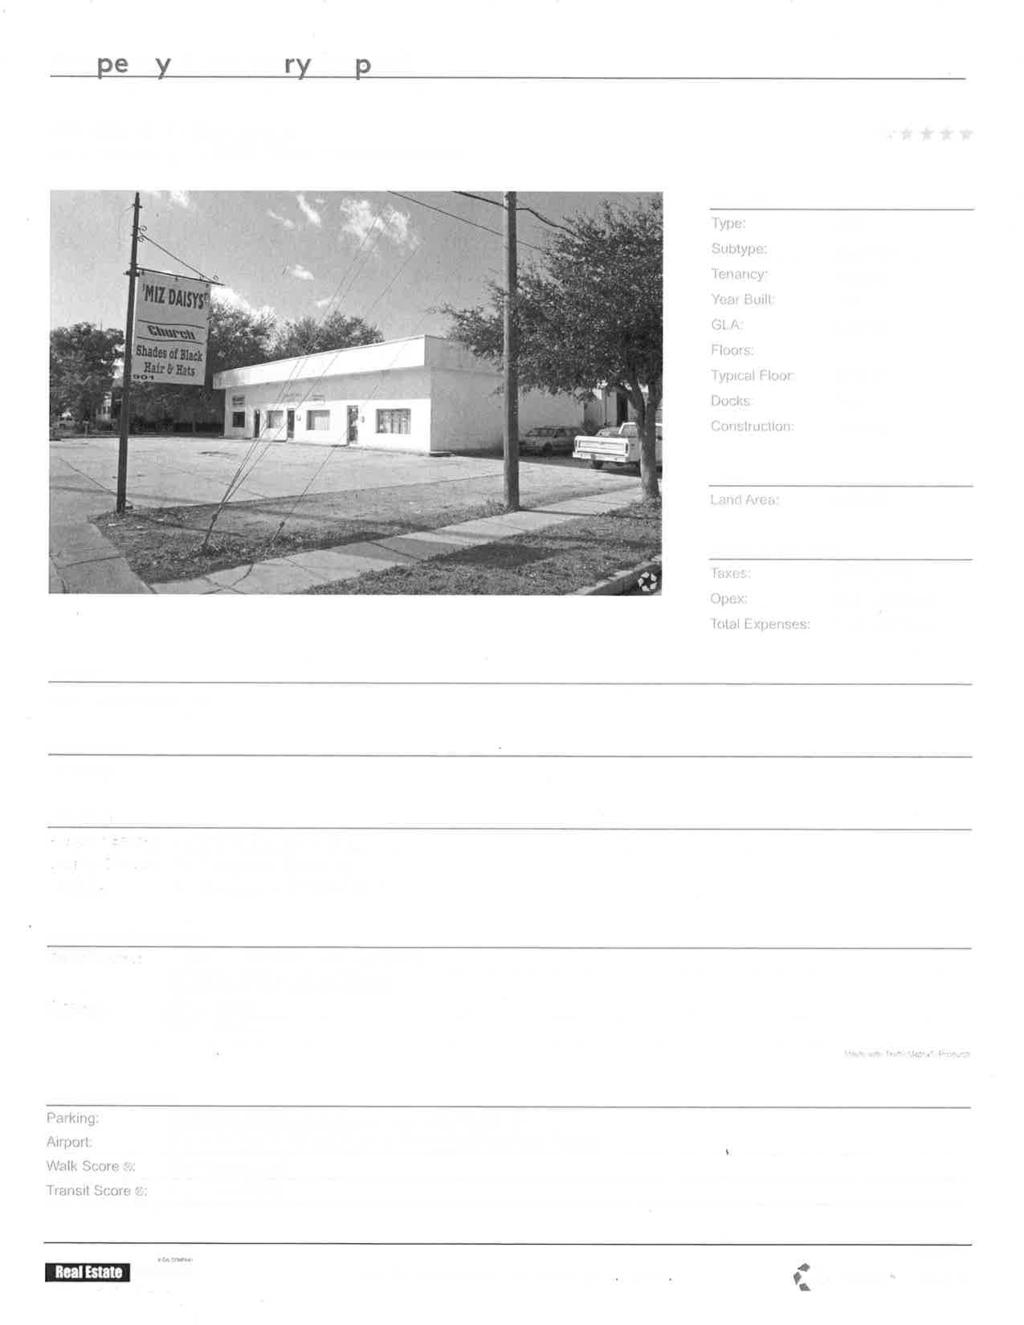
9 Exclusive private label brands: High-quality, low-priced private label assortment accounts for the majority of sales compared to about 20% in a conventional grocery store Fewer SKUs (stock keeping units): Reduced SKU assortment (approximately 2,500 items) but covers more than 90% of everyday shopper needs Low prices: Buying power of a national brand with multiple locations delivers lower prices compared with small and miscellaneous stores Stores in Target Neighborhoods: Locating stores in diverse neighborhoods and hiring from within those communities and stocking products tailored to the neighborhood Smaller Shopping experience: Stores average 15,000 sq ft A similar business model and national or regional discount grocery format would appear to provide the best opportunity to capture household demand for food-at-home expenditures and provide the community with a more ideal situation. The trade area is also currently served by a variety of retail outlets and formats with Dollar Tree and Dollar General representing national brand locations. These locations provide a mix of typical strip centers but are also freestanding locations integrated in neighborhoods throughout the trade area (see Appendix C). Based on a scan of the trade area, approximately 74,000 square feet of occupied general retail currently exists within the trade area (see Table 5). Table 5. Notable General Retail locations Location Address Sq Ft Dollar General ** th Avenue South 9,000 Dollar Tree ** th Avenue South 9,900 16th Street Plaza (Multiple) th Street South 16,800 Barnes Building nd Street South 1,976 Coin Laundry th Street South 3,000 Carters Florist nd Avenue South 2,300 GTE Financial th Avenue South 2,380 Gas/Convenience th Street South 1,560 Whitey s Transmission nd Avenue South 1,158 Miz Daisy s th Street South 3,358 Cleaners st Street South 3,534 United Transmission th Street South 4,500 Tax Time th Street South 1,500 Welch Accounting th Street South 6,150 Auto Repair th Street South 7,200 TOTAL 74,316 ** Note: Includes space dedicated to grocery assortment. 8
10 As mentioned earlier, the larger format Supercenters are likely drawing demand for local convenience shopping from a longer distance. Similar to the demand for grocery spending, these locations plus the existing supply of general retail is likely meeting the majority of household spending needs. There are a limited number of vacant lots located within the defined study area. The most notable site that could directly compete with Tangerine Plaza is located directly across the street (Parcel ) and is owned by the City of St Petersburg. The lot is approximately 2.25 acre and is identified for commercial use. Comparable Trade Area For this analysis, an additional trade area was defined around the intersection of 49 th Street North and 9 th Avenue North in order to compare differences in supportable demand. In 2015, the second defined trade area contained 5,688 households with a population of 13,309. Average household income in 2015 was $51,696 creating nearly $295 million in total annual household income. Using a model of consumer expenditures based on household income, Table 6 provides a summary of spending by retail category generated by the households within the trade area (See Appendix A). 9
11 TABLE 6: COMPARABLE MARKET AREA Area Total Household Income (average) $ 51,700 $ 294,173,000 Consumer expenditures Total $ 47,350 $ 269,421,500 Food at home 3, % 22,646,200 Food away from home 2, % 13,712,900 Alcoholic beverages % 1,877,700 Housing (incl taxes, utilities, and operations) 16, % 93,202,200 Apparel and services 1, % 9,445,400 Transportation 8, % 50,925,500 Healthcare 4, % 22,873,800 Entertainment 2, % 13,200,800 Personal care products and services % 3,243,300 Reading % 512,100 Education % 2,674,300 Tobacco products and smoking supplies % 2,162,200 Miscellaneous % 4,552,000 Cash contributions 1, % 8,364,300 Personal insurance and pensions 3, % 20,199,500 Food, retail, entertainment $ 71,352,600 A comparison of these trade areas illustrates the challenges with supporting various types of food, retail, and entertainment demand (see Table 7). Table 7. Comparison of Trade Areas Tangerine Plaza Comparable Variance Trade Area (square mile) Household Population 13,992 13, % Average PPH % Total Households 4,778 5, % Household Income (Average) $ 35,517 $ 51, % Total Income (M) $ 170 $ % Income per sq mi (000 s) $ 64,425 $ 117, % Income per capita (000 s) $ 12 $ % 10
12 The comparable trade area reflects a consistent level of population (consumers), but significantly stronger levels of income and consumer expenditures. Total household income and income per capita is nearly double compared with the main trade area. As a result, this area is more capable of supporting traditional grocery formats and includes existing locations. Other Potential Occupants While grocery stores have become a strong focus for low-income communities, any retail format or category is going to face similar problems with operating locations that are below corporate profitability goals. The discount retail concept started as an effort to address some of these issues and any other viable retail brands sharing the existing space would also need to be consistent with a lower income primary target market. There are a variety of local, regional, or national discount store brands that could fulfill some level of market demand. However, many of the major discounters now operate "supercenters", which add a full-service grocery store to the traditional format. Wal-Mart and Target have focused on this format beginning in the 1990 s as a key to their continued growth. In addition, the recent merger of Dollar General and the Dollar Store is generally viewed as a strategy to compete with Wal-Mart, which may not include larger retail formats, but it illustrates recent trends that continue to shrink options for discount retail locations. Regardless of the size of the market for discount retailers, other viable retail brands will also likely require some level of operating incentive in order to maintain sustainable profitability. A viable alternative to discount retail could be provided with a non-retail tenant. There are a number of consolidated health care organizations that provide an example of a potential community partner. According to available information, these organizations are focused on building programs providing comprehensive health services beyond basic medical by including community centric activities that promote health lifestyles. As a result, they typically require larger space than a conventional physician s office. 11
13 Conclusions and Observations The root cause of retail store closures can involve a web of complex corporate strategies, but the single identifiable reason most likely comes down to profitability. A lack of market demand or top line revenue is almost certainly the reason for store closures, especially in the case of successive closures. Across all retail categories (i.e. apparel, grocery and specialty), there is a strong correlation between net margin (profit) and selling, general, and administrative ( SG&A ) costs indicating that lower operating costs is the strongest factor in determining profitability (see Figure 3). Figure 3. Grocery Net Margin % and SG&A %. Note: Sample of national grocery brands As a result, some cities across the US are turning to providing incentives as an economic development strategy to encourage retailers to open and operate in low-income communities. This economic development strategy is clearly aimed at lowering operating costs in an effort to improve profitability because top line revenue is not sufficient. The goal of these incentives is to provide the ability of retailers to remain operating over the long-term. One recent case involves the city of Indianapolis (see City to steer $500K into grocery development in low-income areas., IBJ.com) where the city is creating a fund of $500,000 to provide incentives to attract traditional grocery store formats in low-income communities. The program could provide assistance to a single location or involve multiple stores. 12
14 Appendix A Detailed Market Table 13
15 APPENDIX A: TANGERINE PLAZA MARKET AREA Household Income Less than $5,000 $5-9,999 $10-14,999 $15-19,999 $20-24,999 $25-34,999 $35-49,999 $50-74,999 $75-$99,999 $100- $149,999 $150,000 or more Total Household Income (mean) 2,500 7,500 12,500 17,500 22,500 30,000 42,500 62,500 87, , ,000 $ 35,516 Households (occupied) ,778 Share of households 9.1% 7.4% 10.9% 11.9% 8.0% 15.9% 16.7% 12.5% 4.0% 2.5% 1.1% Consumer expenditures (mean) $ 18,314 $ 21,410 $ 24,474 $ 27,505 $ 30,503 $ 34,937 $ 42,162 $ 53,292 $ 66,460 $ 84,661 $ 142,869 $ 37,231 Housing (Shelter) 5,676 6,412 7,086 7,705 8,273 9,039 10,129 11,520 12,937 15,014 31,226 9,146 Food at Home 2,000 2,268 2,516 2,745 2,956 3,243 3,652 4,162 4,631 5,163 8,027 3,236 Food away from home 844 1,000 1,158 1,317 1,476 1,717 2,118 2,753 3,518 4,568 7,352 1,858 Household furnishings ,200 1,583 2,045 2,668 4,022 1,045 Apparel ,132 1,369 1,738 2,184 2,822 5,133 1,217 Entertainment ,141 1,295 1,449 1,680 2,067 2,679 3,425 4,475 7,687 1,824 Other (transportation, healthcare) 7,912 9,507 11,149 12,829 14,543 17,166 21,627 28,857 37,720 49,951 79,422 18,906 Share of consumer spending Housing (Shelter) 31.0% 29.9% 29.0% 28.0% 27.1% 25.9% 24.0% 21.6% 19.5% 17.7% 21.9% 24.6% Food at Home 10.9% 10.6% 10.3% 10.0% 9.7% 9.3% 8.7% 7.8% 7.0% 6.1% 5.6% 8.7% Food away from home 4.6% 4.7% 4.7% 4.8% 4.8% 4.9% 5.0% 5.2% 5.3% 5.4% 5.1% 5.0% Household furnishings & equipment 2.5% 2.5% 2.6% 2.6% 2.7% 2.7% 2.8% 3.0% 3.1% 3.2% 2.8% 2.8% Apparel 3.2% 3.2% 3.2% 3.2% 3.2% 3.2% 3.2% 3.3% 3.3% 3.3% 3.6% 3.3% Entertainment 4.6% 4.6% 4.7% 4.7% 4.7% 4.8% 4.9% 5.0% 5.2% 5.3% 5.4% 4.9% Other 43.2% 44.4% 45.6% 46.6% 47.7% 49.1% 51.3% 54.1% 56.8% 59.0% 55.6% 50.8% Consumer expenditures ($, 000's) 7,948 7,536 12,800 15,650 11,622 26,587 33,561 31,922 12,760 10,075 7,429 $ 177,891 Housing (Shelter) 2,463 2,257 3,706 4,384 3,152 6,879 8,063 6,900 2,484 1,787 1,624 43,699 Food at Home ,316 1,562 1,126 2,468 2,907 2, ,459 Food away from home ,307 1,686 1, ,879 Household furnishings & equipment ,994 Apparel ,090 1, ,813 Entertainment ,278 1,645 1, ,715 Other 3,434 3,346 5,831 7,300 5,541 13,063 17,215 17,285 7,242 5,944 4,130 90,332
16 Appendix B Non-traditional Grocery and Food Markets 14

17 South City Grocery and Meat nd Street South 15

18 3 Brothers Groceries th Street South 16

19 Wildwood Meat Market th Street South 17

20 Redstone Markets nd Street South 18

21 Obama Express Food Market th Avenue South 19

22 Dave s Meat Market th Avenue South 20

23 Midtown Supermarket th Avenue South 21

24 Mair s Grocery 2230 Dr. Martin Luther King Boulevard 22

25 Rajax Market 2327 Dr. Martin Luther King Boulevard 23

26 727 Food Market nd Avenue South 24
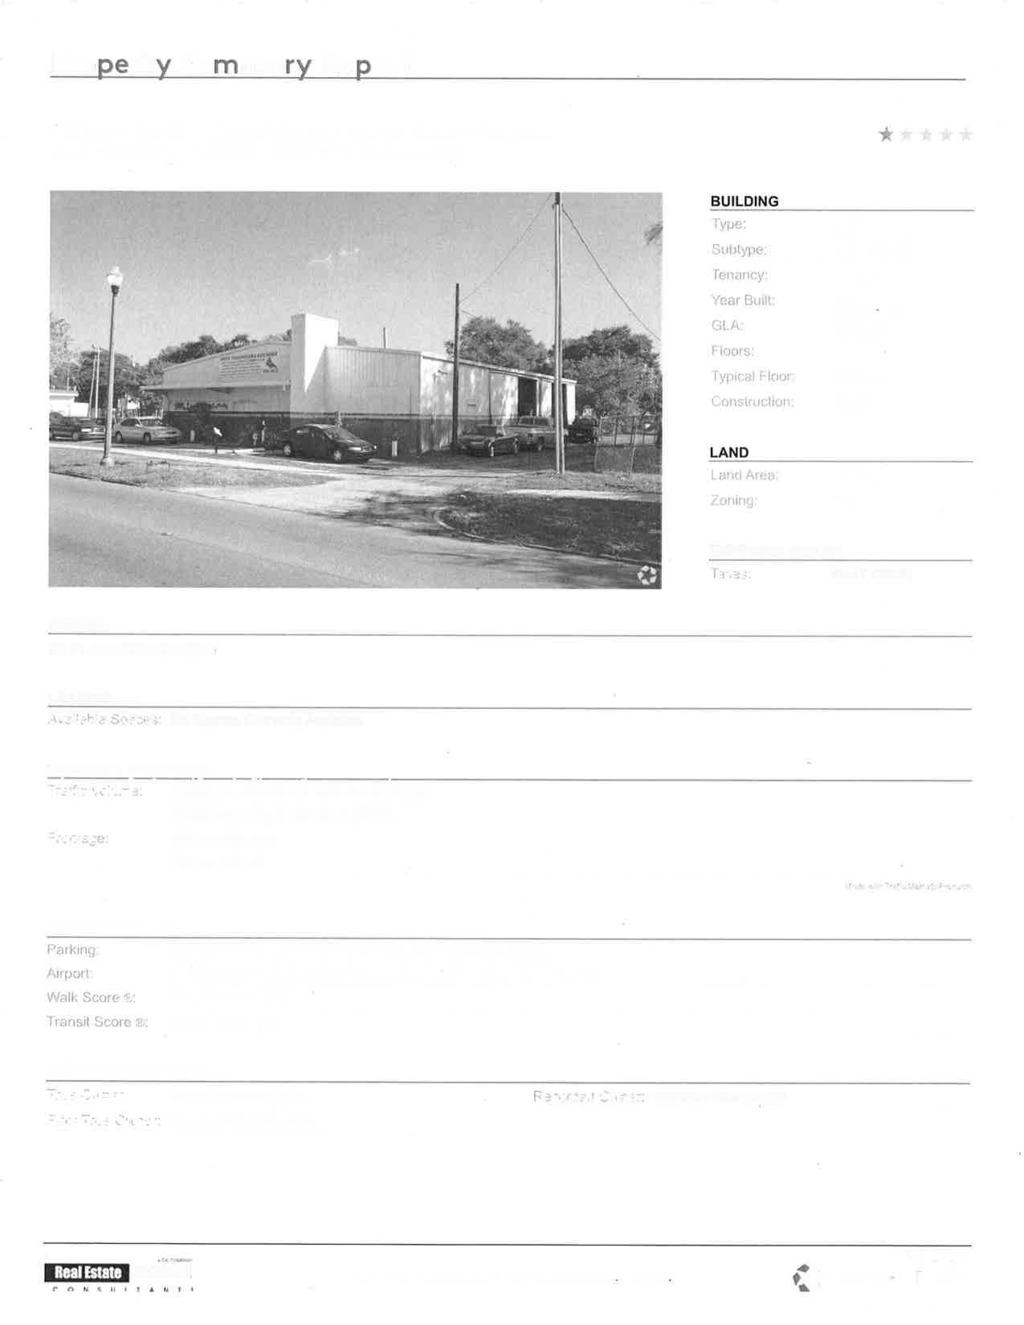
27 Appendix C Sample of Retail Locations 25
28
29

30
31
32
33
34
35
36
37
38
39
40
41
42
43