Indian Consumers Spending Patterns on Frozen Desserts
|
|
|
- Godfrey Bennett
- 5 years ago
- Views:
Transcription
1 Indian Consumers Spending Patterns on Frozen Desserts Vishakha Raut & Aniket Ambardekar Abstract The research paper talks about how product attributes and demographic variables affect the decisions of consumers to re-purchase frozen desserts. The data was collected from sixty three respondents across various age groups, income levels, gender, etc. Vadilal s, Amul and Mother Diary have a higher usage rate as compared to other brands. Frozen desserts are generally preferred during special occasions than regular use. Moreover, there were relationships between re-purchase decision and demographics. INTRODUCTION Frozen desserts is the universal name given to desserts that are made by freezing liquids, semi-solids and sometimes even solids. They can be based on flavoured water i.e. shave ice, sorbets, snow cones, etc., on fruit purees like sorbet, on milk and cream i.e. ice creams, on custards, on mousse and many others. The term Frozen Dessert is often used for products that are identical to the taste and texture of ice cream but do not meet the legalized definition of the term. Frozen Desserts are often made with vegetable oil i.e. mellorine as opposed to milk or cream. In the recent past there has been a substantial evolution in the category of ice-cream and frozen desserts. A decade ago this category was limited to traditional flavours of icecreams such as vanilla, chocolate, kesar pista, mango, elaichi, butterscotch, kulfi, etc. In the recent years, this category has grown and has undergone many innovations in icecreams and has also come up with a new sub category like the frozen yoghurt. This category has been through an evolution wherein the ice-cream category has grown with the consumer perception for the products and the services being offered to the consumers. In the past ice-cream was considered in the indulgent category and now it has to a stage where it is largely and happily recognized by consumers as a snacking option. This change of perception has come about due to the increasing disposable incomes and greater discretionary spending of the consumers. Media has played an important role in reaching out to the consumers and making them aware of this category. The category s growth has provided a spur to international and regional players who are the players in the industry. The sales of the desserts doubled from 2007 to 2012 and will do so again in the five next years till 2017 and will reach.6860 crores, by Euromonitor predicts. Indian consumers are happy with frozen desserts using low cost fats like the palm oil. Till 2012, Gujarat Co-operative s share of the market for frozen treats fell from 35% to 31% while Unilever s market share rose to 21% from 17%, according to the research by Euromonitor.
2 LITERATURE REVIEW According to Kriti Bardhan Gupta, the relative importance of various food purchasing criteria was estimated for four different food categories, food and vegetables; milk and milk products; food grains and pulses; and processed foods on 1-5 scale. Based on grand mean score for all the four categories of food products, the five most important parameters that respondents rated very highly for food purchasing decisions are: cleanliness, free from pesticides, freshness, good for health, and clean place of sale. Value for money, overall quality, taste, variety of products availability at same place, seasonality, flavour, good display of products, nearby availability and good ambience are some other parameters, which were rated highly by respondents. Freshness, cleanliness and good for health are the three most important parameters for relatively more perishable products like fruit, vegetable and milk product. For processed food items, apart from cleanliness and freshness, free from pesticides and clean place of sale are the most important criteria. RESEARCH OBJECTIVES The main objective of the paper is to study the spending habits of consumers on frozen desserts. The other objectives are: To study the awareness of frozen dessert To study the usage rate of frozen desserts. To study the preference of brands of frozen desserts. RESEARCH METHODOLOGY Our research included gathering of primary data which was crucial for understanding the spending habits of consumer on frozen desserts. Our sample size consisted of 62 respondents. Our research instrument for this was questionnaire which contained 16 questions. The research therefore had to be exploratory in nature. RESEARCH DESIGN Tools of Data collection The tools of data collection used to conduct this survey are the questionnaire and the 62 respondents. Primary Data The primary data for the study is conducted by means of structured online questionnaire Research Instrument The questionnaire is designed in such a way that is fulfils the objective of the study. It includes mostly closed ended and a few open ended options for the convenience of respondents. Contact Methods s, Social Networking Site (Facebook)

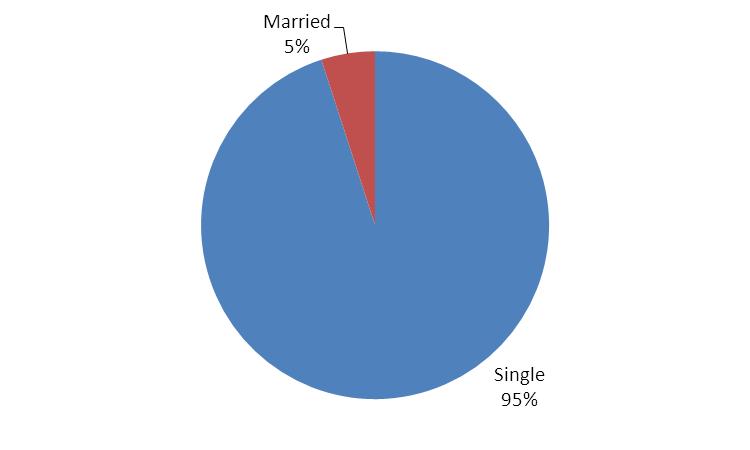


3 SAMPLE DEMOGRAPHICS Education Gender Marital Status Employment Status Profession
 Majority of the respondents are earning between Rs. 0-1 lakhs per month.")

4 DATA ANALYSIS AND INTERPRETATION MAJOR FINDINGS Monthly Family Income (Rs. lakhs per month) Majority of the respondents are earning between Rs. 0-1 lakhs per month. As majority of the respondents are students. Frozen ice cream [How much do you spend on frozen food per month? (Rs. per month)] Approximately 45% of the respondents spend less than 500 on frozen ice cream per month.
] Majority of the respondents spend less than Rs 500 on frozen yogurt per month.")


5 Frozen yogurt [How much do you spend on frozen food per month? (Rs. per month)] Majority of the respondents spend less than Rs 500 on frozen yogurt per month. Frozen ice cream [How did you learn about the various brands of frozen food?] Analysis: Television commercials play a major role on creating awareness about frozen ice cream. Frozen yogurt [How did you learn about the various brands of frozen food?] Analysis: Visibility of frozen yogurt in Retail outlets is the key factor for awareness about the product in the minds of the customer.
![Frozen ice cream [Indicate your preference for frozen food] Analysis: Frozen ice creams are very much preferred by the](/docs-images/95/122599492/images/6-0.jpg "respondents. Focus could be given towards customers who dislike the product.")
![Frozen yogurt [Indicate your preference for frozen food] Analysis: Companies could focus on frozen yogurt as; frozen](/docs-images/95/122599492/images/6-1.jpg "yogurts are not preferred as a product by the customers. Kwality Walls [How often have you used the following brands?")
6 Frozen ice cream [Indicate your preference for frozen food] Analysis: Frozen ice creams are very much preferred by the respondents. Focus could be given towards customers who dislike the product. Frozen yogurt [Indicate your preference for frozen food] Analysis: Companies could focus on frozen yogurt as; frozen yogurts are not preferred as a product by the customers. Kwality Walls [How often have you used the following brands?] Analysis: 37% of the respondents have never tried Kwality Walls.


7 London Dairy [How often have you used the following brands?] Analysis: 89% of the respondents have tried London Dairy atleast once. Mother Dairy [How often have you used the following brands?] Analysis: 71% of respondents consume Mother Dairy products on regular basis. Amul [How often have you used the following brands?] Analysis: 89% of the respondents have tries Amul products atleast once.
![Bournville [How often have you used the following brands?] Analysis: Majority of the respondents have never tried Bournville products. Danone [How often have you used the following brands?](/docs-images/95/122599492/images/8-0.jpg "] Analysis: Danone has the least number of respondents who haven t tried the product even once. This shows the brand awareness in the product category.")
8 Bournville [How often have you used the following brands?] Analysis: Majority of the respondents have never tried Bournville products. Danone [How often have you used the following brands?] Analysis: Danone has the least number of respondents who haven t tried the product even once. This shows the brand awareness in the product category. Baskin Robbins [How often have you used the following brands?] Analysis: 77% of the respondents have Baskin Robbins products on more than one occasion.


![] Analysis: 8% of respondents have tried Vadilal s products just once.](/docs-images/95/122599492/images/9-2.jpg "And 13% have never tried the products of the particular brand.")
9 Chitale [How often have you used the following brands?] Analysis: There is very little awareness of Chitale as a brand in the frozen desserts product category, as 55% of the respondents have never tried the brand products. Vadilal's [How often have you used the following brands?] Analysis: 8% of respondents have tried Vadilal s products just once. And 13% have never tried the products of the particular brand. Frozen ice cream [How do you use the following frozen foods?] Analysis: The responses shows that people still prefer having Frozen ice cream as Desserts.


10 Frozen yogurt [How do you use the following frozen foods?] Analysis: 27% of the respondents prefer frozen yogurt as a side dish. Frozen ice cream [When do you consume the following frozen foods?] Analysis: only 23% of the respondents have frozen ice cream during snack or breakfast. Frozen yogurt [When do you consume the following frozen foods?] Analysis: 34% of respondents consume frozen yogurt only on special occasions.
11 HYPOTHESIS TESTING Hypothesis 1: H o: The average amount spent on frozen desserts is more than or equal to 1500 H a: The average amount spent on frozen desserts is less than 1500 Null Ho: µ 1500 α df Alternate Ha: µ < Tail Left - Tail test Test T-test Alpha 10% Probability 10% T-Critical T-Observed x' 1, µ % 40% s sqrt(n) 7.87 x'-µ s/sqrt(n) T-Observed P-value Alpha 0.10 Decision Reject the NULL Conclusion Thus,the average amount spent on Frozen desserts is less than Rs. 1500/- Business Decision Average monthly spending on Frozen Desserts is on a lower side. Companies should focus to increase the average spending to Rs. 3,000 or more. This can be done by focusing on the untapped markets.

12 Hypothesis 2: H o: The proportion of respondents who prefer having frozen desserts on special occasions is less than or equal to 70%. H a: The proportion of respondents who prefer having frozen desserts on special occasions is more than 70%. Null Ho: p 70 Alternate Ha: p > 70 Tail Right - Tail test Test Z-test Alpha 10% Probability 90% Z-Critical 1.28 Z-Observed x 46 n 61 p' % p % q 0.30 p'-p 0.05 sqrt(p*q/n) 0.06 Z-Observed 0.92 P-value Alpha 0.10 Decision Accept the NULL Conclusion Business Decision Thus, the proportion of respondants who prefer having frozen desserts on special occasions is less than or equal to 70%. Further research needs to be conducted to find out the accurate percentage of respondents who prefer having frozen desserts on special occasions only. Focusing on these customers and converting them to regular customers will gradually benefit the companies.
13 Hypothesis 3: H o: The preference for frozen desserts is independent of Income Step 1 Fo Dislike Completely dislike somewhat Neither like nor dislike Somewhat like Completely like Total % % % % Above % Total % Step 2 Completely Dislike Neither like nor Somewhat Completely Fe dislike somewhat dislike like like Total Above Total Step 3 (Fo-Fe)^2/Fe Completely dislike Dislike somewhat Neither like nor dislike Somewhat like Completely like Total Above Total Null Ho: The Preference for frozen desserts is independent of Income. Alternate Ha: The Preference for frozen desserts is NOT independent of Income. Tail Right - Tail test Test Chi - square test Alpha 0.10 Probability 0.90 df=(c-1)*(r-1) Z-Critical Z-Observed P-value % 10% Alpha 0.10 Decision Accept the NULL Conclusion Thus, the Preference for frozen desserts is independent of Income. Business Decision: Cost of frozen desserts differs according to brands available in the market. Although preference for frozen desserts is independent of income, but it might be dependent for lower income class groups. So brands should also focus on low price products so as to capture lower income level category.
14 Hypothesis 4: ch o : The average preference for frozen desserts is same across brands ch a : The average preference for frozen desserts is NOT same across brands rh o : The average preference for frozen desserts is same across gender rh a : The average preference for frozen desserts is NOT same across gender Gender Brands Kwality Walls London Dairy Mother Dairy Amul Bournville Danone Vadilal's Baskin Robbins Chitale Female Male Anova: Two-Factor Without Replication SUMMARY Count Sum Average Variance Female Male Kwality Walls London Dairy Mother Dairy Amul Bournville Danone Vadilal's Baskin Robbins Chitale ANOVA Source of Variation SS df MS F P-value F crit Alpha Decision Rows Accept the NULL Columns Reject the NULL Error Total Thus, the average preference for frozen desserts is same across gender Thus, the average preference for frozen desserts is NOT same across brands Business Decision There is no brand loyalty among the respondents, but the preference across genders is same. Companies should focus on creating brand loyalty among the customers by giving them flexible price ranges to choose same brands over the competitors.
15 CONCLUSION The research paper reveals that spending habits of consumers depends on factors like age, gender, employments status, income, profession etc. Although the finding shows that brand preference is independent of income, it is in relevance to certain brands only. Brand managers should focus on building brand loyalty among their existing customers and also convert the potential customers into new customers. Other aspects that affect the spending habits of the consumers is value for money, overall quality, price of the products, availability of the products, flavour and overall quality of the product. Brand name in itself affects the spending habits of the consumers, as today s generation is more brands conscious. LIMITATIONS OF THE RESEARCH The responses collected were done through e-forms only. We were not able to conduct personal interviews due to time constraint, so few aspects were left uncovered like place of purchase, family size, price of variants under each brands. Majority of the respondents were between the age group of 19 years to 28 years. So the sample considered for research is not the true representation of the population. The study was geographically confined to particular location, so the perception of the entire population is not known. Due to all the mentioned limitations, the research findings may not be universally applicable. REFERENCES Consumer Behaviour for Food Products in India, Submitted to International Food & Agribusiness Management Association for 19th Annual World Symposium to be held at Budapest, Hungary on June 20-21, 2009 by Kriti Bardhan Gupta, Associate Professor.