Getting to Know Social Media Analytics
|
|
|
- Gervase Cobb
- 5 years ago
- Views:
Transcription

1 Getting to Know Social Media Analytics Dr. KAM Tin Seong, Ph.D Associate Professor of Information Systems (Practice) School of Information Systems, Singapore Management University Tel: Paper prepared for 2007 INFORMS Marketing Science Conference, Singapore Date: 30 June 2007 Content What is social media analytics Mining and visualising social media Graph visualisation Network analysis metrics SNA Case study: Event detective Visualising and analysing spatio-temporal patterns of social media data Pandemics in the age of social media 2 1

![Accessed 13 Apr 2011 (http://www.facebook.com/press/info.php?statistics) [2] Twitter Blog: #numbers, 14 March 2011 (http://blog.](/docs-images/95/123284982/images/2-4.jpg "twitter.com/2011/03/numbers.")
2 Motivation Rapid growth of social media Facebook: 500 million users 1 Twitter: 200 million users 2 More updates posted than ever before Facebook: 7.5 billion items shared per week 1 Twitter: 1 billion tweets per week 2 [1] Facebook Press Room. Accessed 13 Apr 2011 ( [2] Twitter Blog: #numbers, 14 March 2011 ( Social Media and Society East-West line MRT breakdown 7 th April 2011 Political Forum 2 nd April

3 What is Social Media Analytics Social media analytics is the practice of gathering data from blogs and social media websites, such as Twitter, Facebook, Digg and Delicious, and analysing that data to inform business decisions. The most common use of social media analytics is gauging customer opinion to support marketing and customer service activities. Source: 5 Social Network Analysis It maps and measures formal and informal relationships to understand what facilitates or impedes the knowledge flows that bind interacting units, viz., who knows whom, and who shares what information and knowledge with whom by what communication media (e.g., data and information, voice, or video communications) Two-mode view of the Southern Women social event dataset Valdis Krebs (2010) Your Choice Reveal Who You Are: Mining and Visualizing Social Patterns in Beautiful Visualization. 6 3

4 A Simple Network Graph Vertices Edges 7 The Ego Network Greener vertices have higher eigenvector centrality, and larger vertices have higher betweeness centrality. 8 4


5 Social Network Metrics Aggregate network metrics Vertex-specific network metrics Clustering and community detection algorithm Structures, network motifs, and social roles 9 SNA of Facebook friends Could I figure out the social structure of my Facebook? 10 5


6 Tools for analysing and visualising social media network NodeXL, an Excel Add-in for analysing and visualising social media network Gephi, an open source interactive visualization and exploration platform for all kinds of networks and complex systems, dynamic and hierarchical graphs. 11 Historical and Legal Analysis of Enron SNA was used to identify key individuals using content networks 12 6


7 SNA for Analysing Calling Patterns 13 Event Detective Visualising and analysing the structure of connections among people discussing an event (i.e. Presidential election 2011) via social media services like Twitter. 14 7

")
 HyperCities: Egypt")


8 Location-based social networking Google Latitude (February 2009) Foursquare (March 2009) Facebook Places (August 2010) HyperCities: Egypt T. Presner, Y. Kawano, D. Shepard, UCLA Digital Humanities Collaborative ( 8

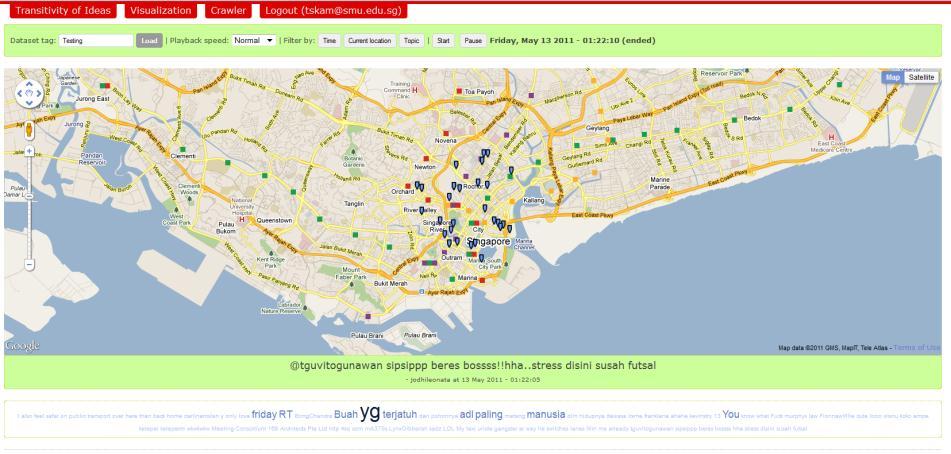
9 Welcome to TwitterSense 17 Welcome to TwitterSense

10 GeoTweets on GE2011 polling day 21,180 Tweets, 5810 with #sgelection 19 Geographic visualisation This dot map showing the spatial patterns of tweets on GE2011 polling day 20 10


11 Animated map Animation and interactive slider are used to detect spatio-temporal patterns 21 Density map Hotspots can be detect easily with density map 22 11

12 Trellis data visualisation The data visulisation shows the spatio-temporal patterns of the tweets. 23 Pandemics in the Age of Social Media To visualise and detect the spatio-temporal patterns of the epidemic spread Is the outbreak contained? Is it necessary for emergency management personnel to deploy treatment resources outside the affected area? 24 12

13 Geotagged Twitter data A total of 1,023,077 between 30/04/ /05/ Visualising and detecting spatio-temporal patterns (I) 26 13

14 Visualising and detecting spatio-temporal patterns (II) 27 In Conclusion Social media analytics can be fun! You shouldn t have to be a statistician to get information from your data Interactive and visual analytics approaches empowering everyday data analysts Visual analytics is more than computer graphics. It s an entirely different way of approaching data: It s dynamic, it s interactive, and it s visual