METROLINA MARKETING. Big Grower Executive Summit February 23, 2016
|
|
|
- Clementine Wade
- 5 years ago
- Views:
Transcription
1 1 METROLINA MARKETING Big Grower Executive Summit February 23, 2016


2 Family Owned and Operated Metrolina Greenhouses Who Are We? Acres Sales Started in 1972 by Tom and Vickie Van Wingerden 2 Locations - Huntersville, NC and York, SC Growth Acres Acres Acres 2 Locations 300,000, ,000, ,000, ,000, ,000,000 50,000,000 0 Dollars Year Number of Employees Sales Growth Trailers Trailers Comp Growth New Items New Consumers , , Trailers
3 3 Industry Evolution 1980 s 1990 s 2000 s 2010 s 2010 s 2015 s Automation Breeding Packaging Logistics Technology Consumer Faster at a lower cost Breakthrough and grower friendly items. Containers, Multipacks, New sizes Smaller more frequent deliveries Real Time Data. Stronger Analytics. Ready access to consumers will they use it? Will we?


4 4 Retail Progress Grower Lead Shift to Retailer Consumer is King Partnership
5 5 Meet the Team Abe VanWingerden Mariah Holland Jessica Johnson Cady Warner Brie Craig Julie Colon Stephen LaVine CEO/Owner Director of Marketing Marketing Manager Lowe s Marketing Manager Walmart Marketing Manager Consumer Research Marketing Manager Corporate and Creative Marketing Photographer and Videographer Marketing Maverick Creative Instigator Love Where you Live Save Money. Live Better Inquiring Minds Want to Know Adding Beauty to the World Through the Lens

6 6 What We Do Customer Resource Support Internal Teams Develop and Manage Products Content Development Consumer Research Bringing Ideas to Life

7 7 Customer Resource Strategy Development Creative Councils Collaboration Different departments Growers Product Development and Improvements Merchandising Execution Company Awareness and Promotion Availability Videos Consumer Content edium=clip-transcode_complete-finished &utm_campaign=7701& _id=Y2xpcF90cm Fuc2NvZGVkfDU3OGY3MmEyZGM1ZmU1NmFlY2FhZj FiODI5Yzk3MjIyMzIyfDQyMDkzMjczfDE0Mzc0MTg0MTF 8NzcwMQ%3D%3D
8 8 Product Development Strategy Retailers Internal Sales R&D Consumer Breeders Hard Good Suppliers
9 9 Content Development Plant Story Grow Care and Maintenance Photography Silo Bloom Lifestyle End Use Videography Bloom Inspiration Projects Solutions Promote In Store Online In Print
10 Consumer Research 3 10
11 Then 11

12 Now 12

13 13 Research Avenues Home Garden Panel Online Custom Panel Focus Groups Data Analysis Market Trends In Store Competitors Other Industries Social Movements


14 Metrolina s Home Garden Panel Our Approach 14 Every company has very similar OVERALL demographic trends on: Aging of the Population Diversity Changes of the Population Social-Economic Impacts Home Garden Panel is Different Our goal is to be aware of unique consumer needs of the live Goods consumers. What they want and Why? Why: Uniqueness - Tons of Base Demographic DATA already exists on the Big Box Consumer, but none was out there on the Live Goods. Understanding/Validate- Consumer research is critical.our industry is notorious for trying to get consumers to understand more about us vs. trying to understand more about them. Save Money- HGP provides an avenue for testing out new ideas and concepts more efficiently. SELLING MORE PRODUCT - Insights provide opportunities to better satisfy consumer needs, ultimately increasing the purchase of existing consumers and capturing the purchase of non users.

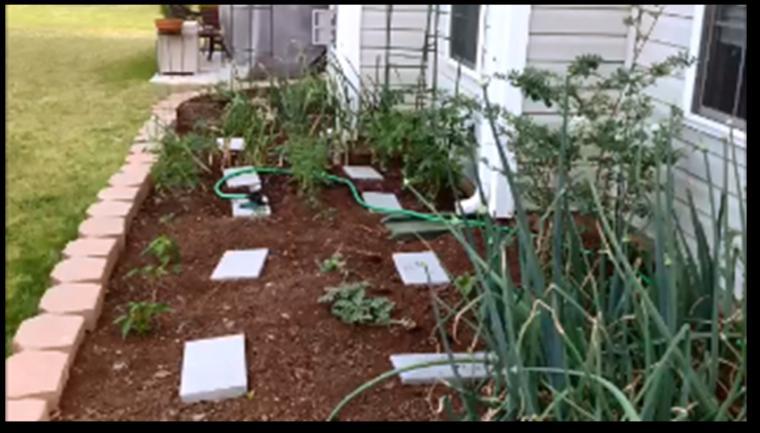
15 The Ideal Garden 15

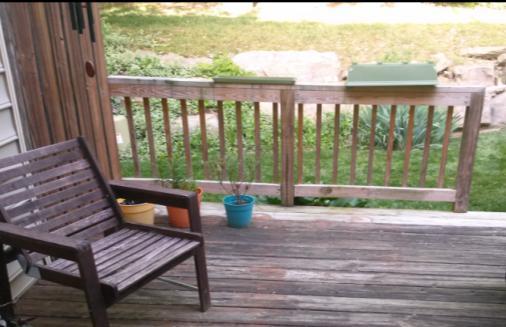
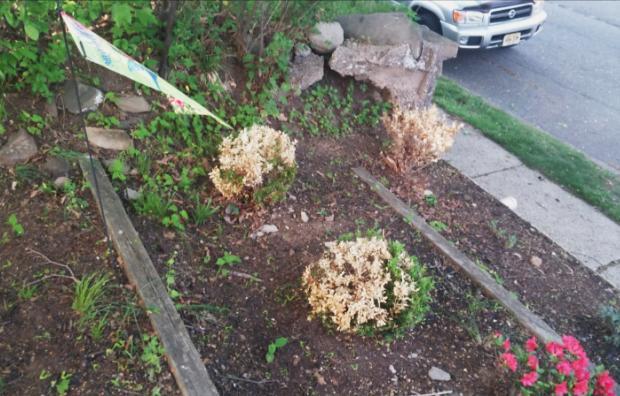
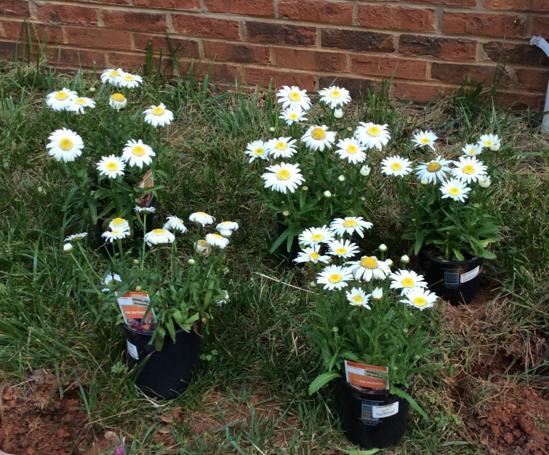
16 The Reality Garden 17


17 2015 Key Learnings 17 They have a thirst for more knowledge on how to take care of the their plants #1 Reason people don t make the decision to buy: They are afraid they are going to kill it. Quality is still king.the sale can be lost at the point of purchase Once they decide to buy, the #1 reason they don t is the Plants did not look cared for They Want Easy to Care For Plants Messaging Things they know don t take a ton of work, and are easy to keep alive People are starved for time On Average, 30 Minutes in Store is their shopping experience On average, they spend 1 Hour in their Garden per occasion, we need it in small chunks vs. one Project Displays can be a game-changer Because this is an impulse purchase, 40% of live goods consumers say that displays have a direct correlation with their purchase baskets, often leading to unplanned purchases There is a HUGE OPPORTUNITY with People who shop at but don t currently buy Live Goods.Why don t they?

18 18 By Retailer Do you buy different colors of plants based on what season it is? 80% 70% 60% 50% 40% 30% 20% 10% 0% 44% 48% 43% Yes 56% 57% 49% 52% 51% 33% No 67% Total Lowes Home Depot Walmart IGC Insight: The trend is reflected across all retailers.
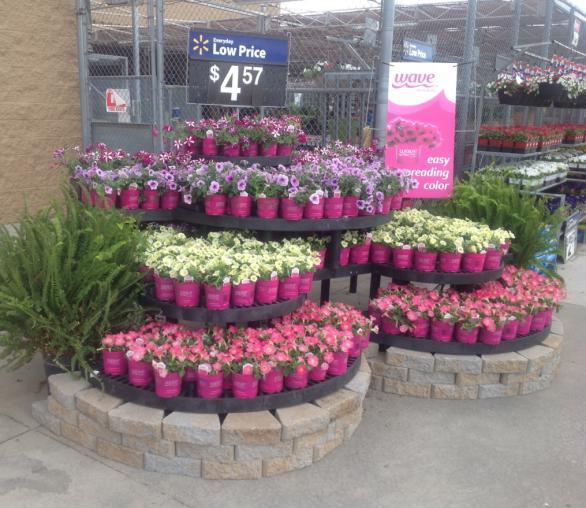
19 20 Color is King Do you buy different colors of plants depending on what season it is? If so, which colors do you buy most in each season? (Please select all that apply) Spring Pink 81% White 70% Purple 68% Bi-color 66% Multi-color 61% Yellow 58% Blue 57% Red 40% Orange 29% Not sure 19% Bronze 11% Among the 219 respondents who buy different color plants based on the season: Summer Multi-color 75% Bi-color 66% Red 64% Blue 64% White 62% Purple 60% Pink 57% Yellow 53% Orange 41% Bronze 17% Not sure 16% Fall Bronze 79% Orange 70% Yellow 48% Bi-color 41% Multi-color 39% Red 37% Purple 31% White 25% Not sure 21% Blue 19% Pink 11% Winter Not sure 88% Red 40% Multi-color 29% Bronze 26% Bi-color 26% White 25% Blue 16% Purple 12% Yellow 12% Orange 9% Pink 4% 2014 Top Colors: Pink, Purple & Bi-color 2014 Top Colors: Bi-color, Blue & Red 2014 Top Colors: Orange, Yellow & Red 2014 Top Colors: Red & White Action Item: It is imperative to sales that stores are stocked up on the most popular colors for each season.


 Whatever looks the best Spreading/Medium")
 Trailing/Low (spilling over the")
")
20 What type of growing habit do you like the plants in your containers to have? Among the 412 respondents that garden in containers: 20 60% Pictures shown to panelists 50% 40% 38% 30% 20% 10% 20% 20% 14% 8% 0% Combo of all three (filler, spiller, thriller idea) Whatever looks the best Spreading/Medium height (1.0 ft or less) Upright/Tall (1.0 ft or more in height) Trailing/Low (spilling over the sides) Insight: Nearly 40% of consumers prefer a combination of growing habit (spiller, filler, thriller) in their containers though one-fifth choose whatever looks best or spreading/medium.
: 90% 80% 70% 60% 50% 40% 30% 20% 10% 0% 76% 79% 72% 69% 68% 69% 64% 62% 56% 51% 45% 47% 47% 41% 39% 44% 39% 41% 35% 39% 32% 23% 25% 10% 12% 22% 10% 11% 6% 6% 10% 10%")
21 21 Trend In what month(s) do you typically visit a Garden Center? (Please select all that apply): 90% 80% 70% 60% 50% 40% 30% 20% 10% 0% 76% 79% 72% 69% 68% 69% 64% 62% 56% 51% 45% 47% 47% 41% 39% 44% 39% 41% 35% 39% 32% 23% 25% 10% 12% 22% 10% 11% 6% 6% 10% 10% 10% 9% 9% 7% Insight: As in previous years there is significant garden center traffic into June and July and for 9 of the 12 months consumers seem to be visiting more. Action Item: Continue efforts to expand the shoulder seasons and capitalize on the post-mother s Day opportunity.


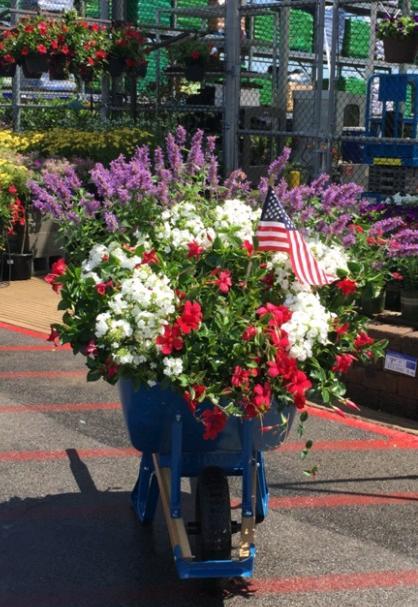
22 Shoulder Season Programs- Summer 22


23 23 CAST By Retailer Using the following scale, how likely would you be to purchase a 1.5 gallon petunia such as the below for $11.98? Total Lowe's Shoppers Home Depot Shoppers Walmart Shoppers IGC Shoppers Response N % N % N % N % N % Total % % % % % Definitely Will Purchase % 27 22% 30 21% 49 33% 4 6% Probably Will Purchase % 52 42% 49 35% 51 34% 21 33% Top 2 Box Total % 79 64% 79 56% % 25 39%


24 24 CAST By Retailer Using the following scale, how likely would you be to purchase a 2.0 gallon petunia such as the below for $16.98? Total Lowe's Shoppers Home Depot Shoppers Walmart Shoppers IGC Shoppers Response N % N % N % N % N % Total % % % % % Definitely Will Purchase 91 18% 23 19% 25 18% 33 22% 7 11% Probably Will Purchase % 39 32% 44 31% 51 34% 17 27% Top 2 Box Total % 62 50% 69 49% 84 57% 24 38%

25 25 CAST By Age Using the following scale, how likely would you be to purchase a 2.0 gallon petunia such as the below for $16.98? Total Over 60 Response N % N % N % N % N % N % Total % % % % % % Definitely Will Purchase % 16 21% 35 35% 24 22% 19 17% 7 7% Probably Will Purchase % 38 49% 34 34% 48 45% 35 32% 27 25% Top 2 Box Total % 54 70% 69 69% 72 67% 54 49% 34 32%


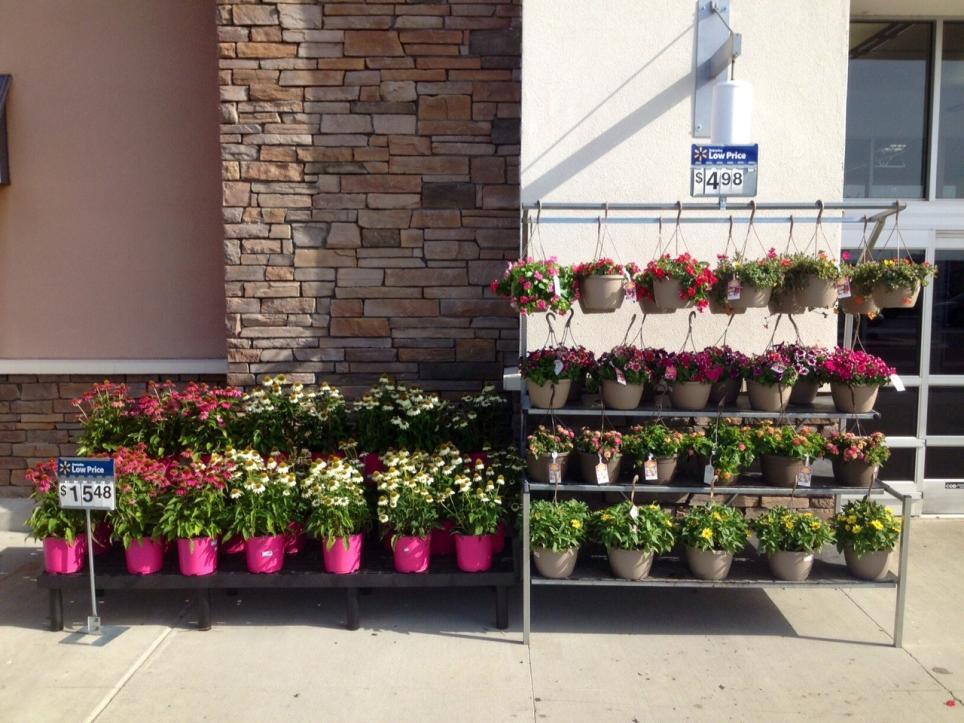
26 26 Do you prefer having a price sticker on every item in the garden center, a sticker on a tray of items, or a sign that tells you how much each item in a certain section costs? Price sticker on every item: Price sticker on a tray: Sign displaying the price:

27 27 Do you prefer having a price sticker on every item in the garden center, a sticker on a tray of items, or a sign that tells you how much each item in a certain section costs? 50% 40% 30% 20% 10% 0% 26% Price sticker on every item: 5% Price sticker on a tray: 12% Sign displaying the price: 41% Prefer to have ALL of them 17% Don't really care which one it is Insight: Over 80% of live goods consumers have an opinion on price tag location, and more than 40% prefer to have a sticker on each item and tray in addition to a sign importantly, whichever route stores decide upon they can NOT afford for prices to be difficult to locate. Action Item: Emphasize pricing display as a critical 2015 item with merchandising teams and implement pre-pricing whenever possible.
 70% 60% 50% 40% 30% 20% 10% 0% 57% Friends and family 36% Other people's garden 32% In Store (please list) 23% Magazines (please list) 13% 11% 11% Garden website (please list)")
28 28 Where do you go for inspiration on gardening? (select all that apply) 70% 60% 50% 40% 30% 20% 10% 0% 57% Friends and family 36% Other people's garden 32% In Store (please list) 23% Magazines (please list) 13% 11% 11% Garden website (please list) Retailer website (please list) Other (please specify) 4% Books (please list) Insight: There is still significant work to be done in-store as less than one third of consumers are finding inspiration for gardening where they shop. Action Item: Continue to push display development and in-store project ideas with retailers.


29 29 Trend When you walk into a garden center, do you typically: Insight: The vast majority of consumers continue to be browsers rather than entering the garden center with a plan set in stone. Critical to change out items so they are engaged during each visit. Action Item: Continue seasonal program emphasis diversifying product mixes.


30 30 How much time on average do you spend in a garden center per trip while shopping for plants? 55% Insight: More than half of consumers are spending less than 30 minutes in the garden center per trip while shopping for plants. Display execution and clear, direct signage are critical for catching these faster shoppers.
31 31 Trend When working in your garden what is the average length of time you spend in your garden? 40% 30% 25% 25% 31% 32% 36% 34% 20% 10% 0% 5% 2% 10 minutes 30 minutes One hour 1-3 hours More than 3 hours 6% 5% Insight: Over half of all consumers continue to spend an hour or less at a time in their garden.

: Doesn't matter to me")


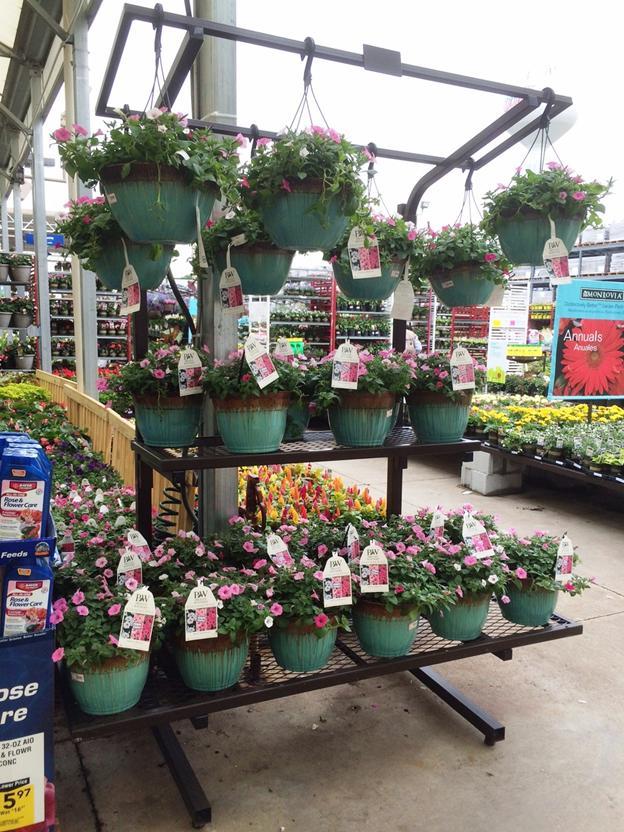
32 32 Which would you prefer to buy from? Pictures Shown to Panelists 50% 40% 30% 20% 46% 20% 33% 10% 0% A decorated display (showing how the item can be used): A plain display (simpler the better): Doesn't matter to me either way. If I like the item, I'll buy it from where I see it. Insight: While one-third of live goods consumers are ambivalent about their preference between a decorated and plain display, the percentage voting for decorated displays is more than twice that for plain.

33 Merchandising 33
34 34 Principles for In-Store Executions 1. Disrupt and Enhance the consumer shopping experience 2. Must be Operationally Efficient Low Time to Set for the Store Low cost to Implement for the store (use in-store materials) Low maintenance for the Store on a Daily Basis 3. Consumer can do the project at Home Easy to Understand, Easy to Execute 4. Project is scalable for the Consumer They can do a smaller version or larger version at Home if needed. 5. Staying Power For the Store Will it last and carry through for a full season (even with minor changes) 6. Take With can be displayed right by the project Should be easy to buy the items needed to execute 7. Fun and Simple for both the store and consumer 8. Drive Sales beyond the Base

35 35 By Age When working in your garden what is the average length of time you spend in your garden? 50% 40% 30% 20% 10% 0% 5% 4% 2% 2% 1% 1% 25% 39% 39% 37% 27% 32% 22% 22% 19% 30% 30% 25% 36% 16% 48% 44% 41% 25% 5% 8% 8% 3% 4% 4% 10 minutes 30 minutes One hour 1-3 hours More than 3 hours Total Over 60 Insight: Over 80% of consumers age spend an hour or less at a time in their garden. To engage this younger demographic stores should highlight simple projects that can be done in an hour or less.


36 36 Project Ideas Small Garden 51% of Consumers Prefer a small garden project 58% are more interested in Container Gardening


37 37 Family Tradition Family tradition is the entry point to gardening Put the GROW in Build and Grow Create content and guides that target children and family interaction Online and in store

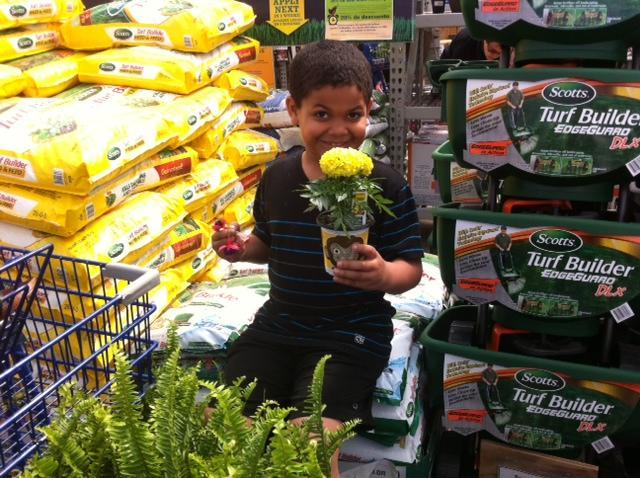
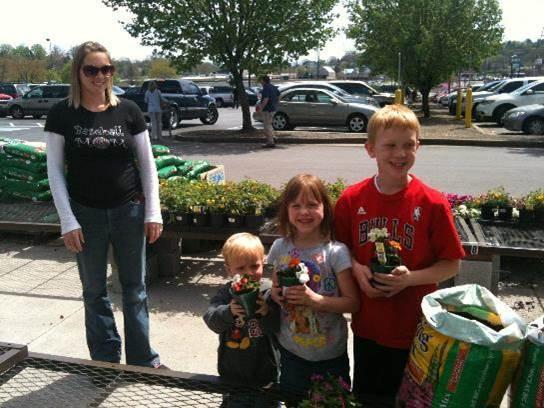


38 Let s Grow Kids Pots 38


39 39 Get Your Company Involved Collaborate Learn from each other Listen to all Ideas Test and Learn. Test and Learn. Test and Learn.