Orange County Housing Report: Seller Competition. April 9, Good morning!
|
|
|
- Ada Floyd
- 5 years ago
- Views:
Transcription


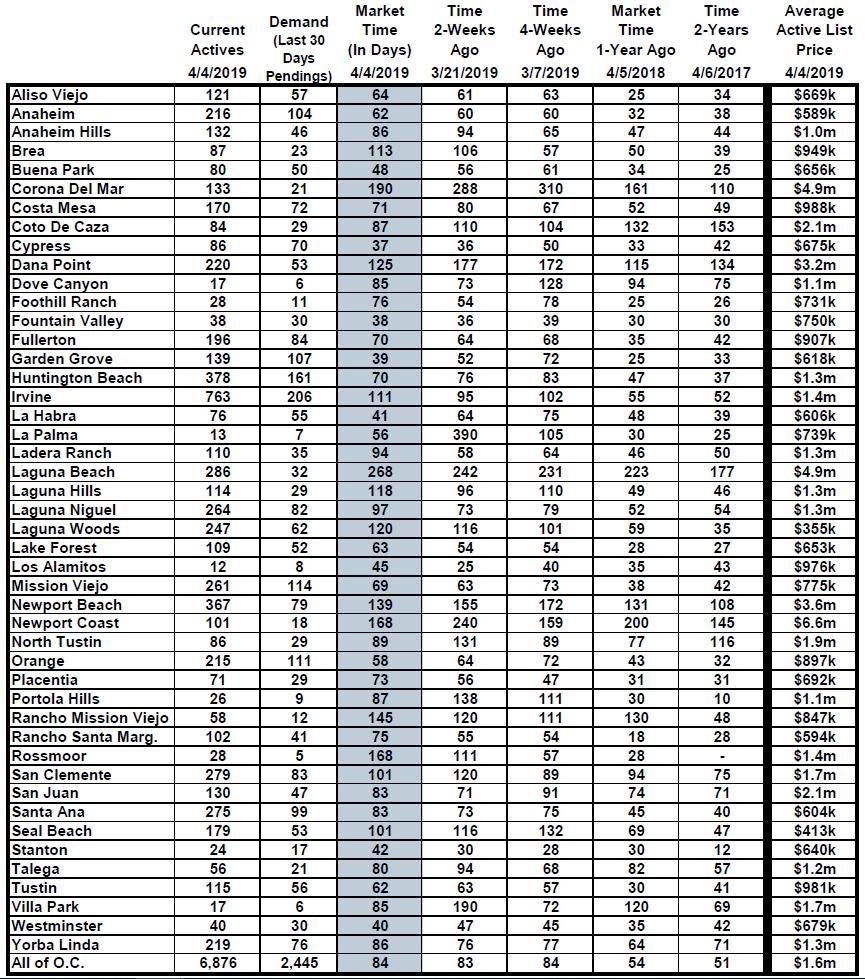
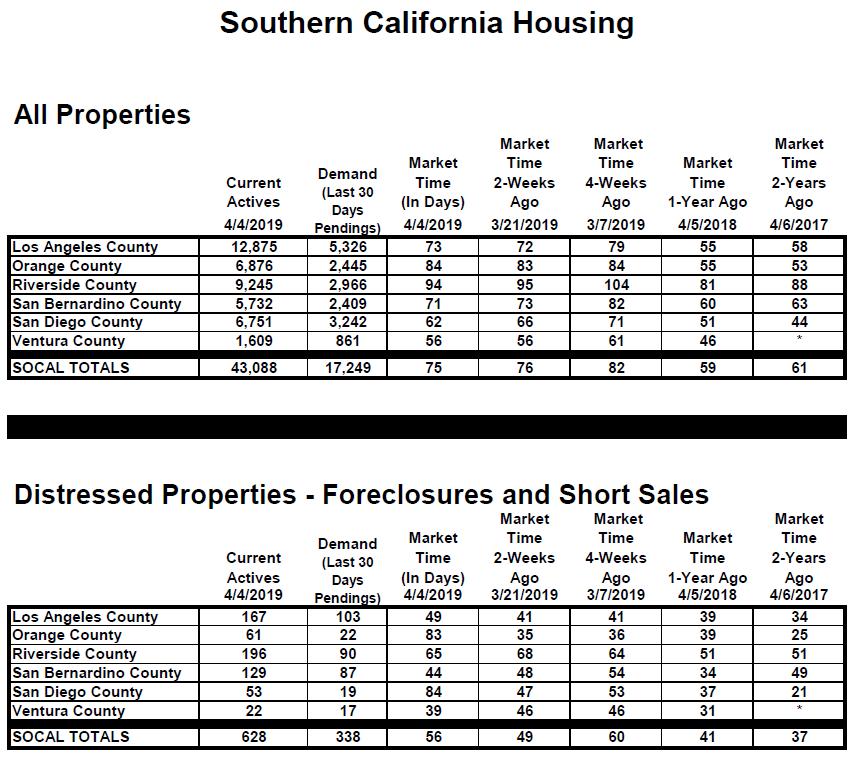
1 Orange County Housing Report: Seller Competition April 9, 2019 Good morning! This is the time of the year when more sellers come on the market than any other time of the year. More Seller Competition: The active listing inventory is rising. Isn t it beautiful? Southern California hills are spectacularly adorned in a blanket of bright orange California Poppies. The record rainfall resulted in a super bloom like nobody can remember. People are venturing outside to capture the incredible site, hiking and taking selfies along the way. Spring is definitely here! The record rainfall kept many homeowners from entering the fray and placing their homes on the market. Yet, the deluge of rain is now in the past. That was during the winter, but spring has arrived in housing as well and there is nothing keeping owners from pounding FOR SALE signs in their front yards. Like the blanket of California poppies, this is the time of the year when more FOR SALE signs blanket neighborhoods in Southern California and across the U.S. than any other time of the year. Nearly a third of all homes that are placed on the market during the year occur from April through June. There has already been an uptick in the number of homes coming on the market within the last couple of weeks. As a result, the active listing inventory in Orange County grew by 5%, adding an additional 344 homes. It now sits at 6,876 homes, its highest level since mid-november of Right now, it is the best time of the year to sell a home in terms of buyer demand. Demand is currently increasing as well, growing by 4% in the past two weeks. It will peak by mid-may. Yet, even with increasing demand, it does not mean that the market is getting hotter. In fact, what you see is what you get. The market will not improve any more than where it is today. This is due to the fact that while demand is rising, so is the active listing inventory. The inventory is rising slightly faster than demand. The added seller competition is offsetting any improvement in demand.

2 In looking at the Expected Market Time for Orange County (that is the number of days from coming on the market to opening escrow), it has dropped like a rock from the beginning of the year, transitioning from a slight Buyer s Market to a Balanced Market to a slight Seller s Market, where it stands today. It dropped from 152 days on January 10 th to 84 days today. For those sellers holding their collective breath in anticipation of a hot Spring, that is not going to occur. Instead, it will be a lukewarm housing market. The current Expected Market Time of 84 days is the highest level for this time of the year since Last year at this time it was a HOT Seller s Market and the Expected Market Time was at 54 days. The difference between a slight Seller s Market (between 60 to 90 days) and a hot Seller s Market (less than 60 days) is that the number of buyer showings has dropped, the number of multiple offer situations has dropped, home appreciation has stalled and is only slight rising, and open house activity has fallen. It is quite simply not as hot as prior years. Sellers still get to call the shots, but when the market does not move as quickly, home prices do not move as quickly as well. Sellers need to understand that the market is not going to get better. In fact, by mid-may it will start to slow. That is when demand starts to drop with all the distractions of graduation and summertime. The inventory continues to rise until peaking sometime in July to August. With slightly dropping demand and increasing seller competition in the form of a rising active listing inventory, the Expected Market Time will grow and the market will slow. The key for sellers is to realistically price their homes right now versus waiting down the road to get realistic when the market is slowing. Active Inventory: In the past couple of weeks, the active inventory increased by 5%. In the past two weeks, the active listing inventory increased by 344 homes, up 5%, and now totals 6,876, the largest two week increase since April of last year. This spike is not only because it is the Spring Market; it is also due to the torrential downpours now being in the past and warmer dryer weather ahead in the forecast. We can expect the inventory to continue to climb from here until it peaks sometime this summer between July and August. The inventory will most likely eclipse the 8,000 home level for the first time since 2014 and it may reach heights not seen since the start of 2012, surpassing 8,500 homes. Last year at this time there were 4,708 homes on the market. That means that there are 46% more homes available today. This is the highest level of homes on the market for this time of the year since 2011.

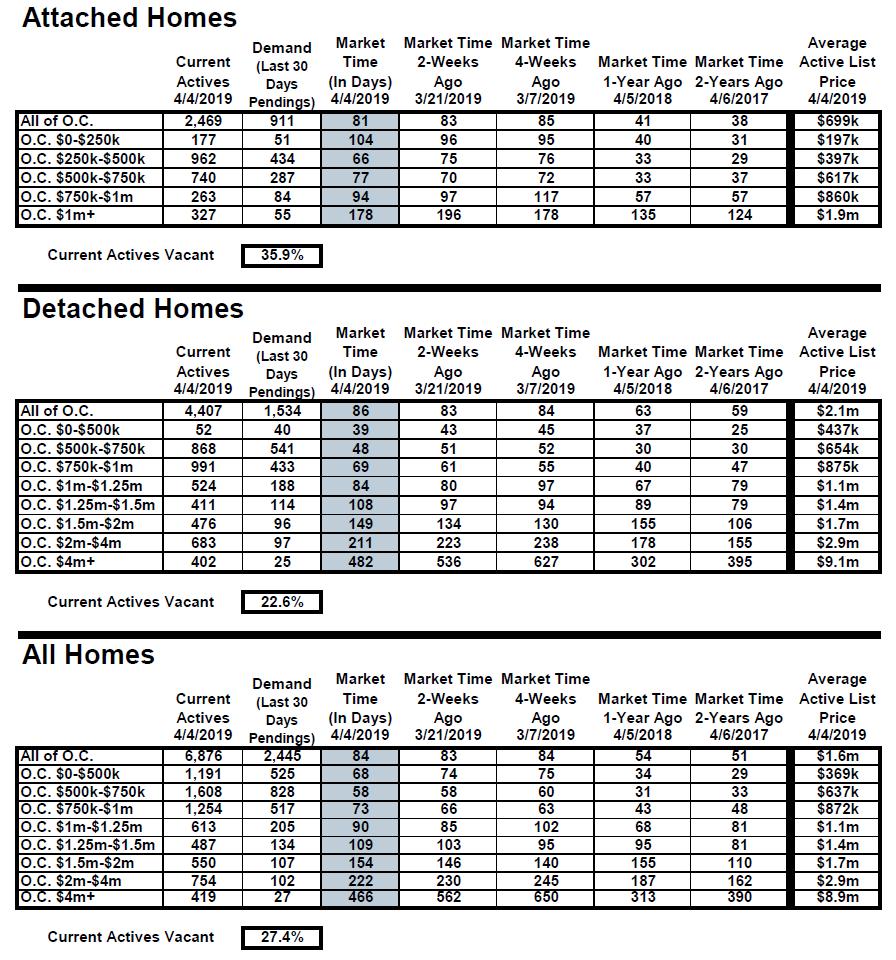
3 Demand: In the past couple of weeks, demand increased by 4%. Demand, the number of new pending sales over the prior month, continued to rise, increasing by 95 pending sales in the past two weeks, up 4%, and now totals 2,445. Demand is not growing as rapidly after soaring for the first two-and-a-half months of this year, coming off lows not seen since Demand also slows as it draws closer to its peak, sometime in May. From there, demand will slowly diminish through the rest of the Spring and Summer Markets. The retreat in interest rates this year has helped demand considerably. As a result, housing has evolved from a slight Buyer s Market to a slight Seller s Market, where it stands today. Part of why the market has not developed further to a hot Seller s Market is that there still is buyer apprehension in approaching housing. They are careful not to overpay and are looking to offer as close to a home s Fair Market Value as possible. They are not willing to stretch the asking price, which is why homes are currently not appreciating as fast as they have in prior years. Last year at this time, there were 157 additional pending sales, 6% more than today. Luxury End: The luxury inventory is climbing faster than luxury demand. In the past two-weeks, demand for homes above $1.25 million increased by 18 pending sales, a 5% increase, and now totals 370, its highest level since mid-june The increase in demand was offset by a spike in the luxury home inventory of 120, and now totals 2,210, a 6% increase. The overall expected market time for homes priced above $1.25 million increased from 178 days to 179 over the past two-weeks, a slight increase. Year over year, luxury demand is up by 17 pending sales, or 5%, and the active luxury listing inventory is up by an additional 351 homes, or 19%. There is a lot more seller competition so far this year compared to The expected market time last year was at 158 days, better than today. For homes priced between $1.25 million and $1.5 million, in the past two-weeks, the expected market time increased from 103 to 109 days. For homes priced between $1.5 million and $2 million, the expected market time increased from 146 to 154 days. For homes priced between $2 million and $4 million, the expected market time decreased from 233 to 222 days. For homes priced above $4 million, the expected market time decreased from 562 to 466 days. At 466 days, a seller would be looking at placing their home into escrow around July of Orange County Housing Market Summary: The active listing inventory increased by 344 homes in the past two weeks, up 5%, and now totals 6,876. Last year, there were 4,708 homes on the market, 2,168 fewer than today. There are 46% more homes than last year. So far this year, 3% fewer homes came on the market below $500,000 compared to 2018, and there were 15% fewer closed sales. Fewer and fewer homes and condominiums are now priced below $500,000. This price range is continuing to vanish. Demand, the number of pending sales over the prior month, increased by 95 pending sales in the past twoweeks, up 4%, and now totals 2,445, its lowest level for this time of the year since Last year, there were 2,602 pending sales, 6% more than today. The Expected Market Time for all of Orange County increased from 83 days two weeks ago to 84 days today, a slight Seller s Market (between 60 to 90 days) and the highest level for this time of the year since It was at 54 days last year.
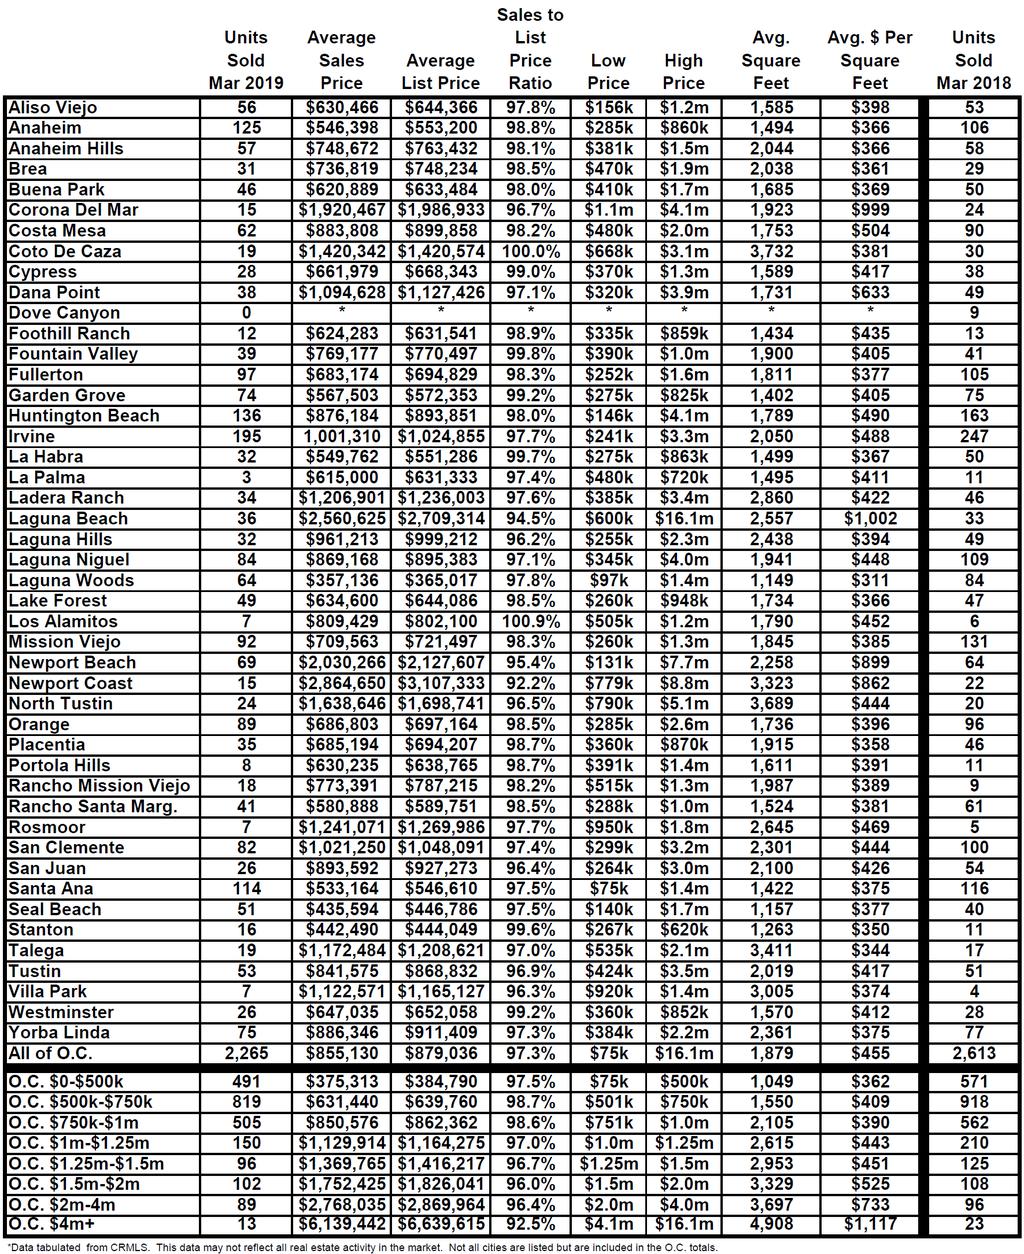
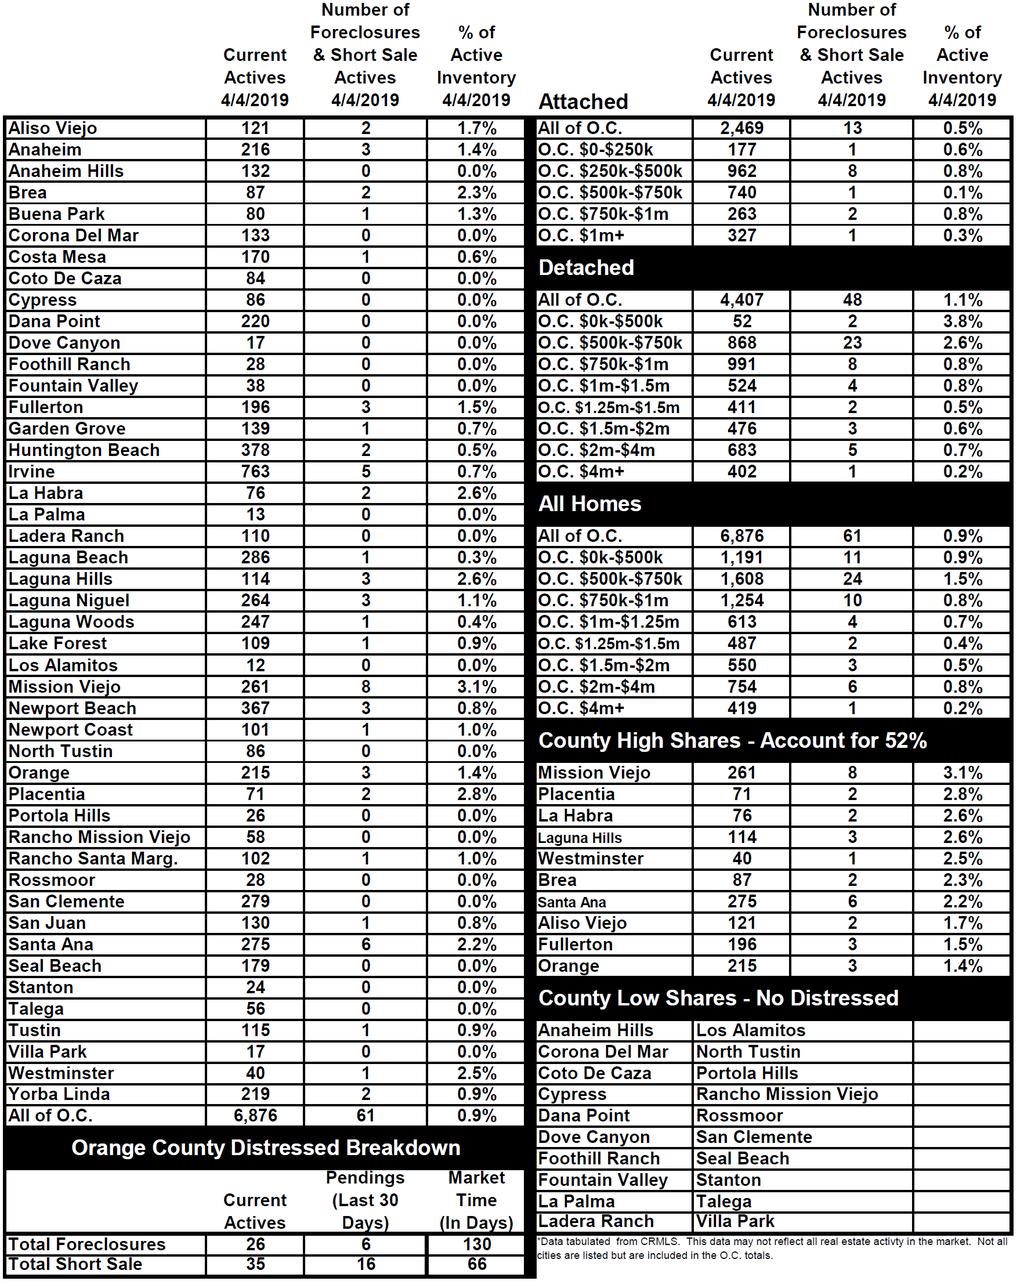
4 For homes priced below $750,000, the market is a slight Seller s Market (between 60 and 90 days) with an expected market time of 62 days. This range represents 41% of the active inventory and 55% of demand. For homes priced between $750,000 and $1 million, the expected market time is 73 days, a slight Seller s Market. This range represents 18% of the active inventory and 21% of demand. For homes priced between $1 million to $1.25 million, the expected market time is 90 days, a slight Seller s Market. For luxury homes priced between $1.25 million and $1.5 million, in the past two weeks, the expected market time increased from 103 to 109 days. For homes priced between $1.5 million and $2 million, the expected market time increased from 146 to 154 days. For luxury homes priced between $2 million and $4 million, the expected market time decreased from 230 to 222 days. For luxury homes priced above $4 million, the expected market time decreased from 562 to 466 days. The luxury end, all homes above $1.25 million, accounts for 32% of the inventory and only 16% of demand. Distressed homes, both short sales and foreclosures combined, made up only 0.8% of all listings and 1.8% of demand. There are only 19 foreclosures and 30 short sales available to purchase today in all of Orange County, 49 total distressed homes on the active market, down two from two-weeks ago. Last year there were 39 total distressed homes on the market, slightly less than today. There were 2,265 closed residential resales in March, 13% fewer than March 2018 s 2,613 closed sales. March marked a 47% increase from February The sales to list price ratio was 97.3% for all of Orange County. Foreclosures accounted for just 0.4% of all closed sales, and short sales accounted for 0.5%. That means that 99.1% of all sales were good ol fashioned sellers with equity. Cheers Fred
5
6
7
8
9
Orange County Housing Report: A Different Start. January 14, Good morning!
 Orange County Housing Report: A Different Start January 14, 2019 Good morning! The start to 2019 is unlike the last 6-years, paving the way for a much different year. The 2019 Start: There are a lot more
Orange County Housing Report: Starting to Pull Back. June 3, Good morning!
 Orange County Housing Report: Starting to Pull Back June 3, 2018 Good morning! In the tug-of-war between buyers and sellers, buyers are beginning to pull back. Tug-of-War: There is a noticeable shift in
Orange County Housing Report
 Orange County Housing Report A MARKET CHANGE May 20, 2018 Housing is starting to transition into the Summer Market with a lot more FOR SALE signs and Open House directional arrows. The Summer Market: The
Orange County Housing Report: A Different Start. January 13, Good morning!
 Orange County Housing Report: A Different Start January 13, 2019 Good morning! The start to 2019 is unlike the last 6-years, paving the way for a much different year. The 2019 Start: There are a lot more
Orange County Housing Report: The Holiday Chill. December 2, Good morning!
 Orange County Housing Report: The Holiday Chill December 2, 2018 Good morning! Now that the Holiday Market is here, housing shifts to its slowest time of the year. Holiday Market: The slowest time of the
Orange County Housing Report: More Seller Competition. April 9, Good Afternoon!
 Orange County Housing Report: More Seller Competition April 9, 2017 Good Afternoon! A wave of homeowners are finally coming on the market and the active inventory is on the rise. Active Inventory More
Orange County Housing Report: Oktober-Housingfest Cancelled. October 7, Good morning!
 Orange County Housing Report: Oktober-Housingfest Cancelled October 7, 2018 Good morning! The momentum of the housing market has paved the way for cooler Autumn and Holiday Markets. No End of Year Surge:
Orange County Housing Report: Still a Hot Seller s Market. December 17, Good Afternoon!
 Orange County Housing Report: Still a Hot Seller s Market December 17, 2017 Good Afternoon! It is the middle of December and the market is sizzling hot for all homes priced below $1 million. Hot Housing
Greater Metro Denver Update May Megan Aller Account Manager
 Greater Metro Denver Update May 2016 Megan Aller Account Manager MAller@ltgc.com 720-243-2221 Areas of Analysis THE REQUIRED STUFF Reporting on the 7 Metro Denver Counties: Adams, Arapahoe, Broomfield,
Greater Metro Denver Update August Amy Brawand Account Manager
 Greater Metro Denver Update August 2016 Amy Brawand Account Manager Abrawand@ltgc.com 303-877-8886 Areas of Analysis THE REQUIRED STUFF Reporting on the 7 Metro Denver Counties: Adams, Arapahoe, Broomfield,
DATA FOR OCTOBER Published November 16, Sales are up +4.1% month-over-month. The year-over-year comparison is down -1.2%.
 Permission is granted only to ARMLS Subscribers for reproduction with attribution on to ARMLS COPYRIGHT 2018. For questions regarding this publication contact Brand@ARMLS.com. DATA FOR OCTOBER 2018 - Published
HOUSING REPORT WASHTENAW AUGUST 2018
 WASHTENAW AUGUST 2018 Washtenaw County Is the Market Shifting? Increasing Numbers of Price Reductions Over the past few months, there has been an increasing number of listings with price reductions. In
THE TEAM BEHIND THE DATA
 PRESENTED BY THE TEAM BEHIND THE DATA OVERVIEW Of all the exciting developments in 2015, perhaps the most exciting was how engaged consumers and market players were in trying to decide whether the market
Presentable Market Data. Chuck Carr 2317 Briarleigh Way Dunwoody, GA Office: Cell:
 Presentable Market Data Chuck Carr 2317 Briarleigh Way Dunwoody, GA 30338 Office: 770-698-8797 Cell: 678-591-6030 Email: ChartmasterChuck@aol.com Metro Areas Included 36 FMLS Areas Keller Williams Realty
DATA FOR MARCH Published April 23, Sales are up +36.0% month-over-month. The year-over-year comparison is up +3.1%. ARMLS STAT MARCH 2018
 Permission is granted only to ARMLS Subscribers for reproduction with attribution on to ARMLS COPYRIGHT 2018. For questions regarding this publication contact Brand@ARMLS.com. DATA FOR MARCH 2018 - Published
Analysis & Comments. Livestock Marketing Information Center State Extension Services in Cooperation with USDA. National Hay Situation and Outlook
 Analysis & Comments Livestock Marketing Information Center State Extension Services in Cooperation with USDA April 2, 2015 Letter #12 www.lmic.info National Hay Situation and Outlook The 2014 calendar
Forecasting Techniques. 5/17/2008 Cromford Associates LLC Mike Orr
 Forecasting Techniques 5/17/2008 Cromford Associates LLC Mike Orr Introduction It is true that no-one can predict with certainty what will happen in the future. However real estate is a cyclical market
Hog Producers Near the End of Losses
 Hog Producers Near the End of Losses January 2003 Chris Hurt Last year was another tough one for many hog producers unless they had contracts that kept the prices they received much above the average spot
Southeast Michigan Housing Report
 Southeast Michigan Housing Report As we head towards the end of summer we have seen an increase in listings across all market areas, while new pending sales took a slight dip. This has caused the month
NYMEX UPDATE BULLS & BEARS REPORT
 June 30, 2016 NYMEX UPDATE BULLS & BEARS REPORT Author MATTHEW MATTINGLY Energy Analyst / Louisville Ph: 502-895-7882 Author JASON SCARBROUGH VP Risk Management / Houston Ph: 713-899-3639 INTRODUCTION
Presentable Market Data
 Presentable Market Data Chuck Carr 2317 Briarleigh Way Dunwoody, GA 30338 Office: 770-698-8797 Cell: 678-591-6030 Email: ChartMasterChuck@aol.com www.chartmasterservices.com Current Market Overview Understanding
Coachella Valley Median Detached Home Price Mar Mar 2017
 Median Price $450,000 $400,000 Coachella Valley Median Detached Home Price Mar 2002 - Mar 2017 $335,000 $366,285 $350,000 $300,000 $250,000 $200,000 $150,000 CV Detached Median Price 4% growth curve Summary
October 1, 1996 Ames, Iowa Econ. Info. 1703
 October 1, 1996 Ames, Iowa Econ. Info. 1703 PROFITABLE HOG PRICE EXPECTED THROUGH MID-1997 The USDA September Hogs & Pigs report released September 27 indicated 4 percent fewer total hogs on U.S. farms
HOG INDUSTRY NEEDS MORE DOWNSIZING IN 2004
 HOG INDUSTRY NEEDS MORE DOWNSIZING IN 2004 JANUARY 2004 Chris Hurt 2004 NO. 1 Summary Rising costs of production and continued nearrecord pork production will keep producer margins near breakeven in 2004.
ARIZONA HOUSING MID-YEAR. State of the Market Q1 Q2 Q3 Q4 Q1 Q2 Q3 Q4
 The housing market in Arizona started recovering off its lows in early 2012, as investors took advantage of eroded prices and distressed properties. As the market has recovered, prices have begun to rise
California forest fires
 California forest fires Why in news? California is suffering the aftermath of a most devastating wildfire in its history recently. What are the reasons? Forest fires have been getting worse in California
December 2015 Remodeling Business Pulse Tracking Remodeling Conditions & Outlook. Conducted by:
 December 2015 Remodeling Business Pulse Tracking Remodeling Conditions & Outlook Conducted by: Table of Contents Page Research Objectives & Strategies 3 Questionnaire Outline 4 Methodology 5 Executive
White Paper. Clothing Playbook. Making a success of your clothing season
 White Paper Clothing Playbook Making a success of your clothing season Table of Contents Table of Contents... 2 Run a Clothing Playbook... 3 Creating sales momentum in the season... 5 Stars and Dogs...
Todd Blair, Realtor Nobody Will Work Harder To Get The Deal DONE!! Todd Blair, Realtor Office (561)
") Todd Blair, Realtor Nobody Will Work Harder To Get The Deal DONE!! Todd Blair, Realtor Office (561) 627-5100 www.pbcoastal.com Listing Consultation 1 2 3 4 5 6 7 8 Who I Am Key Questions Tour Home Better
Todd Blair, Realtor Nobody Will Work Harder To Get The Deal DONE!! Todd Blair, Realtor Office (561) 627-5100 www.pbcoastal.com Listing Consultation 1 2 3 4 5 6 7 8 Who I Am Key Questions Tour Home Better
Quarterly Energy Comment
 Quarterly Energy Comment By Bill O Grady December 15, 2017 The Market Oil prices have recovered strongly from the mid-summer lows. It appears we are establishing a new trading range between $55 and $60
Monthly Bulletin January 2014
 Monthly Bulletin January 2014 Page 2 of 12 Executive Summary Butadiene: The US butadiene contract price marker posted by IHS Chemical increased 1 cent per pound to 55.4 cents per pound ($1,221 per ton)
Water Supply FAQ August 11, 2015
 Water Supply FAQ August 11, 2015 1) What s the latest information on water supply? After the driest May-July on record, and in preparation of a potentially drier-than-normal fall, Tacoma, along with Everett
Iowa Farm Outlook. December 15, 2004 Ames, Iowa Econ. Info. 1900
 Iowa Farm Outlook December 15, 24 Ames, Iowa Econ. Info. 19 Beef and Pork Price Relationships Historically, beef and pork prices have moved somewhat together. They are substitutes in the consumer s shopping
The McCully Report December 5, 2014
 The McCully Report December 5, 2014 DAIRY MARKETS KEY DRIVERS Feed Prices and Farm Margins: After a long harvest, record corn and soybean crops are largely in the bin. However, despite the large crops,
CORN: FIVE CONSECUTIVE LARGE CROPS?
 CORN: FIVE CONSECUTIVE LARGE CROPS? JULY 2000 Darrel Good Summary The USDA s June Acreage Report revealed that U.S. producers had planted nearly 79.6 million acres of corn in 2000, up from 77.4 million
SOYBEANS: AN EARLY WEATHER MARKET
 SOYBEANS: AN EARLY WEATHER MARKET January 2000 Darrel Good Summary 1999 U.S. Crop Estimate Revised Lower Soybean prices have made a modest rally from the mid-december lows, fueled by areas of dry weather
Hog Producers Show Little Sign of Retreat
 Hog Producers Show Little Sign of Retreat April 2007 Chris Hurt 2007-No2 Hog producers reported they are continuing to increase the size of the breeding herd by one percent in the latest USDA update. This
HOG PRODUCERS SHOW LITTLE SIGN OF RETREAT
 HOG PRODUCERS SHOW LITTLE SIGN OF RETREAT APRIL 2007 Chris Hurt 2007 NO. 2 Hog producers reported in the latest USDA update that they increased the size of the breeding herd by 1 percent. This means pork
Good news from China China returns to fertilizer market as a seller, increasing supplies By Bryce Knorr, grain market analyst
 Good news from China China returns to fertilizer market as a seller, increasing supplies By Bryce Knorr, grain market analyst Farmers have heard mostly bearish news about China in the second half of 2018.
2010 and Preliminary 2011 U.S. Organic Cotton Production & Marketing Trends
 2010 and Preliminary 2011 U.S. Organic Cotton Production & Marketing Trends Produced by the Organic Trade Association January 2012 Background In December 2011, the Organic Trade Association (OTA) identified
AGRI-News. Magnusson Consulting Group. Agricultural Outlook Long Term Outlook Brazil Soybean Planting Larger Acres - Larger Crop
 AGRI-News Magnusson Consulting Group Volume 1, Issue 3 Nov 2018 Brazil Soybean Planting Larger Acres - Larger Crop In 2018, Brazil became the largest soybean producer in the world surpassing the United
DATA FOR DECEMBER Published January 18, Sales are down -1.7% month-over-month. The year-over-year comparison is down -9.4%.
 Permission is granted only to ARMLS Subscribers for reproduction with attribution on to ARMLS COPYRIGHT 2019. For questions regarding this publication contact Brand@ARMLS.com. DATA FOR DECEMBER 2018 -
June 2015 Remodeling Business Pulse Tracking Remodeling Conditions & Outlook. Conducted by:
 June 2015 Remodeling Business Pulse Tracking Remodeling Conditions & Outlook Conducted by: Table of Contents Page Research Objectives & Strategies 3 Questionnaire Outline 4 Methodology 5 Executive Summary
How To Figure Out What a House Should Sell For
 How To Figure Out What a House Should Sell For How We Decided The Price of Our Last 5,000 Listings Notes from the class given by Russell Shaw on June 20, 2014. In the private Facebook group Arizona Real
Iowa Farm Outlook. June 1, 2003 Ames, Iowa Econ. Info BSE in Canada
 Iowa Farm Outlook June 1, 2003 Ames, Iowa Econ. Info. 1864 BSE in Canada The big news in the cattle market this week and perhaps for the year was the discovery of BSE, commonly called Mad Cow Disease,
Presented by: Mike Sims REALTOR ERA Courtyard Real Estate
 Presented by: Mike Sims REALTOR 254-723-8112 Mike.sims@era.com www.mikesimswaco.com Contents 214-215 McLennan County 3 McLennan County by Bedrooms 4 McLennan County Price by Bedroom 5 Cities 6 Axtell 6
CORN: HIGHER PRICES COMES EARLY
 CORN: HIGHER PRICES COMES EARLY OCTOBER 2006 Darrel Good 2006 NO. 7 Summary The 2006 U.S. corn crop is expected to be the third largest ever, but it is small in relation to expected consumption during
NYMEX - Annual Strips
 Weekly Summary: The U.S. Energy Information Administration reported that natural gas storage fell by 48 billion cubic feet this week, higher than the expected reduction of 39 Bcf but considerably lower
Early drought prospects 2007
 www.environment-agency.gov.uk/drought Early drought prospects 2007 November 2006 Early drought prospects for 2007 Contents Summary 2 1 Introduction 3 2 Water resources October 2006 4 2.1 Rainfall 4 2.2
U.S. Dairy Products, Cash Receipts
 Statement of Dr. Scott Brown Before the U.S. House of Representatives Committee on Agriculture Rural Economic Outlook: Setting the Stage for the Next Farm Bill February 15, 2017 Chairman Conaway, Ranking
The Market Watch Monthly Housing Report
 Price per sq. ft. $260 CV median price per sq. ft. 2002 - Jan 2016 $240 $220 $200 $180 $160 $140 $180.00 $177.32 $120 $100 Median Price per Sq. Ft. 3.5% Growth Curve Summary We have decided to alternate
INFORMATION FROM CAUSEWAY RESORT FRONT OFFICE
 Summer 2013 INFORMATION FROM CAUSEWAY RESORT FRONT OFFICE A. Bonus Week Rentals for the remainder of 2013 The $400 per week rentals to Causeway owners continues in the fall starting in week 40 and running
Rice Outlook and Baseline Projections. University of Arkansas Webinar Series February 13, 2015 Nathan Childs, Economic Research Service, USDA
 Rice Outlook and Baseline Projections University of Arkansas Webinar Series February 13, 2015 Nathan Childs, Economic Research Service, USDA THE GLOBAL RICE MARKET PART 1 The 2014/15 Global Rice Market:
Getting the Most. for Your Asset Management Money with Lifecycle Costing
 Getting the Most for Your Asset Management Money with Lifecycle Costing By Shayne C. Kavanagh The acquisition cost of an asset is just a portion of the total cost of owning it. Ongoing maintenance significantly
Hay being cut last week was more of a clipping or hay that either needs to be taken off due to weeds or because. Ellensburg Division - PNW
 Vol. 7 No. 1-2014 May Spring Edition Ellensburg Division - PNW Hay being cut last week was more of a clipping or hay that either needs to be taken off due to weeds or because the field is planted to timothy.
AGRI-News. Magnusson Consulting Group. In this issue: Canadian Wheat Update. Smaller Supplies to Limit Brazil s 2018/19 Soybean Exports
 AGRI-News Magnusson Consulting Group Volume 2, Issue 3 March 2019 Smaller Supplies to Limit Brazil s 2018/19 Soybean Exports Record soybean exports in 2017/18, coupled with a reduction in the 2018/19 harvest,
SELL YOUR HOME FASTER Stephy Lim
 1 0 T I P S T O H E L P Y O U T O SELL YOUR HOME FASTER Stephy Lim If you ve ever been in a situation where you need to sell a house fast, you know how frustrating it can be. Everyday, you WHAT PROBLEM
October 9, Aeropostale: Growth at a Reasonable Price
 Aeropostale: Growth at a Reasonable Price By: Andrew Schneck Copyright 2010 I recently wrote about a report about another specialty retailer, The Buckle, Inc. I want it to be understood that I am not favoring
Illinois in Drought. June 19, 2012, Updated June 21, 2012
 June 19,, Updated June 21, Illinois in Drought The ISWS now considers central and southern Illinois to be fully in drought based on several impacts including the early season onset of reservoir drawdown
UNDERSTANDING NATURAL GAS MARKETS. Mohammad Naserifard MSc student of Oil & Gas Economics at PUT Fall 2015
 UNDERSTANDING NATURAL GAS MARKETS Mohammad Naserifard MSc student of Oil & Gas Economics at PUT Fall 2015 Table of Contents 3 Overview Natural Gas is an Important Source of Energy for the United States.
Agricultural. Credit Conditions. Farmland Values Rise with Crop Prices. SURVEY of TENTH DISTRICT
 SURVEY of TENTH DISTRICT Agricultural Credit Conditions S1 es tp Q t eu ma rb teerr 2 1 FF ee dd ee rraall RReesseerrvvee BBa annk k o of f KKa an ns sa as s C Ci ti ty y Farmland Values Rise with Crop
Weather has always been a hot topic of conversation. We talk about whether it is hot or cold, windy or calm, snowy or dry. We listen to the radio to
 Weather has always been a hot topic of conversation. We talk about whether it is hot or cold, windy or calm, snowy or dry. We listen to the radio to figure out if the weather will be different tomorrow.
Agricultural Outlook Forum 2004 Presented Friday, February 20, 2004
 Agricultural Outlook Forum 2004 Presented Friday, February 20, 2004 FOOD PROCESSING CONTRACTS Path To Maintain United States Competitiveness Douglas R. Circle President/CEO Circle Farms, Inc. & Frozsun
Water Usage & Drought in Austin
 Water Usage & Drought in Austin Meghan Bock CE 394K GIS in Water Resources December 2, 2016 Introduction The City of Austin is no stranger to the impacts of drought on municipal water supply and demand.
ENERGY MARKET UPDATE October 9, 2014
 ENERGY MARKET UPDATE October 9, 2014 Winter is Right Around the Corner Are You Ready? Six months ago one of the most brutal winters on record in the US was winding down. Many energy consumers, who had
Hog:Corn Ratio What can we learn from the old school?
 October 16, 2006 Ames, Iowa Econ. Info. 1944 Hog:Corn Ratio What can we learn from the old school? Economists have studied the hog to corn ratio for over 100 years. This ratio is simply the live hog price
The trajectory may have flattened because how much more can it rise?
 Existing Home Sales Brokers: As Prices Continue to Escalate, Fissures Form for Home Resales in October Similar Story Almost Everywhere: Unit Sales Drop as Average Sales Prices Rise Strong Dollar, High
Ending stocks can adjust due to a variety of factors from changes in production as well as adjustments to beginning stocks and demand.
 1 2 3 Wire services such as Reuters and Bloomberg offer a survey of analysts expectations for high-profile USDA reports. These surveys hold interest because they help clarify what constitutes a shock or
A Profile of Cattle Feeding: Beyond the Averages
 A Profile of Cattle Feeding: Beyond the Averages Anna Stehle, Former Graduate Research Assistant; Oklahoma State University. Derrell S. Peel Breedlove Professor of Agribusiness and Livestock Marketing
The Market Watch Monthly Desert Housing Report April CV median price per sq. ft April 2015
 CV median price per sq. ft. 2002 - Price per sq. ft. $240 $220 $200 $180 $160 $140 $120 $100 $176.06 $183.35 Median Price per Sq. Ft. 3.5% Growth Curve Summary The median price per sq. ft. in the Valley
EXECUTIVE SUMMARY EXECUTIVE SUMMARY
 FARMREPORT 2014 EXECUTIVE SUMMARY The price of farmland in most Canadian markets has either held steady or increased this year, following a period of strong year-over-year growth. Mirroring the trend in
CATTLE MAY HAVE A DECENT, BUT VOLATILE YEAR
 CATTLE MAY HAVE A DECENT, BUT VOLATILE YEAR FEBRUARY 2004 Chris Hurt 2004 NO. 2 Summary Early indications are that 2004 will not be as difficult for the cattle industry as many producers had feared in
Cattle Inventory Increases; Impact of Tariffs Hangs Over Markets By James Mintert, Director, Purdue Center for Commercial Agriculture
 July 2018 Cattle Inventory Increases; Impact of Tariffs Hangs Over Markets By James Mintert, Director, Purdue Center for Commercial Agriculture USDA released a flurry of reports last week, including the
Instagram Ads: The Rise of Video
 Instagram Ads: The Rise of Video A Look at Q1 2016 Performance Across Industries 1 Instagram Ads: The Rise of Video Executive Summary: A Word from Our CEO... Nine Month Retrospective: Advertising Growth
TIMELY INFORMATION. Agriculture & Natural Resources AGRICULTURAL ECONOMICS AND RURAL SOCIOLOGY, AUBURN UNIVERSITY, AL
 AG ECONOMIC SERIES TIMELY INFORMATION Agriculture & Natural Resources AGRICULTURAL ECONOMICS AND RURAL SOCIOLOGY, AUBURN UNIVERSITY, AL 36849-5639 DAERS 08-5 September 2008 U. S. Beef Cattle Situation
MYTHS ABOUT REAL ESTATE.
 MYTHS ABOUT REAL ESTATE. Real People Real Service Real Estate HENZELLS GUIDE TO SELLING YOUR HOME. Selling your home is not rocket science, but it also doesn t need to be as hard as some people make it
Choosing Wrong: Consider The Reason You Want a Spa - Therapy vs Relaxation vs Entertainment
 You ve peeked in the windows, studied the magazines and maybe even visited a local spa dealership or two to see firsthand just how amazing a modern spa can look and feel. But before pulling out your wallet,
HOUSING REPORT WASHTENAW 3RD QUARTER 2018
 WASHTENAW 3RD QUARTER 2018 Consumer Market Perception Is now a good time to buy a home? Is now a good time to sell? Although real estate markets go through cycles, there will always be people who need
LAGGING EXPORTS SLIGHTLY NEGATIVE TO CORN PRICES
 November 5, 2001 Ames, Iowa Econ. Info. 1825 LAGGING EXPORTS SLIGHTLY NEGATIVE TO CORN PRICES While current utilization projections show record corn use for the year ahead, the slow start for corn export
CROP REPORT. USDA National Agriculture Summary Corn & Soybeans ISSUE 2: JULY, 2016
 ISSUE 2: JULY, 2016 TM CROP REPORT USDA National Agriculture Summary Corn & Soybeans Corn: By June 26, silking was estimated at 6 percent complete, 3 percentage points ahead of last year and slightly ahead
Stock Number Survey as at 30 June 2017
 Contents Stock as at 30 June 017 Executive Summary Breeding ewes -1.9% Hoggets +1.7% sheep -0.9% Ewe condition Scanning Lamb crop +1.1% Beef cattle +.8% Introduction Livestock numbers as at 30 June 017
Industry projections 2018 Australian sheep May update
 Industry projections Australian sheep May update KEY POINTS Lamb and mutton slaughter outlook revised higher due to dry conditions Strong international demand is helping to support prices despite increased
Issue Establishing commodity prices and authorizing sale of crops grown at the Twenty Mile South Farm (TMSF).
.") Date: February 15, 2017 To: Public Works Commission From: Ben Nydegger, Biosolids Manager Subject: Minimum Commodity Price List, 2017 Issue Establishing commodity prices and authorizing sale of crops grown
Date: February 15, 2017 To: Public Works Commission From: Ben Nydegger, Biosolids Manager Subject: Minimum Commodity Price List, 2017 Issue Establishing commodity prices and authorizing sale of crops grown
Lagoon Management through the Water Year. Doug Hamilton Waste Management Specialist Oklahoma Cooperative Extension Service
 Lagoon Management through the Water Year Doug Hamilton Waste Management Specialist Oklahoma Cooperative Extension Service Lagoons are used for storage and treatment on most Oklahoma hog farms because they
SUPPLY AND DEMAND Macroeconomics in Context (Goodwin, et al.)
") Chapter 4 SUPPLY AND DEMAND Macroeconomics in Context (Goodwin, et al.) Chapter Overview In this chapter, you ll find the basics of supply and demand analysis. As you work through this chapter, you will
Chapter 4 SUPPLY AND DEMAND Macroeconomics in Context (Goodwin, et al.) Chapter Overview In this chapter, you ll find the basics of supply and demand analysis. As you work through this chapter, you will
STAFDA. March 2016 Economic Report
 STAFDA March 216 Economic Report Table of Contents Economic Overview 1 Terminology & Methodology.. 2 Business Cycle 3 US Industrial Production Index 4 Canada Industrial Production Index 5 US Consumer Price
CORN: CROP PROSPECTS TO DOMINATE PRICES
 CORN: CROP PROSPECTS TO DOMINATE PRICES JULY 2002 Darrel Good 2002 NO. 5 Summary The USDA s June Grain Stocks report confirmed a rapid rate of domestic corn consumption during the third quarter of the
2007 U.S CORN PRODUCTION RISKS: WHAT DOES HISTORY TEACH US? Darrel Good and Scott Irwin May 17, 2007 MOBR 07-01
 2007 U.S CORN PRODUCTION RISKS: WHAT DOES HISTORY TEACH US? Darrel Good and Scott Irwin May 17, 2007 MOBR 07-01 INTRODUCTION From May to October each year, the corn market typically finds direction from
HOG PROFITS NARROW AS CORN PRICE RISKS RISE
 HOG PROFITS NARROW AS CORN PRICE RISKS RISE APRIL 2006 Chris Hurt 2006 NO. 3 After two years of notable profits, hog producers have started to worry about eroding hog prices and rising risk of higher corn
JUNE 2002 HOGS AND PIGS SUMMARY AND ANALYSIS
 July 1, 2002 Ames, Iowa Econ. Info. 1841 Dear Readers: The Iowa Farm Outlook lost an important "silent partner". For the past 10 years Marci Cox made sure our information was readable, the graphs and tables
USDA HOGS AND PIGS REPORT CONFIRMS LIQUIDATION
 October 4, 1999 Ames, Iowa Econ. Info. 1774 USDA HOGS AND PIGS REPORT CONFIRMS LIQUIDATION The September USDA Hogs and Pigs Report estimated all hogs and pigs on farms in the U.S. at 60.7 million head.
Iowa Farm Outlook. July 31, 2006 Ames, Iowa Econ. Info Midyear Cattle Inventory Report
 Iowa Farm Outlook July 31, 2006 Ames, Iowa Econ. Info. 1939 Overview Midyear Cattle Inventory Report USDA released two reports estimating July 1, 2006 cattle inventories; the midyear Cattle report and
Coyote Creek Flood Preliminary After Action Report. March 9, 2017
 Coyote Creek Flood Preliminary After Action Report March 9, 2017 I. What Happened Lower spillway waterfall at Anderson Reservoir Feb. 18: Anderson Reservoir reached capacity for the first time since 2006
Harnessing Los Angeles s 5,000 megawatt solar roof potential for sustainable economic growth
 Harnessing Los Angeles s 5,000 megawatt solar roof potential for sustainable economic growth UCLA Smart & Sustainable Cities Conference Mary Leslie, Los Angeles Business Council California s Statewide
Global Price and Production Forecast
 Global Price and Production Forecast Ron Plain Professor of Ag Economics, University of Missouri-Columbia, 220 Mumford Hall, Columbia, MO 65211 USA; Email: plainr@missouri.edu Introduction Last year, 2008,
Exclusive Buyer Agents Predictions for 2016
 Exclusive Buyer Agents Predictions for 2016 As compiled by the National Association of Exclusive Buyer Agents March, 2016 What is 2016 going to bring for real estate buyers? While no one has a crystal
.~ A joou [MIbIXmoll 0 t:b~~jmubmelu.lji ~io.1itudl OOnOOJJliA, Co1J~ M~bw: '. 11il IJlli7mL1)'i; W5t 1a:Ill}'1:I~.Lndi c
'i; W5t 1a:Ill}'1:I~.Lndi c") lltl.xte ' [0 CI-.~ A joou [MIbIXmoll 0 t:b~~jmubmelu.lji ~io.1itudl OOnOOJJliA, Co1J~ M~bw: '. 11il IJlli7mL1)'i; W5t 1a:Ill}'1:I~.Lndi c... " ;and t:b~.~parmw:ni ofjwio.1ltunlll1d 'Co IIlIff OOJoomicr,
lltl.xte ' [0 CI-.~ A joou [MIbIXmoll 0 t:b~~jmubmelu.lji ~io.1itudl OOnOOJJliA, Co1J~ M~bw: '. 11il IJlli7mL1)'i; W5t 1a:Ill}'1:I~.Lndi c... " ;and t:b~.~parmw:ni ofjwio.1ltunlll1d 'Co IIlIff OOJoomicr,
Hog Industry Ask Where All the Pigs Came From?
 Hog Industry Ask Where All the Pigs Came From? January 2002 Chris Hurt The year of 2001 resulted in pork supplies being up 1.1% with prices averaging $45.78 per live hundredweight. Increasing supplies
Four Reasons Dropshipping is Online Retailers Secret Weapon
 Four Reasons Dropshipping is Online Retailers Secret Weapon WHITE PAPER Dropshipping isn t just for startups You ll be shocked to hear that Nordstrom a notoriously brand-obsessed company utilizes dropshipping.
The Impact of Corn and Fed Cattle Prices on Feeder Cattle Price Slides
 Managing for Today s Cattle Market and Beyond March 2002 The Impact of Corn and Fed Cattle Prices on Feeder Cattle Price Slides By Kevin Dhuyvetter, Kansas State University Ted Schroeder, Kansas State