What is Word Cloud? Word clouds provide a concise yet fun way to summarize the content of websites or text documents
|
|
|
- Kristopher Hardy
- 6 years ago
- Views:
Transcription

1
2 What is Word Cloud? Word clouds provide a concise yet fun way to summarize the content of websites or text documents In a typical word cloud, tags from a website (or words from a document) are packed into a rectangular region in which font size indicates tag popularity (or word frequency) and font color indicates other useful information
3 Visual Appearance The tags can appear in alphabetical order, in a random order, they can be sorted by weight, and so on. Most popular is a rectangular tag arrangement with alphabetical sorting in a sequential line-by-line layout. Some prefer to cluster the tags semantically so that similar tags will appear near each other. Heuristics can be used to reduce the size of the tag cloud whether or not the purpose is to cluster the tags
4 Related Word F.B. Viégas, M. Wattenberg, and J. Feinberg, Participatory Visualization with Wordle, IEEE Trans. Visualization and Computer Graphics, vol. 15, no. 6, 2009, pp M. Dubinko et al., Visualizing Tags over Time, ACM Trans. Web, vol. 1, no. 2, 2007, pp C. Collins, F.B. Viégas, and M. Wattenberg, Parallel Tag Clouds to Explore and Analyze Faceted Text Corpora, Proc. IEEE Symp. Visual Analytics Science and Technology (VAST 09), IEEE Press, 2009, pp W. Cui, Y. Wu, S. Liu, F. Wei, M. Zhou, H. Qu, Context-Preserving, Dynamic Word Cloud Visualization, Pacific Visualization 2010
5 Context-Preserving, Dynamic Word Cloud Visualization Weiwei Cui and Yingcai Wu Hong Kong University of Science and Technology Shixia Liu, Furu Wei, and Michelle X. Zhou IBM China Research Lab Huamin Qu Hong Kong University of Science and Technology
6 Motivation Existing layout techniques are inadequate at balancing semantically meaningful clusters with visually appealing layouts Multidimensional scaling to project words onto 2D space results in wasted empty space Arranging clusters in lines to more efficiently use screen space sacrifices relationships between words, and aesthetically appealing word clouds that pack tags more tightly lose meaningful word positions
7 Proposed Method The proposed method uses context-preserving, dynamic word clouds to illustrate content evolution It generates a sequence of word clouds in which related words are grouped together This sequence is then coupled with a trend chart that summarizes content changes so that users can better explore large collections of documents
8

9 System Overview
10 Word Extraction Consider n documents T = {T 1, T 2,, T n } with different time stamps Remove unimportant words The system builds a histogram Hist i to indicate the frequency of all unique words in T i Words remaining in Hist i with frequencies higher than a userspecified threshold are selected as candidate word set W i, which creates the word cloud for T i. Finally, we obtain a set of extracted words W = {W 1, W 2,, W n } for T
11 Initial Word Placement With the extracted word set W, we place all important words ( W) on a 2D plane to create an initial word layout that semantically groups words Three semantic-coherence criteria to generate different layout styles Importance criterion Co-occurrence criterion Similarity criterion
12 Importance criterion The importance criterion creates layouts that cluster words on the basis of importance values at different time points (font sizes represent importance values) It groups words with similar variations in font sizes over time The corresponding feature vector is V i = {v 1, v 2,, v n }, where n is the number of time points in the documents and v j is the importance value (the font size) of word wd p at time point j.
13 Co-occurrence criterion The co-occurrence criterion ensures that words with similar appearances or disappearances over time are clustered together The corresponding feature vector is V a = {v 1, v 2,, v n }, with v j = 1 if wd p is visible at j, and v j = 0 otherwise.
14 Similarity criterion The similarity criterion creates layouts in which semantically similar words are clustered Hinrich Schütze s method suggests that semantically similar words share similar neighboring words The feature vector is V s = {v 1, v 2,, v m }, where m is the number of words in W. The element v q represents the number of times wd q W occurs close to wd p (in a sentence or larger context) in the documents.
15 Initial Word Placement The similarity between vectors V p and V q by the cosine measure: Dissimilarity matrix D is created, where element α p,q represents the similarity (cos(q) in the previous equation) between words p and q. Multidimensional scaling is employed to reduce each highdimensional vector to a 2D point.
16 Delaunay Triangulation Delaunay triangulation on word positions is performed to reduce wasted space In the graph G = (V, E), word positions are arranged on the 2D plane flexibly to reduce empty space while keeping the semantic relations between the words.
17 Force-Directed Model Follows three design principles: Overlapping(top priority): repulsive force prevents a word from being occluded with other words where k r is a given weight and Δ x and Δ y are the overlapping region s width and height

18
19 Force-Directed Model Planar: attractive force During layout adjustment, if a mesh triangle is flipped (if one vertex in the triangle goes to the other side ), the mesh will become nonplanar. In this case, the attractive force between the edge and the vertex takes effect and flips the triangle back where k a is a given weight and Δ d is the distance between word a and its edge e.
20
21 Force-Directed Model Compact (lowest priority): spring force removes empty space and packs words k r << k a << w max2, where w max is the words maximum importance value.

22
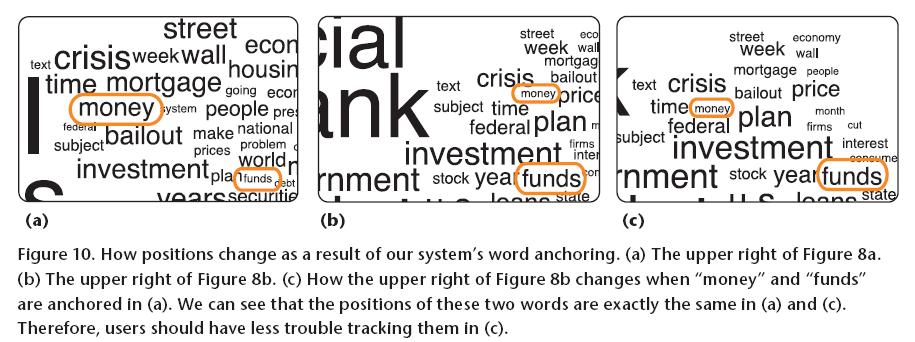
23 User Interaction Creating a Storyboard Users can selectively visualize specific word clouds by sliding a bar at the bottom of the trend chart Anchoring Words The system can anchor words in the same position across all word clouds Displaying Frequency Changes A line chart is overlaid on each keyword in the word cloud such that users can easily perceive the frequency change
24 Case Studies Artificial City Data AIG News Data 13,828 news articles related to American International Group form 14 Jan to 5 Apr 2009 CG&A Abstract Data 1984 abstracts from articles in IEEE Computer Graphics and Application from 1981 to 2009 Apple News Data 1993 news articles related to Apple from August 1989 to August 2009
25
26 Case Studies Artificial City Data AIG News Data 13,828 news articles related to American International Group form 14 Jan to 5 Apr 2009 CG&A Abstract Data 1984 abstracts from articles in IEEE Computer Graphics and Application from 1981 to 2009 Apple News Data 1993 news articles related to Apple from August 1989 to August 2009

27

28
29
30 Case Studies Artificial City Data AIG News Data 13,828 news articles related to American International Group form 14 Jan to 5 Apr 2009 CG&A Abstract Data 1984 abstracts from articles in IEEE Computer Graphics and Application from 1981 to 2009 Apple News Data 1993 news articles related to Apple from August 1989 to August 2009


31
32 Case Studies Artificial City Data AIG News Data 13,828 news articles related to American International Group form 14 Jan to 5 Apr 2009 CG&A Abstract Data 1984 abstracts from articles in IEEE Computer Graphics and Application from 1981 to 2009 Apple News Data 1993 news articles related to Apple from August 1989 to August 2009

33
34 Questions?
Context Preserving Dynamic Word Cloud Visualization
 Context Preserving Dynamic Word Cloud Visualization Weiwei Cui Yingcai Wu Shixia Liu Furu Wei Michelle X. Zhou Hong Kong University of Science and Technology IBM China Research Lab Huamin Qu Hong Kong
CS 4460 Intro. to Information Visualization November 13, 2017 John Stasko
 Text and Document Visualization 1 CS 4460 Intro. to Information Visualization November 13, 2017 John Stasko Learning Objectives Explain key challenges in visualizing a large document or body of text Identify
Opinion Seer: Interactive Visualization of Hotel Customer Feedback
 Opinion Seer: Interactive Visualization of Hotel Customer Feedback Yingcai Wu, Furu Wei, Shixia Liu, Norman Au, Weiwei Cui, Hong Zhou, and Huamin Qu, Member, IEEE Published by the IEEE Computer Society
Fisheye Word Cloud for Temporal Sentiment Exploration
 Fisheye Word Cloud for Temporal Sentiment Exploration Ji Wang Virginia Tech 2202 Kraft Drive Blacksburg, VA 24060 USA wji@cs.vt.edu Kyle D. Dent Palo Alto Research Center 3333 Coyote Hill Road Palo Alto,
Qstack: Multi-tag Visual Rankings
 Qstack: Multi-tag Visual Rankings Phi Giang Pham1, Mao Lin Huang1, 2* 1 University 2 Tianjin of Technology, Sydney, New South Wales, Australia. University, Tianjin, China. * Corresponding author. Tel.:
Comparison of Tag Cloud Layouts: Task-Related Performance and Visual Exploration
 Comparison of Tag Cloud Layouts: Task-Related Performance and Visual Exploration Steffen Lohmann, Jürgen Ziegler, and Lena Tetzlaff University of Duisburg-Essen, Lotharstrasse 65, 47057 Duisburg, Germany
Housekeeping. Text and Document Visualization. Information Visualization June 23, 2008 Carsten Görg. No class on Wednesday
 Text and Document Visualization Information Visualization June 23, 2008 Carsten Görg Slides adapted from John Stasko Housekeeping No class on Wednesday Assignment 5: Understanding Analytics due next Wednesday,
TextFlow: Towards Better Understanding of Evolving Topics in Text
 2412 IEEE TRANSACTIONS ON VISUALIZATION AND COMPUTER GRAPHICS, VOL. 17, NO. 12, DECEMBER 2011 TextFlow: Towards Better Understanding of Evolving Topics in Text Weiwei Cui, Shixia Liu, Member, IEEE, Li
Become a PowerPoint Guru [Sample Chapters]
![Become a PowerPoint Guru [Sample Chapters]](/thumbs/73/68573509.jpg "Become a PowerPoint Guru [Sample Chapters]") Become a PowerPoint Guru [Sample Chapters] Learn How to Create Effective Presentations By Dave Tracy dave@learnppt.com Thank you for your interest in my ebook. This PDF includes a sampling of content from
Become a PowerPoint Guru [Sample Chapters] Learn How to Create Effective Presentations By Dave Tracy dave@learnppt.com Thank you for your interest in my ebook. This PDF includes a sampling of content from
An Evaluation of Semantically Grouped Word Cloud Designs
 IEEE TRANSACTIONS ON VISUALIZATION AND COMPUTER GRAPHICS 1 An Evaluation of Semantically Grouped Word Cloud Designs Marti A. Hearst, Emily Pedersen, Lekha Patil, Elsie Lee, Paul Laskowski, and Steven Franconeri
Financial Time Series Segmentation Based On Turning Points
 Proceedings of 2011 International Conference on System Science and Engineering, Macau, China - June 2011 Financial Time Series Segmentation Based On Turning Points Jiangling Yin, Yain-Whar Si, Zhiguo Gong
Tag cloud generation for results of multiple keywords queries
 Tag cloud generation for results of multiple keywords queries Martin Leginus, Peter Dolog and Ricardo Gomes Lage IWIS, Department of Computer Science, Aalborg University What tag clouds are? Tag cloud
Innovative design of heat dissipation structure for LED street lamp based on AD and TRIZ
 Innovative design of heat dissipation structure for LED street lamp based on AD and TRIZ R.Ma,L.Liu&T.Yu Shanghai Key Lab of Intelligent Manufacturing and Robotics, School of Mechatronic Engineering and
TOWARD MORE DIVERSE RECOMMENDATIONS: ITEM RE-RANKING METHODS FOR RECOMMENDER SYSTEMS
 TOWARD MORE DIVERSE RECOMMENDATIONS: ITEM RE-RANKING METHODS FOR RECOMMENDER SYSTEMS Gediminas Adomavicius YoungOk Kwon Department of Information and Decision Sciences Carlson School of Management, University
On the beauty and usability of tag clouds
 On the beauty and usability of tag clouds Christin Seifert Know-Center Graz cseifert@know-center.at Barbara Kump Institute for Knowledge Management Graz University of Technology bkump@tugraz.at Gisela
Department of Industrial Engieering
 Department of Industrial Engieering Operations Analysis Assistant Prof. Abed Schokry Analysis techniques Between operations Multi Activity charts Project scheduling Flow diagrams and process charts Location
Module - 01 Lecture - 03 Descriptive Statistics: Graphical Approaches
 Introduction of Data Analytics Prof. Nandan Sudarsanam and Prof. B. Ravindran Department of Management Studies and Department of Computer Science and Engineering Indian Institution of Technology, Madras
Sorting Concept. Sorting of data. Skill
 6. Advanced Excel Aim: In this lesson, you will learn: To Organize the given data in a spreadsheet. To Calculate percentage, sum, average using functions option in a spreadsheet. To represent data in multiple
EvoRiver: Visual Analysis of Topic Coopetition on Social Media
 IEEE TRANSACTIONS ON VISUALIZATION AND COMPUTER GRAPHICS, VOL. 20, NO. 12, DECEM BER 2014 1753 EvoRiver: Visual Analysis of Topic Coopetition on Social Media Guodao Sun, Yingcai Wu, Member, IEEE, Shixia
The Impact of Rumor Transmission on Product Pricing in BBV Weighted Networks
 Management Science and Engineering Vol. 11, No. 3, 2017, pp. 55-62 DOI:10.3968/9952 ISSN 1913-0341 [Print] ISSN 1913-035X [Online] www.cscanada.net www.cscanada.org The Impact of Rumor Transmission on
Visual Analysis of the Air Pollution Problem in Hong Kong
 Visual Analysis of the Air Pollution Problem in Hong Kong CHAN Wing Yi, Winnie [Represented by MAK Wai Ho, Wallace] Department of Computer Science and Engineering The Hong Kong University of Science and
Brochure Design. How to create an effective brochure
 Brochure Design How to create an effective brochure Designing a professional brochure A brochure is a printed booklet or pamphlet that promotes an organisation, business, event, product or service. Brochures
= = Intro to Statistics for the Social Sciences. Name: Lab Session: Spring, 2015, Dr. Suzanne Delaney
 Name: Intro to Statistics for the Social Sciences Lab Session: Spring, 2015, Dr. Suzanne Delaney CID Number: _ Homework #22 You have been hired as a statistical consultant by Donald who is a used car dealer
Sorting Concept. Sorting of data. Skill
 6. Advanced Excel Aim: In this lesson, you will learn: Organize the given data. Calculate percentage, sum, average using functions option in a spreadsheet. To represent data in multiple ways. Tejas: Our
Welcome to lecture 4 of Topic 2.9. In this lecture we focus on Phase 2 of the Project Management Lifecycle the planning phase
 Welcome to lecture 4 of Topic 2.9. In this lecture we focus on Phase 2 of the Project Management Lifecycle the planning phase 1 The main aim of the planning phase of the project management lifecycle is
Overview Grading Career Project Career Research (100 points) may not whallhs gcis348
 may not whallhs gcis348") Overview Eventually, you will all enter the workforce and start a career. You may already know what you want to be or have no clue. This activity is to help you get a better understanding of what career
Overview Eventually, you will all enter the workforce and start a career. You may already know what you want to be or have no clue. This activity is to help you get a better understanding of what career
Public Opinion Mining For Effective Policy Making
 Public Opinion Mining For Effective Policy Making Mr. AmitVasant Pandhare 1, Dr. Abrar Alvi 2, 1 Student,Computer Science and Engg. Prof.RamMeghe Institute Of Tech. and Research, Badnera, Amravati, Maharashtra,
FacetClouds: Exploring Tag Clouds for Multi-Dimensional Data
 FacetClouds: Exploring Tag Clouds for Multi-Dimensional Data Manuela Waldner 1,2, Johann Schrammel 1, Michael Klein 1, Katrín Kristjánsdóttir 1, Dominik Unger 1, Manfred Tscheligi 1,3 1 Cure - Center for
G.Lakshmi K.Rajendar J.Pratap M.Tech(C.S.E). M.Tech(C.S.E). M.Tech(P.hd.). VCET,Karimnaga,Ap. JITS,Karimnagar,Ap. VCET,Karimnagar,Ap.
. M.Tech(C.S.E). M.Tech(P.hd.). VCET,Karimnaga,Ap. JITS,Karimnagar,Ap. VCET,Karimnagar,Ap.") SparkClouds: Incorporate Spark Lines into a Tag Clouds G.Lakshmi K.Rajendar J.Pratap M.Tech(C.S.E). M.Tech(C.S.E). M.Tech(P.hd.). VCET,Karimnaga,Ap. JITS,Karimnagar,Ap. VCET,Karimnagar,Ap. Abstract The
SparkClouds: Incorporate Spark Lines into a Tag Clouds G.Lakshmi K.Rajendar J.Pratap M.Tech(C.S.E). M.Tech(C.S.E). M.Tech(P.hd.). VCET,Karimnaga,Ap. JITS,Karimnagar,Ap. VCET,Karimnagar,Ap. Abstract The
Automatic Epithelial Cells Detection of Pap smears images using Fuzzy C-Means Clustering
 2012 4th International Conference on Bioinformatics and Biomedical Technology IPCBEE vol.29 (2012) (2012) IACSIT Press, Singapore Automatic Epithelial Cells Detection of Pap smears images using Fuzzy C-Means
On utility of temporal embeddings for skill matching. Manisha Verma, PhD student, UCL Nathan Francis, NJFSearch
 On utility of temporal embeddings for skill matching Manisha Verma, PhD student, UCL Nathan Francis, NJFSearch Skill Trend Importance 1. Constant evolution of labor market yields differences in importance
DYNEVI - DYnamic News Entity VIsualization
 International Symposium on Visual Analytics Science and Technology (2010), pp. 1 5 The definitive version is available at diglib.eg.org DYNEVI - DYnamic News Entity VIsualization F. Wanner 1, M. Schaefer
Visualizing San Francisco 311 Data
 Visualizing San Francisco 311 Data Jason Hayes, Joseph Ledesma, and Garey Le Monte Fig. 1. Word cloud of Request Type of San Francisco 311 service requests. Abstract The goal of this paper is to show how
Activities supporting the assessment of this award [3]
![Activities supporting the assessment of this award [3]](/thumbs/96/128485615.jpg "Activities supporting the assessment of this award [3]") Relevant LINKS BACK TO ITQ UNITS [1] Handbook home page [2] Overview This is the ability to use a software application designed to record data in rows and columns, perform calculations with numerical data
Relevant LINKS BACK TO ITQ UNITS [1] Handbook home page [2] Overview This is the ability to use a software application designed to record data in rows and columns, perform calculations with numerical data
SparkClouds: Visualizing Trends in Tag Clouds
 1182 IEEE TRANSACTIONS ON VISUALIZATION AND COMPUTER GRAPHICS, VOL. 16, NO. 6, NOVEMBER/DECEMBER 2010 SparkClouds: Visualizing Trends in Tag Clouds Bongshin Lee, Nathalie Henry Riche, Amy K. Karlson, and
= = Name: Lab Session: CID Number: The database can be found on our class website: Donald s used car data
 Intro to Statistics for the Social Sciences Fall, 2017, Dr. Suzanne Delaney Extra Credit Assignment Instructions: You have been hired as a statistical consultant by Donald who is a used car dealer to help
Technical Document Max Sort Final Labelling Print Production Specification Version 1.3
 Technical Document Max Sort Final Labelling Print Production Specification Version 1.3 Document ref : Max Sort FL - Print Production Specification V1.3.docx CONTENTS CONTENTS... 2 2. Print and Production...
Co-citation Analysis: An Overview
 Co-citation Analysis: An Overview Ganesh Surwase, Anil Sagar, B. S. Kademani and K. Bhanumurthy Scientific Information Resource Division, Bhabha Atomic Research Centre, Trombay, Mumbai (India) - 400085.
Time Series Motif Discovery
 Time Series Motif Discovery Bachelor s Thesis Exposé eingereicht von: Jonas Spenger Gutachter: Dr. rer. nat. Patrick Schäfer Gutachter: Prof. Dr. Ulf Leser eingereicht am: 10.09.2017 Contents 1 Introduction
Nagahama Institute of Bio-Science and Technology. National Institute of Genetics and SOKENDAI Nagahama Institute of Bio-Science and Technology
 A Large-scale Batch-learning Self-organizing Map for Function Prediction of Poorly-characterized Proteins Progressively Accumulating in Sequence Databases Project Representative Toshimichi Ikemura Authors
CHAPTER 10. Graphs, Good and Bad
 CHAPTER 10 Graphs, Good and Bad DISPLAYING DATA The first part of this course dealt with the production of data, through random sampling and randomized comparative experiments. This particular unit focuses
Heterogeneous Graphs in Social Business
 Graph Exploitation Symposium, Dedham, MA 17 18 April 2012 Heterogeneous Graphs in Social Business Kush R. Varshney, Jun Wang, and Aleksandra Mojsilović Agenda Brief introduction to business analytics Social
How to load a ferry: a comparison of packing algorithms for the vehicle ferry industry
 How to load a ferry: a comparison of packing algorithms for the vehicle ferry industry C. Bayliss, A. Martinez-Sykora, C. Currie, M. So, J.A. Bennell ICCL Southampton October 2017 This work was funded
DASHBOARDS, INFOGRAPHICS & EXECUTIVE SUMMARIES
 DASHBOARDS, INFOGRAPHICS & EXECUTIVE SUMMARIES AGENDA Context Dashboards Infographics Executive Summaries Questions OPEN & TRANSPARENT DASHBOARDS DASHBOARDS Single Screen Visual Objective Specific
VCP WWW US Warehouse Requirements Revision #: 08
 1. GENERAL REQUIREMENTS Please refer to the WWW specification sheet(s) for product construction and labeling information. Vendors must purchase all shoeboxes, hang tags and other packing materials from
Research on the Service Modeling Method of Information Management Software based on the Petri Net Model
 Research on the Modeling Method of Information Management Software based on the Petri Net Model Han Tianfeng School of Computer Application, Qingdao Hotel Management College P.R.China hantianfeng@126.com
Bio-inspired Computing for Network Modelling
 ISSN (online): 2289-7984 Vol. 6, No.. Pages -, 25 Bio-inspired Computing for Network Modelling N. Rajaee *,a, A. A. S. A Hussaini b, A. Zulkharnain c and S. M. W Masra d Faculty of Engineering, Universiti
Information and Communication Technology Syllabus
 Information and Communication Technology Syllabus Grade 9 To be implemented from 28 Department of Information Technology Faculty of Science and Technology National Institute of Education Maharagama Sri
International Journal of Recent Trends in Electrical & Electronics Engg., Dec IJRTE ISSN:
 Market Basket Analysis of Sports Store using Association Rules Harpreet Kaur 1 and Kawaljeet Singh 2 1 Department of Computer Science, Punjabi University, Patiala, India. 2 University Computer Centre,
15. Text Data Visualization. Prof. Tulasi Prasad Sariki SCSE, VIT, Chennai
 15. Text Data Visualization Prof. Tulasi Prasad Sariki SCSE, VIT, Chennai www.learnersdesk.weebly.com Why Visualize Text? Understanding get the gist of a document Grouping cluster for overview or classifcation
Use the interactive below to view examples of some of the types of charts that are available in Excel.
 Excel 2010 Working with Charts Introduction Page 1 A chart is a tool you can use in Excel to communicate your data graphically. Charts allow your audience to see the meaning behind the numbers, and they
Information Search Patterns on Product Comparison Services in ecommerce Websites
 Association for Information Systems AIS Electronic Library (AISeL) AMCIS 2005 Proceedings Americas Conference on Information Systems (AMCIS) 2005 Information Search Patterns on Product Comparison Services
STATE OF SOLIDIFICATION & CRYSTAL STRUCTURE
 STATE OF SOLIDIFICATION & CRYSTAL STRUCTURE Chapter Outline Determination of crystal properties or properties of crystalline materials. Crystal Geometry! Crystal Directions! Linear Density of atoms! Crystal
Advisors: Prof. Louis T. Oliphant Computer Science Department, Hiram College.
 Author: Sulochana Bramhacharya Affiliation: Hiram College, Hiram OH. Address: P.O.B 1257 Hiram, OH 44234 Email: bramhacharyas1@my.hiram.edu ACM number: 8983027 Category: Undergraduate research Advisors:
Study on Defects Edge Detection in Infrared Thermal Image based on Ant Colony Algorithm
 , pp.37-41 http://dx.doi.org/10.14257/astl.2016.137.07 Study on Defects Edge Detection in Infrared Thermal Image based on Ant Colony Algorithm Tang Qingju 1,2, Dai Jingmin 1, Liu Chunsheng 2, Liu Yuanlin
AN ALGORITHM FOR REMOTE SENSING IMAGE CLASSIFICATION BASED ON ARTIFICIAL IMMUNE B CELL NETWORK
 AN ALGORITHM FOR REMOTE SENSING IMAGE CLASSIFICATION BASED ON ARTIFICIAL IMMUNE B CELL NETWORK Shizhen Xu a, *, Yundong Wu b, c a Insitute of Surveying and Mapping, Information Engineering University 66
3.44. Development Guidelines
 3.6 Building Signs All signs must be properly located and attractively displayed. It is important to consider both pedestrians and motorists when designing new signs. The placement of new signs is an important
New Perspectives on Microsoft Excel Module 4: Analyzing and Charting Financial Data
 New Perspectives on Microsoft Excel 2016 Module 4: Analyzing and Charting Financial Data Objectives, Part 1 Use the PMT function to calculate a loan payment Create an embedded pie chart Apply styles to
Management Science Letters
 Management Science Letters 1 (2011) 449 456 Contents lists available at GrowingScience Management Science Letters homepage: www.growingscience.com/msl Improving electronic customers' profile in recommender
Exploring Tag-based Like Networks
 Exploring Tag-based Like Networks Kyungsik Han College of Information Sciences and Technology The Pennsylvania State University kuh178@psu.edu Jin Yea Jang College of Information Sciences and Technology
Business Intelligence Analyst
 IBM Skills Academy Business Intelligence Analyst (Classroom) Career path description The Business Intelligence Analyst career path prepares students to understand report building techniques using relational
JUNGLE CONTAINED PLAY INSTALLATION INSTRUCTIONS 1
 WWW.SPORTSPLAYINC.COM 1 TOP DOWN VIEW SIDE VIEW WWW.SPORTSPLAYINC.COM 2 Bird/ PANEL 1 PANEL 2 PANEL 3 PANEL 4 PANEL 5 PANEL 6 PANEL 7 PANEL 8 WWW.SPORTSPLAYINC.COM 3 902-795 JUNGLE CONTAINED PLAY PANEL
Holley Performance Products Bowling Green, Kentucky, U.S.A.
 Cover Page Holley Performance Products Bowling Green, Kentucky, U.S.A. RECEIVING BAR CODE LABEL SPECIFICATION Revision Original Release Contents page TABLE OF CONTENTS PAGE 1. SCOPE 1 1.1 Purpose 1 2.
Supporting Human Recollection of the Impressive Events using the Number of Photos
 Supporting Human Recollection of the Impressive Events using the Number of Photos Masaki Matsumoto 1, Sho Matsuura 1, Kenta Mitsuhashi 2 and Harumi Murakami 1 1 Graduate School for Creative Cities, Osaka
The SRT Brand. Key Visual Elements and Usage Guidelines
 The SRT Brand Key Visual Elements and Usage Guidelines Contents 3 SRT Brand Mark 4 SRT Brand Mark Guidelines 4 Area of Isolation 5 Rules of Use 6 Trademark Ownership Statement 7 Use of SRT Brand Name 8
Data Visualization. Prof.Sushila Aghav-Palwe
 Data Visualization By Prof.Sushila Aghav-Palwe Importance of Graphs in BI Business intelligence or BI is a technology-driven process that aims at collecting data and analyze it to extract actionable insights
Personalized Recommendation-based Partner Selection for SDN
 International Business Research; Vol. 5, No. 12; 2012 ISSN 1913-9004 E-ISSN 1913-9012 Published by Canadian Center of Science and Education Personalized Recommendation-based Partner Selection for SDN Ying
Exploring Microsoft Office Excel 2007
 Exploring Microsoft Office Excel 2007 Chapter 3: Charts: Delivering a Message Robert Grauer, Keith Mulbery, Judy Scheeren Committed to Shaping the Next Generation of IT Experts. Copyright 2008 Prentice-Hall.
The statistics used in this report have been compiled before the completion of any Post Results Services.
 Course Report 2015 Subject Administration and IT Level National 5 The statistics used in this report have been compiled before the completion of any Post Results Services. This report provides information
Visual Mining Business Service Using Pixel Bar Charts
 Visual Mining Business Service Using Pixel Bar Charts Ming C. Hao, Umeshwar Dayal, Fabio Casati Intelligent Enterprise Technologies Laboratory HP Laboratories Palo Alto HPL-2004-112 June 29, 2004* E-mail:
ManiWordle: Providing Flexible Control over Wordle
 1190 IEEE TRANSACTIONS ON VISUALIZATION AND COMPUTER GRAPHICS, VOL. 16, NO. 6, NOVEMBER/DECEMBER 2010 ManiWordle: Providing Flexible Control over Wordle Kyle Koh, Bongshin Lee, Bohyoung Kim, and Jinwook
ISTA 3A PACKAGE PERFORMANCE TEST
 Note: This report is issued subject to the Testing and Certification Regulations of the TÜV SÜD Group and the General Terms and Conditions of Business of TÜV SÜD PSB Pte Ltd. In addition, this report is
Introduction to Computational Advertising
 Introduction to Computational Advertising ISM293 University of California, Santa Cruz Spring 2009 Instructors: Ram Akella, Andrei Broder, and Vanja Josifovski 1 Questions about last lecture? We welcome
Vollrath System Work Instruction
 Author: Ed Ferkel Revised by: Mark LeGreve Approved by: Jim Race Page 1 of 17 1. Purpose To provide general guidelines and requirement information for labeling purchased products for The Vollrath Company.
Quantitative Methods. Presenting Data in Tables and Charts. Basic Business Statistics, 10e 2006 Prentice-Hall, Inc. Chap 2-1
 Quantitative Methods Presenting Data in Tables and Charts Basic Business Statistics, 10e 2006 Prentice-Hall, Inc. Chap 2-1 Learning Objectives In this chapter you learn: To develop tables and charts for
Why Partner with Loyalty360? 11% 23% 24% 30% 12% Loyalty360 reaches a wide variety of senior marketing professionals. TITLE BREAKDOWN INDUSTRY
 MEDIA KIT 2018 Why Partner with Loyalty360? TITLE BREAKDOWN Loyalty360 reaches a wide variety of senior marketing professionals. Examples include: Chief Commercial Officer Chief Marketing Officer Chief
Mining Time Series. Feb/13/2012
 Mining Time Series Feb/13/2012 What is Time Series Time series is a sequence of data points, measured typically at successive time points spaced at uniform time intervals. Time series mining comprises
Available online at International Journal of Current Research Vol. 9, Issue, 07, pp , July, 2017
 z Available online at http://www.journalcra.com International Journal of Current Research Vol. 9, Issue, 07, pp.53529-53533, July, 2017 INTERNATIONAL JOURNAL OF CURRENT RESEARCH ISSN: 0975-833X RESEARCH
Material Identification, External Suppliers
 Material Identification, External Suppliers Tennant Company Tennant Company at its option, may change, delete, suspend, or discontinue parts or the policy in its entirety, at any time without prior notice.
DIGITAL VERSION. Microsoft EXCEL Level 2 TRAINER APPROVED
 DIGITAL VERSION Microsoft EXCEL 2013 Level 2 TRAINER APPROVED Module 4 Displaying Data Graphically Module Objectives Creating Charts and Graphs Modifying and Formatting Charts Advanced Charting Features
Chapter 2. Describing Data (Descriptive Statistics)
") Chapter 2. Describing Data (Descriptive Statistics) Jie Zhang Accounting and Information Systems Department College of Business Administration The University of Texas at El Paso jzhang6@utep.edu Jie Zhang,
Chapter 2. Describing Data (Descriptive Statistics) Jie Zhang Accounting and Information Systems Department College of Business Administration The University of Texas at El Paso jzhang6@utep.edu Jie Zhang,
FAKE REVIEW AVOIDANCE IN ONLINE REVIEW SHARING USING SENTIMENTAL ANALYSIS
 FAKE REVIEW AVOIDANCE IN ONLINE REVIEW SHARING USING SENTIMENTAL ANALYSIS 1Assistant Professor, Dept of IT, Jeppiaar SRR Engineering College, Tamilnadu, India. 2,3,4 Dept of IT, Jeppiaar SRR Engineering
Essentials of IBM Rational Requirements Composer, v3. Module 4: Creating a use-case model
 Essentials of IBM Rational Requirements Composer, v3 Module 4: Creating a use-case model Copyright IBM Corporation 2010, 2011 Module overview After completing this module, you should be able to: Explain
Temporal Expertise Profiling
 Temporal Expertise Profiling Jan Rybak 1, Krisztian Balog 2, and Kjetil Nørvåg 1 1 Norwegian University of Science and Technology, Trondheim, Norway 2 University of Stavanger, Stavanger, Norway jan.rybak@idi.ntnu.no,
STAT 2300: Unit 1 Learning Objectives Spring 2019
 STAT 2300: Unit 1 Learning Objectives Spring 2019 Unit tests are written to evaluate student comprehension, acquisition, and synthesis of these skills. The problems listed as Assigned MyStatLab Problems
Lecture # 4 More on Supply and Demand
 Lecture # 4 More on Supply and emand I. Consumer Surplus Consumer surplus is the difference between what a consumer is willing to pay for a good and what the consumer actually pays when buying it. o Graphically,
Correlation between Carbon Steel Corrosion and Atmospheric Factors in Taiwan
 CORROSION SCIENCE AND TECHNOLOGY, Vol.17, No.2(2018), pp.37~44 pissn: 1598-6462 / eissn: 2288-6524 [Research Paper] DOI: https://doi.org/10.14773/cst.2018.17.2.37 Correlation between Carbon Steel Corrosion
1 BASIC CHARTING. 1.1 Introduction
 1 BASIC CHARTING 1.1 Introduction This section covers the basic principles of how to create and modify a chart in Excel. With Excel 2016, the charting process is user-friendly and offers many ways to amplify
Research Article Scheduling Methods for Food Resource Management under the Environment of Cloud
 Advance Journal of Food Science and Technology 11(4): 281-285, 2016 DOI:10.19026/ajfst.11.2411 ISSN: 2042-4868; e-issn: 2042-4876 2016 Maxwell Scientific Publication Corp. Submitted: May 5, 2015 Accepted:
Multi-Dimensional Representations -- How Many Dimensions? Cluster Stack Visualization for Market Segmentation Analysis
 Multi-Dimensional Representations -- How Many Dimensions? Cluster Stack Visualization for Market Segmentation Analysis William Wright Oculus Info Inc. An earlier version of this paper appeared in the Symposium
INSTRUCTIONS FOR THE PREPARATION OF POSTER PRESENTATIONS
 INSTRUCTIONS FOR THE PREPARATION OF POSTER PRESENTATIONS FORMAT Posters must reflect the material summarized in your abstract. Preferred Poster size is 45 inches horizontal by 45 inches vertical. The overall
6. Advanced Excel. Moz: Good. How are the consultants planning to proceed?
 Aim: In 6. Advanced Excel Tejas: Our teacher said that the local Kirana shop owner wanted some help with his business and asked us to become his consultants! Moz: What kind of help does he need? Jyoti:
Figure 1: Live Popularity
 Figure 1: Live Popularity Motivation I started this project with an initial question of how I could measure an individual person s influence. Many news sites have lists claiming that their list of individuals
Methods Engineering. Methods Engineering
 Methods Engineering 1 Methods Engineering Part II Chapters: 8. Introduction to Methods Engineering and Operations Analysis 9. Charting Techniques 10.Motion Study and Work Design 2 1 Chapter 8 Introduction
E-Commerce Logistics Mode Selection Based on Network Construction
 Modern Economy, 2019, 10, 198-208 http://www.scirp.org/journal/me ISSN Online: 2152-7261 ISSN Print: 2152-7245 E-Commerce Logistics Mode Selection Based on Network Construction Hanlin Qian School of Business
MODEL AND SIMULATION TO MINIMIZE EMPTY SPACE LEFT WITH LAFF METHOD IN THE LOADING OF CARGO SYSTEM ANDRIAS RUSLI & FRISKA NATALIA FERDINAND
 International Journal of Computer Science Engineering and Information Technology Research (IJCSEITR) ISSN(P): 2249-6831; ISSN(E): 2249-7943 Vol. 7, Issue 3, Jun 2017, 11-18 TJPRC Pvt. Ltd. MODEL AND SIMULATION
Math - Grade Five Unit 1 - Number Theory
 1 Time Frame: About 15 days (this includes a review days and testing days) Math - Grade Five Unit 1 - Number Theory Description: - To introduce students to the Student Reference, prime, composite, and
Monte Carlo Simulation of Grain Growth
 Materials Research, Vol. 2, No. 3, 133-137, 1999. 1999 Monte Carlo Simulation of Grain Growth Paulo Blikstein, André Paulo Tschiptschin Depto. de Eng. Metalúrgica e de Materiais, Escola Politécnica da
Trend Visualization on Twitter: What s Hot and What s Not?
 Trend Visualization on Twitter: What s Hot and What s Not? Sandjai Bhulai, Peter Kampstra, Lidewij Kooiman, and Ger Koole Faculty of Sciences VU University Amsterdam Amsterdam, The Netherlands {s.bhulai,
Geoguide 6 The New Guide to Reinforced Fill Structure and Slope Design in Hong Kong
 Geoguide 6 The New Guide to Reinforced Fill Structure and Slope Design in Hong Kong Geotechnical Engineering Office Civil Engineering Department The Government of the Hong Kong Special Administrative Region