Application of statistical tools and techniques in Quality Management
|
|
|
- Harvey Bailey
- 6 years ago
- Views:
Transcription
1 Application of statistical tools and techniques in Quality Management Asst. Professor Dr Predrag Djordjevic University of Belgrade, Technical Faculty in Bor, Serbia


2 QUALITY IN SOCIETY The concept was known back in the primordial human communities It s original role was to ensure the survival, later it became a matter of social status In early communities, a buyer was usually responsible for "quality assurance" Industrial Revolution: rise of inspection and separate quality departments
3 DEVELOPMENT OF QUALITY IN USA Industry was under the influence of the Taylor s theory quality was independent from design and production Bell Telephone Laboratories Shewhart published the first book in the field of quality control (500 pages) World War II


4 DEVELOPMENT OF QUALITY IN USA Deming is training workers and raising the level of industrial production up to the level of hostile countries competing in the World War II

5 QUALITY IN JAPAN Japan was on the losing side at the end of World War II Traditionally agricultural economy in addition to the strong military industry Gen. MacArthur invites US experts for the theory of quality to educate the Japanese leaders as a form of post-war help Deming introduces the concept of SPC to Japanese managers Japanese economic miracle
6 New approach to Quality using SPC Target value Traditional vs. new approach to Quality Management using SPC
7 Formal Definitions of Quality The totality of features and characteristics of a product or service that bears on its ability to satisfy given needs American Society for Quality Other definitions: Fitness for use Conformance to specifications Meeting or exceeding customer expectations

8 INTRODUCTION TO STATISTICAL PROCESS CONTROL
9 STATISTICAL PROCESS CONTROL (SPC) To meet or exceed customer expectations product should be produced by a process that is stable or repeatable The process must be capable of operating with little variability around the target dimensions of the product s quality characteristics SPC is a powerful collection of problem-solving tools useful in achieving process stability and improving capability through the reduction of variability Elimination of waste is another key element of SPC

 Pareto chart Scatter")

10 7 FOUNDAMENTAL QUALITY TOOLS Tools for numerical data Control chart Histogram (stem-and-leaf plot) Pareto chart Scatter diagram Tools for non-numerical data Check sheet Cause-and-effect diagram Flowchart

11 CONTROL CHARTS
12 Control charts Graphical representation of a quality characteristic that has been measured or computed from a sample vs. the sample number or time Control charts can be used to determine if a process has been in a state of statistical control by examining past data (Stage 1) They can be used to determine control limits (CL) that would apply to future data obtained from a process, in order to determine if the process is being maintained in a state of statistical control (Stage 2) They are used to track variability in key quality characteristics
13 Control charts Graphical representation of a quality characteristic that has been measured or computed from a sample vs. the sample number or time Upper Control Limit Out of control Center line Lower Control Limit Sample number or time
14 Variability in the process Natural random, common causes inherent in every process can be eliminated only through systematic improvements Assignable specific identifiable causes: machines operator errors defective raw material they can be managed
15 Types of Control Charts Variables Quality characteristics of the products which can be measured on a numerical scale length or width, diameter, temperature, volume etc. Attributes Quality characteristics which can be described with discrete data conforming or nonconforming, defective or nondefective
16 Types of Control Charts Type of Control Chart Numerical data (Measurements) Attribute data (Defects) X mr chart X R chart X σ chart p - chart np - chart c - chart u - chart
17 Choosing the right type of Control Chart

18 n sample size Elements of the Control Chart m number of samples

19 Elements of the Control Chart

20 X= 1 n n X i 1 i R X X max min UCL (X) X A n 2 ( ) R LCL (X) X- A ( n) R 2 UCL (R) D 3 R LCL (R) D 4 R LCL x 2,511 0,577 0, 070 2, 470 mm UCL x 2,511 0,577 0, 070 2,511mm LCL R 0 0, mm UCL R 2,115 0, 070 0,148 mm

21 Patterns in Control Charts Upper control limit Target Lower control limit Normal behavior Process is in control
22 Patterns in Control Charts Upper control limit Target Lower control limit One plot out above (or below) Investigate for cause Process is out of control.
23 Patterns in Control Charts Upper control limit Target Lower control limit Trends in either direction, 5 plots Investigate for cause of progressive change
24 Patterns in Control Charts Upper control limit Target Lower control limit Two plots very near lower (or upper) control Investigate for cause
25 Patterns in Control Charts Upper control limit Target Lower control limit Run of 5 above (or below) central line Investigate for cause
26 Patterns in Control Charts Upper control limit Target Lower control limit Erratic behavior Investigate

27 Interpretation of Control Charts The process is under statistical control because all points fall within the UCL and LCL
28 X - σ Control Chart When the sample size in the series is n > 10 Determination of control limits: X 1 n n i 1 X i n i1 x x 2 i n 1 UCL(X) X A ( n) LCL(X) X A ( n) 1 1 UCL( ) B ( n) LCL( ) B ( n) 4 3

29 X LCL A 1 UCL x x x x x UCL (X) X LCL (X) B 3 B 4 LCL UCL x x x x x UCL ( ) σ LCL ( ) The process is under statistical control because all points fall within the UCL and LCL
30 Problem In the factory for the manufacturing of plastic packaging Uniplast a sample is taken hourly, consisting of a number of plastic bottles which are tested for defects. Each bottle on which a defect would be found is being marked as nonconforming and sent for recycling. The table lists the number of bottles inspected during one shift and the number of defective bottles. Construct an appropriate control chart and assess the stability of the process. No. of sample series (m) No. of tested bottles (n i ) No. of defective bottles (d ni )
31 p Chart Control chart for monitoring fraction of nonconforming units The percentage of defective products is calculated as p d (%) 100 n The mean value of the percentage of defective units - the central line p total number of defective products in all samples D total number of sampled products N m i 1 d i n m U L CL ( p) p 3 p(100 p) n
32 40.00% p Chart 35.00% % 30.00% 30.05% 26.58% 27.21% 29.18% 28.43% 28.10% 25.00% 20.00% 15.00% CEN=13.15% 10.00% 5.00% 0.00%
33 Problem In a facility belonging to the Canon company, in the production line for image sensors, a strict testing procedure requires sampling of 25 chips each hour and running a number of tests in order to determine the output quality of the chips. If any nonconformity is detected on the sensor, it is considered as defective. The table presents testing results. Construct an appropriate control chart and assess the stability of the process. No. of samples (k) No. of tested sensors (n) No. of defective sensors in the sample (m)
34 np Chart When dealing with number of defective products in the sample When testing samples of the same size np m m i number of defective products within a single sample k total number of series in the sample m i1 k m i U L M CL( m) m 3 m (1 ) N - total number of sampled products (k n) N
35 np Chart 12 UCL= CEN= LCL=
36 Problem In the branch facility of the firm U. S. Steel in Serbia, in a plant's tinplate production line, the quality of produced tinplate is controlled by collecting the 30x30 cm of sheet samples. These samples are then tested for defects. The number of defects found in each of the samples are shown in the table. Construct an appropriate control chart and assess the stability of this manufacturing process. Sample No. (k) No. of defects in the sample (d)
37 c Chart Control of the number of defects per sample, when there is no limit to the number of defects that can be found in one product When testing samples of the same size c k i1 k d i d i - number of defects within a single sample k total number of samples U CL( c ) L c 3 c
38 c - Chart 10 UCL= CEN= LCL=
39 Problem In order to examine the quality of the manufactured chips in one of the subcontracting manufacturing facilities of the company AMD, which produces chips for computer graphics cards, a number of manufactured chips are randomly sampled from each batch and thoroughly examined. Any irregularity regarding the number of defective Stream processors is registered and their number, along with a corresponding number of sampled units is presented in table. Construct an appropriate control chart and assess the stability of the process. Series No. (m) No. of tested chips in the series (n) No. of defects in the sample (d)
40 u Charts Control of the number of defects per sample, when there is no limit to the number of defects that can be found in one product When testing samples of different size u k d i number of defects N total number of sampled products in a series i1 N d i U L CL( u ) u 3 u n i
41 u - Chart CEN=


42 Process Capability Indices
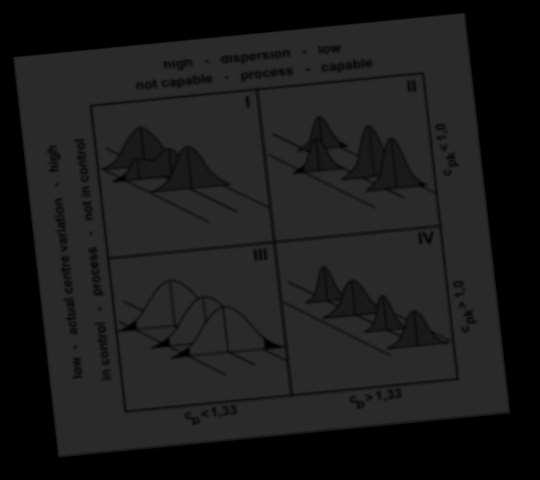
43 Process Capability Ratio C p C p - way of expressing process capability for a quality characteristic with both USL and LSL C p USL LSL 6 If C p 1.0, the outputs of the process will be in accordance with the specification C p 1.0 the process yields products or services that are outside their allowable tolerance In general, the larger C P is, the better
44 Example Calculate the process capability ratio for the production of additives used for the preparation of special polymers, which are used to protect rubber surface under extreme weather conditions. Specification: 9.0 ml 0.5 ml Process mean X = 8.80 ml Standard deviation of the process σ = 0.12 ml C p USL LSL
45 Process capability index - C pk C pk takes process centering into account unlike C p C pk Min USL LSL, 3 3 o X X o Generally accepted minimum value for C p is 1.33 A C pk of 2.0 means the process is capable of producing fewer than 3.4 defects per million (6 sigma process) Generally, if C p = C pk, the process is centered at the midpoint of the specification, and when C pk < C p the process is off center
46 Example For the previous example, calculate the process capability index C pk Specification: 9.0 ml 0.5 ml Process mean X = 8.80 ml Standard deviation of the process σ = 0.12 ml USL X X LSL C Min, Min, pk o o Min 1.94,


47 TA G U C H I S Q UA L I T Y L O S S F U N C T I O N


48 Taguchi principle In the traditional approach to the actual quality of the product was evaluated only in terms of respecting specifications It was believed that after sale of the product, the consumer was the one to bear costs due to quality loss Taguchi s associated customer satisfaction with the potential for loss of reputation associated with failure to meet customer expectations He changed the perspective of quality by correlating quality with direct and indirect costs not only at the manufacturing level, but also to the customer and society in general
49 Taguchi s Loss Function Target L(m) = 0 L(y) = k (y i m) 2
50 Characteristic curve shapes of loss function Larger-is-better Smaller-is-better
51 Dependence of the loss on the relationship between the average and variance Target value Products A and B have the same mean and different variances
52 Dependence of the loss on the relationship between the average and variance Target value Products A and B have the same variances and different means
53 Dependence of the loss on the relationship between the average and variance Target value Products A and B have different variances and means
54 Example Manufacturer of paints and varnishes wants to calculate losses related to the delivery of red paint to a car manufacturer. The target value is 100 g of pigment per 1 liter of the color. The average loss per customer which occurs due to the return of order is 600 euros. Quality of paint is considered unsatisfactory if the amount of the pigment exceeds the specification of 100g ± 10g. Calculate the loss that occurs due to poor quality, if a liter of paint contains only 85g of pigment. 0 L k y m k Ao /g 10g A L ; 10g 0 6 /g L 1350 g 2 2 Ao Average customer loss Δ 0 Functional tolerance

55 KANO MODEL
56 KANO MODEL Zero defect doesn t imply high customer satisfaction A company must identify and offer some unexpected features of its product or service which will positively surprise the customer Kano model is used to understand the importance of functions or features to a customer These functions or features of product or service are called needs
57 Customer needs Kano model sorts customer needs into one of three categories: Basic needs The needs that are so fundamental that they are not expressed by the customer, except when we fail to fulfill them Performance needs Meeting (or not meeting) these needs increases (decreases) customer satisfaction in proportion to the degree in which they are met (or not met)
58 Customer needs Kano model sorts customer needs into one of three categories: Basic needs The needs that are so fundamental that they are not expressed by the customer, except when we fail to fulfill them Performance needs Meeting (or not meeting) these needs increases (decreases) customer satisfaction in proportion to the degree in which they are met (or not met) Excitement needs Difficult to identify because they are beyond the expectations of customers, their absence does not bring dissatisfaction among customers, but their presence immediately excites
59 Customer Satisfaction Kano model Absent Excitement Basic Fully Implemented Product Functionality
60 Kano s Paired Questions To determine the category of needs, Kano uses a set of paired questions 1. question asks how you feel if something exists 2. question asks how you feel if something does not exist 1. How do you feel if the instructor has a good sense of humor? 2. How do you feel if the instructor presents much useful information? 3. How do you feel if the instructor doesn t have a good sense of humor? 4. How do you feel if the instructor doesn t present much useful information? Use 1-5 to answer: 1. I really like it; 2. I like it; 3. I feel neutral; 4. I do not like it; 5. I really do not like it. Use A-B to answer: A - I really like it; B - I like it; C - I feel neutral; D - I do not like it; E - I really do not like it.
61 NEGATIVNO NEGATIVE I ZAISTA really MI like SE it SVIĐA I SVIĐA like it MI SE I NEUTRALAN feel neutral SAM I NE do SVIĐA not like MI SE it I ZAISTA really MI do SE not NE like SVIĐA it The matrix for the selection of the category for needs POZITIVNO POSITIVE A B C D E 1 I ZAISTA really MI like SE it SVIĐA H 2 I SVIĐA like it MI SE 3 I NEUTRALAN feel neutral SAM R C 4 I NE do SVIĐAMI not like SE it R 5 I ZAISTA really MI do SE not NE like SVIĐA it R R R

62 QFD, House of Quality


63 QFD Technique which allows the whole of the NPD process to be driven by the customer requirements QFD is a way to assure the design quality while the product is still in the design stage - Yoji Akao History QFD application:
64 Resources QFD vs. traditional development process Firefighting Redesign Hindered communication Intense customer focus Better planning Improved communication Cross functional teamwork No QFD reactive development With QFD proactive development Project Beginning Time Launch
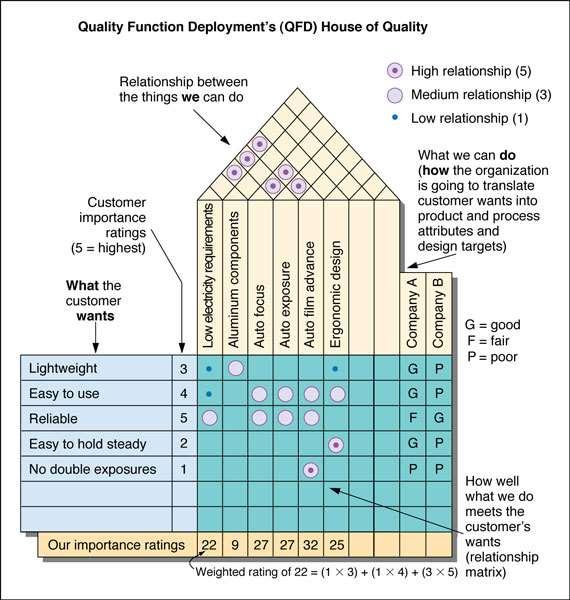
65 House of Quality Identify the customer Determine customer requirements (Kano model) Rank the requirements and determine their relative importance Translate customer requirements into measureable engineering requirements Competition benchmarking Develop importance ratings (Pareto analysis)

66 House of Quality

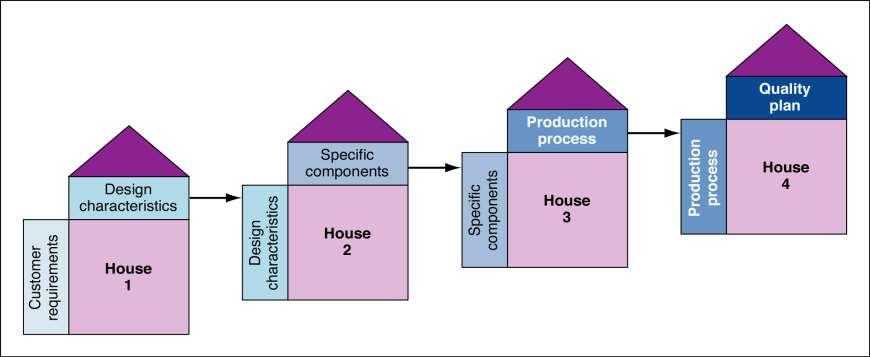
67 Houses of Quality sequence

68 House of Quality Example
Quality Management. It costs a lot to produce a bad product. Norman Augustine
 Quality Management It costs a lot to produce a bad product. Norman Augustine Cost of quality 1. Prevention costs 2. Appraisal costs 3. Internal failure costs 4. External failure costs 5. Opportunity costs
Quality Management (PQM01) Chapter 04 - Quality Control
 Chapter 04 - Quality Control") Quality Management (PQM01) Chapter 04 - Quality Control Slide 1 Slide 2 Involves monitoring specific project results to determine if they comply with relevant quality standards, and identifying ways to
Quality Management (PQM01) Chapter 04 - Quality Control Slide 1 Slide 2 Involves monitoring specific project results to determine if they comply with relevant quality standards, and identifying ways to
Project Quality Management. For the PMP Exam using PMBOK
 Project Quality Management For the PMP Exam using PMBOK Guide 5 th Edition PMI, PMP, PMBOK Guide are registered trade marks of Project Management Institute, Inc. Contacts Name: Khaled El-Nakib, PMP, PMI-RMP
Lecture Notes on Statistical Quality Control
 STATISTICAL QUALITY CONTROL: The field of statistical quality control can be broadly defined as those statistical and engineering methods that are used in measuring, monitoring, controlling, and improving
Project Management CTC-ITC 310 Spring 2018 Howard Rosenthal
 Project Management CTC-ITC 310 Spring 2018 Howard Rosenthal 1 Notice This course is based on and includes material from the text: A User s Manual To the PMBOK Guide Authors: Cynthia Stackpole Snyder Publisher:
Process Performance and Quality Chapter 6
 Process Performance and Quality Chapter 6 How Process Performance and Quality fits the Operations Management Philosophy Operations As a Competitive Weapon Operations Strategy Project Management Process
Process Performance and Quality
 Process Performance and Quality How Process Performance and Quality fits the Operations Management Philosophy Chapter 6 Operations As a Competitive Weapon Operations Strategy Project Management Process
For the PMP Exam using PMBOK. PMI, PMP, PMBOK Guide are registered trade marks of Project Management Institute, Inc.
 For the PMP Exam using PMBOK Guide 5 th Edition PMI, PMP, PMBOK Guide are registered trade marks of Project Management Institute, Inc. 1 Contacts Name: Khaled El-Nakib, MSc, PMP, PMI-RMP URL: http://www.khaledelnakib.com
Introduction to Quality Management. BPF 2123 Quality Management System
 Introduction to Quality Management BPF 2123 Quality Management System 1 Chapter Outline Introduction Changes in the Business Culture Defining Quality Dimensions of Quality Gurus of Quality / TQM Historical
SPECIAL CONTROL CHARTS
 INDUSTIAL ENGINEEING APPLICATIONS AND PACTICES: USES ENCYCLOPEDIA SPECIAL CONTOL CHATS A. Sermet Anagun, PhD STATEMENT OF THE POBLEM Statistical Process Control (SPC) is a powerful collection of problem-solving
Chapter 9 1. List and briefly explain the dimensions of product and service quality
 Chapter 9 1. List and briefly explain the dimensions of product and service quality Product Quality the dimensions of product quality include: 1. performance main characteristics or function of the product
Online Student Guide Types of Control Charts
 Online Student Guide Types of Control Charts OpusWorks 2016, All Rights Reserved 1 Table of Contents LEARNING OBJECTIVES... 4 INTRODUCTION... 4 DETECTION VS. PREVENTION... 5 CONTROL CHART UTILIZATION...
Chapter 1. Introduction
 Chapter 1 Introduction INTRODUCTION 1.1 Introduction Statistics and statisticians can throw more light on an issue than a committee. of experts for making decisions on real life problems. Professor C.
Quality. Monitoring & Controlling Processes. Planning. Processes. Executing Processes. Process. Knowledge Area. Monitoring &
 PMBOK 5 Ed. DEI- Monitoring & Controlling Processes Planning Processes Enter phase/ Start project Initiating Processes Closing Processes Exit phase/ End project Executing Processes Knowledge Area Process
PROJECT QUALITY MANAGEMENT. 1 Powered by POeT Solvers LImited
 PROJECT QUALITY MANAGEMENT 1 www.pmtutor.org Powered by POeT Solvers LImited WHAT S PROJECT QUALITY MANAGEMENT? WHAT S PROJECT QUALITY MANAGEMENT? Project Quality Management processes include all the activities
Projektledning och Projektmetodik, VBEF01. Kristian Widén Tekn. Doktor Avd. För Byggproduktion Inst. För Byggvetenskaper Lunds Universitet
 Projektledning och Projektmetodik, VBEF01 Kristian Widén Tekn. Doktor Avd. För Byggproduktion Inst. För Byggvetenskaper Lunds Universitet 1 Project Quality Management 2 What Is Project Quality Management?
Chapter 6 - Statistical Quality Control
 Chapter 6 - Statistical Quality Control Operations Management by R. Dan Reid & Nada R. Sanders 3rd Edition PowerPoint Presentation by R.B. Clough UNH M. E. Henrie - UAA Learning Objectives Describe Categories
SHORT ANSWER QUESTIONS (KEY) UNIT- I
 UNIT- I") SHORT ANSWER QUESTIONS (KEY) UNIT- I 1. Define quality. Quality is the totality of characteristics of an entity that bear on its ability to satisfy stated and implied needs. 2. What do you mean by quality
SHORT ANSWER QUESTIONS (KEY) UNIT- I 1. Define quality. Quality is the totality of characteristics of an entity that bear on its ability to satisfy stated and implied needs. 2. What do you mean by quality
CH (8) Hot Topics. Quality Management
 Hot Topics. Quality Management") CH (8) Hot Topics Quality Management 1 CH ( 8 ) Quality Management 2 Introduction This knowledge area requires you to understand three processes, as described in the book PMP : Plan Quality Management,
CH (8) Hot Topics Quality Management 1 CH ( 8 ) Quality Management 2 Introduction This knowledge area requires you to understand three processes, as described in the book PMP : Plan Quality Management,
FUNDAMENTALS OF QUALITY CONTROL AND IMPROVEMENT
 FUNDAMENTALS OF QUALITY CONTROL AND IMPROVEMENT Third Edition AMITAVA MITRA Auburn University College of Business Auburn, Alabama WILEY A JOHN WILEY & SONS, INC., PUBLICATION PREFACE xix PARTI PHILOSOPHY
FUNDAMENTALS OF QUALITY CONTROL AND IMPROVEMENT. Fourth Edition. AMITAVA MITRA Auburn University College of Business Auburn, Alabama.
 FUNDAMENTALS OF QUALITY CONTROL AND IMPROVEMENT Fourth Edition AMITAVA MITRA Auburn University College of Business Auburn, Alabama WlLEY CONTENTS PREFACE ABOUT THE COMPANION WEBSITE PART I PHILOSOPHY AND
İŞL 343 Üretim İşlemler Yönetimi Bahar Dönemi. Chapters 9-10 Management and Control of Quality. Melike Meterelliyoz Kuyzu
 İŞL 343 Üretim İşlemler Yönetimi 2010-2011 Bahar Dönemi Chapters 9-10 Management and Control of Quality Melike Meterelliyoz Kuyzu What is quality? Quality does not mean goodness is the ability of a product
Sources of Variation in Manufacturing and Service Processes
 COURSE: Quality and Assessment TOPIC: INSTRUCTOR: CENTER OF MANUFACTURING EXCELLENCE Sources of Variation in Manufacturing and Service Processes There is a clear difference between Manufacturing companies
The Philosophy of TQM An Overview
 The Philosophy of TQM An Overview TQM = Customer-Driven Quality Management References for Lecture: Background Reference Material on Web: The Philosophy of TQM by Pat Hammett Customer Quality Measures Customers
Why Learn Statistics?
 Why Learn Statistics? So you are able to make better sense of the ubiquitous use of numbers: Business memos Business research Technical reports Technical journals Newspaper articles Magazine articles Basic
Workshop 5. Managing Quality. Kate Hughes & John Whiteley
 Workshop 5 Managing Quality Kate Hughes & John Whiteley 8-2 The various definitions of quality The transcendent approach views quality as synonymous with innate excellence. The manufacturing-based approach
Operations Management
 9-1 Management of Quality Operations Management William J. Stevenson 8 th edition 9-2 Management of Quality CHAPTER 9 Management of Quality McGraw-Hill/Irwin Operations Management, Eighth Edition, by William
Applying Statistical Techniques to implement High Maturity Practices At North Shore Technologies (NST) Anand Bhatnagar December 2015
 Anand Bhatnagar December 2015") Applying Statistical Techniques to implement High Maturity Practices At North Shore Technologies (NST) Anand Bhatnagar December 2015 For our audience some Key Features Say Yes when you understand Say No
Applying Statistical Techniques to implement High Maturity Practices At North Shore Technologies (NST) Anand Bhatnagar December 2015 For our audience some Key Features Say Yes when you understand Say No
1. Control Charts. Control charts can be used to: Assess process stability Assess process capability Aid in process improvement
 1. Control Charts Control charts can be used to: Assess process stability Assess process capability Aid in process improvement Chance causes or common causes are numerous small causes of variability that
Strategies for Improvement of Process Control
 Strategies for Improvement of Process Control Michael V. Petrovich Luftig & Warren International National Manufacturing Week March 2000 Presentation Objectives Expand the concept of process control beyond
Techniques and Tools OPRE
 Techniques and Tools OPRE 6364 1 TQM Operationalized Find out what the customer wants Design a product or service that meets or exceeds customer wants Design processes that facilitates doing the job right
PMP Exam Preparation Workshop Project Quality Management
 PMP Exam Preparation Workshop Project Quality Management 1 Learning Objectives By the end of this session you will understand: The PM Quality Processes The PM Process Groups Project Quality Management
Malay (Rumi, Roman script)
") Hai Malay (Rumi, Roman script) Project Management Process Groups Project Integration Management Initiating Planning Executing Scope Monitoring & Controlling Closing Knowledge Areas Time Cost Quality Human
Hai Malay (Rumi, Roman script) Project Management Process Groups Project Integration Management Initiating Planning Executing Scope Monitoring & Controlling Closing Knowledge Areas Time Cost Quality Human
Delivering Engineered Solutions
 Quality Terms Term Description Accept / Reject Criteria This refers to the measurement and decision of whether or not the quality and performance of a product or service is acceptable. These criteria can
many quality problems remain invisible to consumers
 Quality Management 1. Define Quality and TQM. 2. What are the ISO standards and why are they important? 3. What is Six Sigma? 4. Explain how benchmarking is used? 5. What are quality robust products and
Project Quality Management
 1 Project Quality Management Unit 8 Eng.elsaka09@gmail.com Project Quality Management Includes the processes and activities of the performing organization that determine quality policies, objectives, and
Project Quality Management. Prof. Dr. Daning Hu Department of Informatics University of Zurich
 Project Quality Management Prof. Dr. Daning Hu Department of Informatics University of Zurich Learning Objectives Define project quality management and understand how quality relates to various aspects
Statistics Quality: Control - Statistical Process Control and Using Control Charts
 Statistics Quality: Control - Statistical Process Control and Using Control Charts Processes Processing an application for admission to a university and deciding whether or not to admit the student. Reviewing
Project Quality Management
 Project Quality Introduction Unit 1 Unit 2 Unit 3 PMP Exam Preparation Project Integration Project Scope Project Time Unit 4 Unit 5 Unit 6 Unit 7 Project Cost Project Quality Project Human Resource Project
Address for Correspondence
 Research Paper OPTIMIZATION OF CRITICAL TO QUALITY PARAMETERS OF VERTICAL SPINDLE SURFACE GRINDER 1 Maheshkumar A. Sutar, 2 Anil R. Acharya Address for Correspondence 1 Student, 2 Professor, Government
CHAPTER 01 Foundations of Quality and Performance Excellence
 1. The view of quality as the satisfaction of customer needs is often called fitness for use. DESC.EVAL.17.01.01 Quality and Performance 2. Since quality relates to goods or services, both only for-profit
Ch.8 Quality Management.
 Part 1 : System Management. Ch.8 Quality Management. Edited by Dr. Seung Hyun Lee (Ph.D., CPL) IEMS Research Center, E-mail : lkangsan@iems.co.kr - 1 - Definition of Quality. [APICS Dictionary] Fitness
Learning Objectives. Defining Quality. Defining Quality 5 Ways. Manufacturing Quality vs. Service Quality. Cost of Quality. Chapter 5 Managing Quality
 Chapter 5 Managing Quality Operations Management by R. Dan Reid & Nada R. Sanders 4th Edition Wiley 2010 Learning Objectives Explain the meaning of TQM Identify the costs of Quality Identify Quality leaders
We are IntechOpen, the world s leading publisher of Open Access books Built by scientists, for scientists. International authors and editors
 We are IntechOpen, the world s leading publisher of Open Access books Built by scientists, for scientists 3,500 108,000 1.7 M Open access books available International authors and editors Downloads Our
We are IntechOpen, the world s leading publisher of Open Access books Built by scientists, for scientists. International authors and editors
 We are IntechOpen, the world s leading publisher of Open Access books Built by scientists, for scientists 3,900 116,000 120M Open access books available International authors and editors Downloads Our
On Quality Engineering
 On Quality Engineering Jorge Luis Romeu, Ph.D. Certified Quality/Reliability Engineer Senior Member/Deputy Dir. Reg. II, ASQ http://www.linkedin.com/pub/jorge-luis-romeu/26/566/104 Email: jlromeu@verizon.net
Statistics and Pharmaceutical Quality
 Statistics and Pharmaceutical Quality Karthik Iyer (CQE, CSSBB) Senior Policy Advisor CDER/OC/OMPQ January 24 th, 2014 IFPAC * This presentation reflects the views of the author and should not be construed
Developing and implementing statistical process control tools in a Jordanian company. R.H. Fouad* and Salman D. Al-Shobaki
 Int. J. Manufacturing Technology and Management, Vol. 17, No. 4, 2009 337 Developing and implementing statistical process control tools in a Jordanian company R.H. Fouad* and Salman D. Al-Shobaki Department
UNIT 2 QUALITY PHILOSOPHY
 UNIT 2 QUALITY PHILOSOPHY 1 Quality What is quality? It is a relative word It lies in the eyes of the perceiver According to ISO 9000:2000, it is defined as the degree to which a set of inherent characteristics
Teuvo Suntio. Quality Development Tools. Professor of Power Electronics at University of Oulu. Electronic System Design A TS Rev. 1.
 * * * Quality Development Tools Teuvo Suntio Professor of Power Electronics at University of Oulu Slide 1/25 Six Sigma: [1] S. G. Shina, Six Sigma for Electronics Design and Manufacturing, McGraw-Hill,
Minimizing Defect of Air Craft Parts Machining Product Using Six Sigma Approach
 International Journal of Engineering Inventions e-issn: 2278-7461, p-issn: 2319-6491 Volume 8, Issue 1 [January 2019] PP: 01-10 Minimizing Defect of Air Craft Parts Machining Product Using Six Sigma Approach
Daniel Y. Peng, Ph.D.
 Using Control Charts to Evaluate Process Variability Daniel Y. Peng, Ph.D. Quality Assessment Lead Office of Process and Facility (OPF) OPQ/CDER/FDA PQRI 205 Annual Meeting North Bethesda, Maryland October
Ch.3 Quality Issues.
 Module 2 : Supply Environment. Ch.3 Quality Issues. Edited by Dr. Seung Hyun Lee (Ph.D., CPM) IEMS Research Center, E-mail : lkangsan@iems.co.kr Resolving Quality Problems. Documentation of Corrective
INDUSTRIAL ENGINEERING
 1 P a g e AND OPERATION RESEARCH 1 BREAK EVEN ANALYSIS Introduction 5 Costs involved in production 5 Assumptions 5 Break- Even Point 6 Plotting Break even chart 7 Margin of safety 9 Effect of parameters
2. List 5 processes of the Executing Process Group. (15)
") CSC 310 Program Management California State University Dominguez Hills Spring 2017 Instructor: Howard Rosenthal Assignment 3b Chapter 3 What Are The Project Management Process Groups The answers to these
CSC 310 Program Management California State University Dominguez Hills Spring 2017 Instructor: Howard Rosenthal Assignment 3b Chapter 3 What Are The Project Management Process Groups The answers to these
Developing Control Charts in a Manufacturing Industry and Improvement of Quality Using PDCA Cycle
 International Conference on Mechanical, Industrial and Materials Engineering 07 (ICMIME07) 8-0 December, 07, RUET, Rajshahi, Bangladesh. Paper ID: IE-64 Developing Control Charts in a Manufacturing Industry
WHY QUALITY IS IMPORTANT? PRODUCT AND QUALITY COSTS OF POOR QUALITY COST OF ACHIEVING GOOD QUALITY. Prevention costs.
 WHY QUALITY IS IMPORTANT? Lecture 7: Quality management systems PRODUCT AND QUALITY Quality has direct impact on economic results in both ways Costs Incomes Quality assurance Poor quality costs Higher
Chapter 03 Control Charts. Process Variations and Quality
 University of Hail College of Engineering QEM 511 - Total Quality Management Chapter 03 Control Charts Prof. Mohamed Aichouni Lectures notes adapted from: PowerPoint presentation to accompany Besterfield,
Cork Regional Technical College
 Cork Regional Technical College Bachelor of Engineering in Chemical and Process Engineering - Stage 4 Summer 1996 CE 4.8 - DECISION ANALYSIS AND OPERATIONS RESEARCH (Time: 3 Hours) Answer FOUR Questions.
The Importance of Understanding Type I and Type II Error in Statistical Process Control Charts. Part 1: Focus on Type 1 Error
 The Importance of Understanding Type I and Type II Error in Statistical Process Control Charts Part 1: Focus on Type 1 Error Phillip R. Rosenkrantz, Ed.D., P.E. California State Polytechnic University
International Journal on Textile Engineering and Processes, ISSN: , Vol 1, Issue 1, Jan2015
 Total Quality Management in Terry Fabric Manufacturing Pranjali Chandurkar, CTF Abstract The challenge that companies face as the 21st Century gets underway, is to succeed in global economy where competition
Quality Management Chapter 14
 Quality Management Chapter 14 1 Objectives What is Quality? Total Quality Management TQM in Service Cost of Quality Quality Improvements Quality Awards and Certifications 2 What is Quality? The Meaning
Computer Science and Software Engineering University of Wisconsin - Platteville 3. Statistical Process Control
 Computer Science and Software Engineering University of Wisconsin - Platteville 3. Statistical Process Control Yan Shi SE 3730 / CS 5730 Lecture Notes Outline About Deming and Statistical Process Control
Quality management in construction projects
 Quality management in construction projects MSc, PMP, CQE ASQ. Introduction The quality as a concept has a deep root in the history, anyway the quality profession greatly evolved after World War II when
Tools for Any Production to Control Quality of Product
 Tools for Any Production to Control Quality of Product Dr. S. Qaim Akbar Department of Statistics Shia P.G. College, Lucknow University, Lucknow, India-226020. Abstract The Statistical quality control
DHANALAKSHMI COLLEGE OF ENGINEERING DEPARTMENT OF MECHANICAL ENGINEERING GE 6757 TOTAL QUALITY MANAGEMENT. Unit-IV TOOLS AND TECHNIQUES II
 1 DHANALAKSHMI COLLEGE OF ENGINEERING DEPARTMENT OF MECHANICAL ENGINEERING GE 6757 TOTAL QUALITY MANAGEMENT Unit-IV TOOLS AND TECHNIQUES II 1. What are the various approaches to improving reliability of
Lecture #2. Prof. John W. Sutherland. Aug. 31, 2005
 Lecture #2 Prof. John W. Sutherland Aug. 31, 2005 Our View of Quality Today s attitude much different (hopefully) than two decades ago. The statistical theory has remained the same... Philosophy underlying
Total Quality Service. Unit 5
 Total Quality Service Unit 5 1 What is TQM? Total quality management (TQM) is an approach for continuously improving the quality of every aspect of business life.it is a never ending process of improvement
Engenharia e Tecnologia Espaciais ETE Engenharia e Gerenciamento de Sistemas Espaciais
 Engenharia e Tecnologia Espaciais ETE Engenharia e Gerenciamento de Sistemas Espaciais SITEMA DE GESTÃO DA QUALIDADE SEIS SIGMA 14.12.2009 SUMÁRIO Introdução ao Sistema de Gestão da Qualidade SEIS SIGMA
Consider the view from an airplane. When the airplane is at an elevation of
 C ONTROL CHARTS AND PROCESS CAPABLTY 30,000-Foot-Level Performance Metric Reporting UNDERSTANDNG AND MPROVNG PROCESSES FROM A BRD S-EYE VEWPONT By Forrest W. Breyfogle, Smarter Solutions nc. Consider the
Monitoring of the Production Process in Mass Production of Dimensionally Accurate Products
 Monitoring of the Production Process in Mass Production of Dimensionally Accurate Products Jozef Dobránsky 1, Juraj Ružbarský 1, Dušan Manduľák 2, Eva Vojnová 2 1 Technical University of Košice, Faculty
Quality Control Introduction to Quality
 Quality Control Introduction to Quality What is Quality? Definitions of Quality Degree of excellence, or general excellence ( has quality) Attribute or faculty ( Has many good qualities) Relative nature,
Chapter 9A. Process Capability & SPC
 1 Chapter 9A Process Capability & SPC 2 OBJECTIVES Process Variation Process Capability Process Control Procedures Variable data Attribute data Acceptance Sampling Operating Characteristic Curve 3 Basic
Lean Six Sigma Green Belt Supplement
 Problem Solving and Process Improvement Tools and Techniques Guide Book Lean Six Sigma Green Belt Supplement Max Zornada, University of Adelaide Executive Education 7 th Floor, 10 Pultney Street, Adelaide,
Chapter 5: product Design and Quality Function Deployment
 Chapter 5: product Design and Quality Function Deployment (QFD) Learning Outcomes After successful studying this chapter You should be able to Define what is QFD? Discuss the benefits of QFD Explain the
Methods Engineering. Methods Engineering
 Methods Engineering 1 Methods Engineering Part II Chapters: 8. Introduction to Methods Engineering and Operations Analysis 9. Charting Techniques 10.Motion Study and Work Design 2 1 Chapter 8 Introduction
Six Sigma Black Belt Study Guides
 Six Sigma Black Belt Study Guides 1 www.pmtutor.org Powered by POeT Solvers Limited. Overview of Six Sigma DMAIC Define Define the project targets and customer (internal and external) deliverables. Measure
Continuous Improvement Toolkit. Pareto Analysis. Continuous Improvement Toolkit.
 Continuous Improvement Toolkit Pareto Analysis The Continuous Improvement Map Managing Risk FMEA Understanding Performance Check Sheets Data Collection PDPC RAID Log* Risk Assessment* Fault Tree Analysis
LEAN PRODUCTION SYSTEM
 LEAN PRODUCTION SYSTEM Introduction Lean Overview Process Control Tools 1. Flow Chart / Diagram 2. Check Sheet 3. Histogram 4. Pareto Chart / Diagram 5. Cause-and-Effect Diagram 6. Why-Why Diagram 7. Scatter
RESEARCH PAPERS FACULTY OF MATERIALS SCIENCE AND TECHNOLOGY IN TRNAVA SLOVAK UNIVERSITY OF TECHNOLOGY IN BRATISLAVA
 RESEARCH PAPERS FACULTY OF MATERIALS SCIENCE AND TECHNOLOGY IN TRNAVA SLOVAK UNIVERSITY OF TECHNOLOGY IN BRATISLAVA 202 Special Number THE STATISTICAL REGULATION OF THE TURNING PROCESS Katarína LESTYÁNSZKA
Industrial Problem Solving
 Industrial Problem Solving Presented by Chris Butterworth Six Sigma Master Black Belt Chris Butterworth ASQ Certified Six Sigma Master Black Belt 30+ years experience in Manufacturing Inspector - Quality
9. Project Quality Management- Introduction
 Construction Project Management (CE 110401346) 9. Project Quality Management- Introduction Dr. Khaled Hyari Department of Civil Engineering Hashemite University Content Quality: What? (The concept of quality)
QUALITY MANAGEMENT organization
 Quality Management Definition: Quality management is the act of overseeing all activities and tasks needed to maintain a desired level of excellence. This includes the determination of a quality policy,
APPLICATION OF FUZZY LOGIC APPROACH IN STATISTICAL CONTROL CHARTS
 Global and Stochastic Analysis Vol. 4 No. 1, January (2017), 139-147 APPLICATION OF FUZZY LOGIC APPROACH IN STATISTICAL CONTROL CHARTS *SAKTHIVEL.E, SENTHAMARAI KANNAN.K, AND LOGARAJ. M Abstract. Control
CERTIFIED QUALITY PROCESS ANALYST BODY OF KNOWLEDGE
 CERTIFIED QUALITY PROCESS ANALYST BODY OF KNOWLEDGE Included in this body of knowledge (BOK) are explanations (subtext) and cognitive levels for each topic or subtopic in the test. These details will be
NHS Improvement An Overview of Statistical Process Control (SPC) October 2011
 October 2011") NHS Improvement An Overview of Statistical Process Control (SPC) October 2011 Statistical Process Control Charts (X, Moving R Charts) What is Statistical Process Control (SPC)? We all know that measurement
NHS Improvement An Overview of Statistical Process Control (SPC) October 2011 Statistical Process Control Charts (X, Moving R Charts) What is Statistical Process Control (SPC)? We all know that measurement
Principles of Operations Management: Concepts and Applications Topic Outline Principles of managing Operations (PMO)
") Principles of Operations Management: Concepts and Applications Topic Outline Principles of managing Operations (PMO) Session 1: Operations Management Foundations Define the science and practice of operations
Principles of Operations Management: Concepts and Applications Topic Outline Principles of managing Operations (PMO) Session 1: Operations Management Foundations Define the science and practice of operations
Statistical Process Control
 FH MAINZ MSC. INTERNATIONAL BUSINESS Statistical Process Control Application of Classical Shewhart Control Charts February Amelia Curry Matrikel-Nr.: 903738 Prepared for: Prof. Daniel Porath Due Date:
Product, Service & Process Design
 Strategies for new product introduction market pull we make what we can sell example: food industry technology push we sell what we can make example: electronics inter-functional view example: personal
JICA Project Briefing Paper
 JICA Project Briefing Paper TQM IN JAPAN Deming, Juran and Ishikawa Dennis S. Tachiki Faculty of Business Administration Tamagawa University tachiki@bus.tamagawa.ac.jp If Japan can achieve high quality
UNIT-4 ====================================================================== UNIVERSITY SYLLABUS
 UNIT-4 ====================================================================== UNIVERSITY SYLLABUS Quality Control: Meaning, process control, SQC control charts, single, double and sequential sampling,
CSU Project Management Certificate Program
 CSU Project Management Certificate Program Project Quality Management Instructor: Ric Rothschild, PMP Contact Info: ric.rothschild@comcast.net 303-664-1117 1 Project Quality Management Agenda Introduction
PMPA Tech Conference Do we have the Tools and Knowledge to weather the Storm?
 PMPA Tech Conference 2014 Do we have the Tools and Knowledge to weather the Storm? Quality Initiatives Malcolm Baldrige National Quality Award ISO Standards (ISO 9001, ISO 14001, AS 9100, ETC ) Six Sigma
Process Improvement Sudies in Appliance Manufacturing
 ABSTRACT Process Improvement Sudies in Appliance Manufacturing Dr. Hulya Yazici Arcelik A.S. The study illustrates the use of SAS/QC, STAT modules of SAS Institute for computerized process data analysis.
Seven Basic Quality Tools. SE 450 Software Processes & Product Metrics 1
 Seven Basic Quality Tools SE 450 Software Processes & Product Metrics 1 The Seven Basic Tools Checklists (Checksheets) Pareto Diagrams Histograms Run Charts Scatter Diagrams (Scatter Plots) Control Charts
I/A Series Software Statistical Process Control Package (SPCP)
") I/A Series Software Statistical Process Control Package (SPCP) The SPCP is an application software package that provides on-line displays of Statistical Process Control (SPC) charts for analysis of process
I/A Series Software Statistical Process Control Package (SPCP) The SPCP is an application software package that provides on-line displays of Statistical Process Control (SPC) charts for analysis of process
UNIT I - INTRODUCTION
 UNIT I - INTRODUCTION Definition of Quality, Dimensions of Quality, Quality Planning, Quality costs Analysis Techniques for Quality Costs, Basic concepts of Total Quality Management, Historical Review,
STATISTICAL QUALITY CONTROL. Majid Rafiee Department of Industrial Engineering Sharif University of Technology
 STATISTICAL QUALITY CONTROL Majid Rafiee Department of Industrial Engineering Sharif University of Technology rafiee@sharif.ir Quality Improvement in Modern Business Environment Copyright Notice Parts
Lesson 14 Statistical Process Control
 Lesson 14 Statistical Process Control purpose is to assure that processes are performing in an acceptable manner Out of Control Center 0 1 3 4 5 6 7 8 9 10 11 1 13 14 15 Sample number 14-1 Inspection Before/After
Process Validation& Contents Uniformity in Tablets via Quality Tools and Process Capabilities
 IOSR Journal of Pharmacy and Biological Sciences (IOSR-JPBS) e-issn: 2278-3008, p-issn:2319-7676. Volume 9, Issue 1 Ver. IV (Jan. 2014), PP 67-74 Process Validation& Contents Uniformity in Tablets via