E-TRAINING ON COMPILATION OF SUT
|
|
|
- Geraldine Beatrix Byrd
- 6 years ago
- Views:
Transcription
1 E-TRAINING ON COMPILATION OF SUT IN AFRICA ACS/ESNA 2017 Session 3: Steps for compilation of SUTs
2 Outline of presentation 1. Outline of Steps to compile SUTs 2. Establishing five tables (unbalanced) Table 1: Supply table at basic prices (domestic production table and import table); Table 2: Valuation tables (taxes less subsidies on products, margins); Table 3: Intermediate consumption at purchasers prices; Table 4: Final uses at purchasers prices; Table 5: Value added at basic prices by industry and its components
3 Outline of Steps to compile SUTs (1/3) Step 1: Finalise the groups of industries and products to be included in the SUTs. The criteria for grouping the industries and products should be that They are relevant and important to the economy; They exhaustively cover the entire spectrum of productive activities and products according to ISIC and CPC classes, respectively Step 2: Identify and finalise the data sources and methods which will be used to estimate gross value of output, intermediate consumption, value added components in a cross-classification of sectors and industries with product break-down; foreign trade; taxes and subsidies on products; final consumption expenditure of households, NPISHs and government; and gross fixed capital formation, change in inventories and acquisition less disposal of valuables with product break-down.
4 Outline of Steps to compile SUTs (2/3) Step 3: Compile preliminary control figures for the total economy using the data sources: Industry-wise gross value of output, intermediate consumption, value added components Imports and exports of goods and services; taxes and subsidies on products; final consumption expenditure of households, NPISHs and government; and gross fixed capital formation, change in inventories and acquisition less disposal of valuables Step 4: Compile product level break-down of control figures using the data sources to fill up the cells of SUTs. The resultant supply and use tables will be unbalanced and show discrepancies between supplies and uses at individual product level Step 5: Review the control figures, product level break-downs by revisiting data sources and apply balancing methods to achieve product balances for each individual product group, in order to finally produce a balanced set of supply and use tables Compile GDP estimates from three approaches, goods and services account, production account and generation of income account
5 Outline of Steps to compile SUTs (3/3) Further steps required if the NSO decides also to compile SUTs at constant (or previous year) prices and to transform the SUTs to input output tables Step 6: Compile valuation matrices of trade margins, freight transport costs, taxes and subsidies on products, and imports in the structure of use table Deduct these matrices from the use table at purchasers prices (at cell level), to produce the use table at basic prices. Supply table at basic prices is already available before its transformation to purchasers prices Supply table at basic prices Domestic production + imports Use table at basic prices Use table at purchasers prices (IC + final consumption + GCF + exports) trade margins freight transport costs taxes on products + subsidies on products Step 7: Identify and compile price indices (or volume indicators) at cell level in the supply and use tables at basic prices Apply double deflation for value added and deflation for final uses, and balance the two tables to produce SUTs at constant (or previous year) prices
6 Establishing five tables of SUTs
7 Table 1 (part): Domestic production at basic prices Table 3: Intermediate consumption at purchasers prices Table 5: Gross value added and its components (1/4) Production is an activity carried out under the responsibility, control and management of an institutional unit that uses inputs of labour, capital, and goods and services to produce outputs of goods and services The main data sources for the three tables are the Administrative data (for example, agriculture, mining, electricity, transportation, government services, accounts of companies, etc.) Establishment surveys or censuses on mining, manufacturing and services Population census (for dwellings) Other surveys (household budget surveys for estimating output of some products from expenditures, labour force surveys for informal sector, paid domestic services, etc.) and adhoc sources (such as research studies done on underground or illegal activities) The data available at the establishment level facilitates (in a cross-classification of sectors and industries) in the compilation of Table 1: Output of goods and services at basic prices Table 3: Intermediate consumption at purchasers prices Table 5: Gross value added at basic prices and its components
8 Tables 1, 3 and 5. (2/4) First step in compiling these three tables is to establish preliminary control figures of domestic production, intermediate consumption and gross value added components for the total economy. This step is similar to the regular annual GDP estimation procedures. The compilation is undertaken by analyzing all the data sources identified and finalised for compiling SUTs. The following table needs to be compiled for each of the 5 institutional sectors. Final table showing grand total for the total economy is obtained by summing up the 5 tables The final table gives control figures for Tables 1, 3 and 5 of SUTs. These control figures are the marginal totals shown in the last rows under the columns of industries in SUTs Industrie s included in SUT Gross value of output at basic prices Intermed iate consump tion at purchase rs prices Gross value added at basic prices Compens ation of employe es Other taxes less subsidies on productio n Consump tion of fixed capital Net operating surplus/ mixed income
9 Tables 1, 3 and 5. (3/4) The next step (which can also be carried out simultaneously while analyzing the source data for establishing control figures) is to compile product break-down of control figures for production and intermediate consumption for each of the columns of industries. No further detailed information is needed for Table 5, once the control figures are established for industries. For government units, data source is the government accounts Only partial product level details of expenditures may be available in budgets. For more detailed data at product level, major government departments may be requested to provide expenditures details with product break-down For non-government units (corporations and household enterprises), Corporations: Partial data at product level may be available in their accounts Carefully designed business surveys may provide detailed product level information (UNIDO developed model questionnaires with the purpose of meeting the requirements of national accounts as well as the SUTs) Household/informal sector surveys may only provide limited information to estimate output, intermediate consumption and value added; and data at product level may not be available Input output surveys, research studies and consultation with subject specialists and industry experts could be other sources to estimate ratios on output and intermediate consumption profile.
10 Input-output surveys Tables 1, 3 and 5. (4/4) In the focused input-output surveys, a few establishments under each economic activity are selected (frame from the business register or annual enterprise surveys or economic censuses) and a questionnaire is sent to them to provide detailed information on product profile of output, intermediate consumption, inventories and value added components. The ratios built up from the results of these surveys can be applied on the control figures discussed earlier Dealing with mis-classified and unidentified products reported in the source data It is often observed that units report a part of product level information under others, fuels, office expenses, miscellaneous, etc. There may also be cases of misclassification at the coding stage. For allocating them to the SUTs products One option is to use ratios built up from input-output surveys, if available Another option is to allocate the values of these items to a set of product codes outside the SUT product codes, to be adjusted at the time of balancing. For example, if SUTs include 50 products, others, fuels, office expenses, miscellaneous can be allocated product codes of 51, 52, 53, 54 respectively. At the time of balancing, the values under 51 to 54 will be allocated among the 50 products.
11 Table 1 (part): Import of goods and services Table 4 (part): Export of goods and services (1/3) Trade statistics on imports and exports of goods are based on customs records. These follow HS classification (6-digit). Other agencies compiling trade statistics may follow either HS or SITC classification (5-digit) Data on imports and exports of services is available from the BoP, mostly from central bank BoP shows imports and exports of goods in a single row, but shows services against a. Manufacturing services on physical inputs owned by others; b. Maintenance and repair services n.i.e.; c. Transport; d. Travel; e. Construction; f. Insurance and pension services; g. Financial services; h. Charges for the use of intellectual property n.i.e.; i. Telecommunications, computer and information services; j. Other business services; k. Personal, cultural and recreational services; and l. Government goods and services n.i.e.
12 Tables 1 and 4.. (2/3) Establishing control figures of imports and exports The control figures should be those reported in the BoP, as SNA and BoP are conceptually aligned. If any adjustments are carried out for illegal or border trade in national accounts, the BoP data should be adjusted in the first place. For the control figures of exports of goods and services to be used in SUT, values provided in the BoP can be used as such, as both use f.o.b. valuation. Most likely, the BoP includes non-residents purchases in the economy under travel item. If not, this item should be estimated and added to the exports values shown in BoP For import of goods, the SUT requirement is that they should be valued on c.i.f. basis. The BoP shows total import of goods on f.o.b. basis, but may also show separately the values of c.i.f./f.o.b. adjustment. Therefore, it is possible to compile total value of goods imported on c.i.f. basis. For import of services, the values shown in BoP should be adjusted for the difference in import of goods on c.i.f. and f.o.b. against imports of insurance and freight transport services
13 Tables 1 and 4..(product break-down) (3/3) Goods Source of data for product break-down of imports and exports of goods is the merchandise trade statistics Data available according to HS/SITC needs to be converted to CPC. A simpler method is to use SUT product codes directly on the source data, as these codes are fewer in number as compared to the CPC. The difference between the control figures for imports and exports of goods as available from the BoP and the merchandise trade data, should be adjusted at the time of balancing the SUTs. Services Broad product level break-down of services is available in the BoP. C.i.f/f.o.b. adjustment may have to be made against the rows of insurance and freight transport services of imports. Travel item in BoP most likely includes purchases of residents abroad and non-residents purchases in the economy. If not, adjustments have to be made in imports and exports data This item includes many products. If product level data can be estimated using tourism satellite accounts, imports and exports of products may be adjusted accordingly
14 Table 2: Trade margins columns (1/2) Trade margins include Output of traders (which is derived as the difference between the sale and purchase value of traded goods) Secondary output of other industries (several industries (other than trade), sell some products in the same condition as they are purchased. The margin from such sales is trade product of these industries) Data required for supply table is trade margins by products for the total economy Usually, the enterprise surveys and business accounts provide data on total trade margins only Very few countries are able to collect information on trade margins by products through surveys Therefore, data on trade margins by products is mostly estimated through indirect methods.
15 Table 2: Trade margins columns (2/2) The indirect method involves four steps: estimating total output of trade (in the supply table), which is equivalent to the sum of output of principal product of trading industry and output of trade product of other industries; estimating (or assuming) trade margin ratios for each product; estimating trade margins for each product (only goods) by applying the trade margin ratios on the product s output at basic prices; and finally, adjusting the trade margins for each product to the control figure, which is the total output of trade product These trade margin ratios for different products can be estimated on the basis of small surveys of wholesalers and retailers It is advisable to estimate trade margins by products separately for wholesale and retail trade, as trade margin ratios are different for the same product in the hands of wholesalers and retailers, especially for the agricultural and perishable goods
16 Table 2: Columns of freight transport costs The requirement of data is transport costs with product break-down for the total economy. As in the case of trade, the transport costs can also be estimated through indirect methods, in the absence of direct product-wise information on transport costs from the enterprise surveys. The procedure is exactly the same as mentioned under trade margins. It is also advisable to estimate transport costs by products, separately for each means of transport, namely, railways, road, air, and water, if feasible.
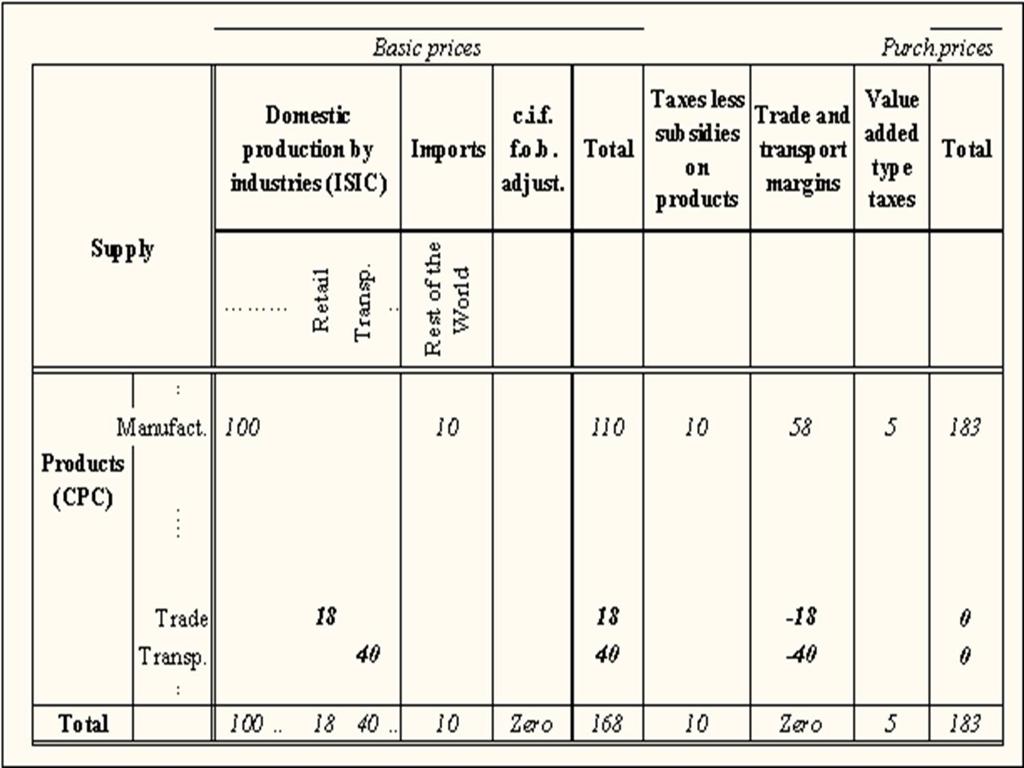
17 Table 2: Avoid double-counting of trade and freight transport The gross output of trade and transport need to be included as part of domestic gross output. They are shown in the output matrix like that of any other industry. However, these same gross outputs of trade and freight transport products are needed to be allocated to products valued at basic prices to bring them up to purchasers prices At purchasers prices, there are no trade and freight transport margins on products as their values are subsumed in the values of goods. The next table shows how we avoid counting gross output of trade and freight transport twice.
18
19 Table 2: Columns of taxes and subsidies on products Data on taxes and subsidies on products are available from the government budget documents or tax authorities. Sometimes, product-wise tax data (excise duties, sales tax or VAT) may not be available. In such cases, countries first need to estimate product taxes for each product on the basis of average tax rates (output at basic prices multiplied by average tax rate) and then adjust these to the control figure of total product taxes on pro-rata basis. This may be done for each type of tax on product (excise, VAT, sales tax, import duties, etc.), as tax rates are different for different types of taxes on the same product. Industry surveys may also provide information on taxes and subsidies paid/received by the producers, but the summation of these may not tally with the government records.
20 Table 4: Consumption expenditure of NPISHs NPISHs are legal or social entities created for the purpose of producing services (and sometimes goods) on a non-market basis mainly financed by donations or regular subscriptions not a source of income, profit or other financial gain for the units that establish, control or finance them. can have surpluses but cannot be appropriated by those which establish them. Final consumption expenditures of NPISHs equals the gross output of producers of NPISHs services less sales of non-capital goods and services plus social transfers in kind. The final expenditures of NPISHs are classified according to classification of the purposes of non-profit institutions (COPNI) (housing, health, recreation and culture, education, social protection, religion, political parties, labour and professional organizations) : These need to be converted to a product classification for use table. Data sources: tax authorities collect accounts of NPISHs, though exempt from taxation.. economic censuses, enterprise surveys, annual accounts, labour force surveys. BoP on current transfers made to NPISHs 20
21 Table 4: GFCE (1/4) GFCE equals government output, less value of government sales of non-capital goods and services, plus social benefits in kind. Output of government services is measured on the cost basis Other government expenditures such as subsidies to industries, interest payments, costs of capital goods procurement, transfers, etc. do not form part of output Sales include receipts from fees and charges that are not economically significant and, to a minor extent, receipts from sales of market output GFCE includes Expenditure on individual services and collective services produced by government itself that are supplied free or at prices not economically significant Individual final consumption expenditures consist services, mainly of (a) Health, (b) Recreation, culture and religion, (c) Education, (d) Social security and welfare, and (e) Housing, refuse collection and sewerage. Main characteristic of individual consumption expenditure is that, it must be possible to observe and record the acquisition of the good or service by an individual household or member and also the time at which it took place 21
22 Table 4: GFCE (2/4) Collective final consumption expenditures include only services with the following characteristics: (a) Collective services can be delivered simultaneously to every member of the community or of particular sections of the community; (b) The use of such services is usually passive and does not require the explicit agreement or active participation of all the individuals concerned; (c) The provision of a collective service to one individual does not reduce the amount available to others in the same community or section of the community. There is no rivalry in acquisition. Current expenditures defined as collective fall under the broad headings of general public services, defense, public order and safety, economic affairs and environment protection but they also include certain expenditures under housing, health, recreation and culture, education and social protection that are considered to benefit the community at large. 22
23 Table 4: GFCE (3/4) Social benefits in kind include expenditure on consumption goods and services purchased by government from market producers and supplied directly to households without further processing This is not government output, but is part of GFCE These goods and services are valued at purchasers prices The government consumption expenditures are recorded according to the classification COFOG Sources of data are the accounts of government units at all levels and/or the budget documents. 23
24 Table 4: Column of GFCE in use table (4/4) For the GFCE column, it is necessary that government expenditures are classified under different functions (or purposes) of the government according to COFOG, in as much detail as possible The GFCE data can further be classified as individual consumption and collective consumption the detailed data on government expenditures compiled according to COFOG can easily be translated to ISIC/CPC using the concordance tables available between the purposes (COFOG) and the industries (ISIC) and products (CPC). Some developing countries show GFCE only under three broad product groups of education and health (individual); and Public administration and defence; compulsory social security (collective)
25 Table 4: HFCE (1/3) Household final consumption expenditures include: All purchases of consumer non-durable and durable goods except dwellings and valuables; Imputed purchases of consumer durables by financial leasing; Imputed gross rental for owner-occupied housing services; Own-account production and consumption of goods Bartered consumer goods and services (net); Domestic services provided by domestic servants; Goods and services in kind provided by enterprises as wages; Imputed financial intermediary (banking, insurance, etc.) service charges; fees paid to government and NPISHs, fees for all kinds of licences and permits Purchases by residents abroad; (Minus) Purchases by non-residents at home. 25
26 Table 4: HFCE (2/3) HFCE is recorded at purchasers prices paid by households including any transport charges and taxes on products that are payable at the time of purchase Individual consumption expenditure of households includes a number of imputed expenditures. Goods consumed out of own production is valued at purchasers prices, although it is same as basic prices, since there are no trade and transport margins and taxes. Income in kind is valued at purchasers prices if the employer purchased the products that are provided to employees. It is valued at producers prices if the products are produced by the enterprise itself. Data sources for estimating HFCE are the household incomeexpenditure surveys, retail trade surveys and other administrative data. Commodity flow approaches are widely used to estimate the HFCE 26
27 Table 4: Column of HFCE in the use table (3/3) The main data source is the household expenditure survey or the household income and expenditure survey (HIES) Supplemented with administrative data (e.g. alcohol sales, utilities sales to households, etc.) and commodity flow methods Household surveys to under estimate household expenditures, especially for services. Therefore, even if a country has good HIES, commodity flow methods become necessary for validation and consistency of data. Product level break-down of household expenditures, at very detailed level is generally available in the surveys, which can be used to fill the cells in the column of HFCE in the use table. The HFCE estimates based on HIES and commodity flow method, at product level should be reconciled carefully at the time of manual balancing 27
28 Adjustment items for HFCE Adjustment for purchases of residents abroad Direct purchases by residents abroad are treated as both imports and HFCE These values are shown in the adjustment rows under imports in supply table under HFCE in use table ESA recommends (i) distributing these expenditures to different products, not in a single adjustment row and (ii) allocating part of these expenditures to intermediate consumption in the case of business travels. Adjustment for purchases of non-residents in the domestic market Direct purchases in the domestic market by non-residents are shown under exports and also as a negative entry under HFCE in the use table, in a separate row at the end of the product rows These adjustment rows are not required if the HFCE is based on household expenditure survey (since it does not cover non-residents) and if balance of payments include data on such purchases by residents/non-residents 28
29 Table 4: Actual final consumption The use table also has a provision to record actual final consumption of households, NPISHs and general government Of these, conventionally, the NPISHs do not have actual final consumption, as their expenditures are of the nature of individual final consumption and, therefore, become part of household actual final consumption. The actual final consumption of general government is its collective consumption expenditure. The individual consumption expenditure of general government becomes part of actual final consumption of households. Thus, the actual final consumption of households includes: Household final consumption expenditures; Final consumption expenditures of NPISHs; and Individual final consumption expenditures of general government 29
30 Table 4: Gross fixed capital formation (1/4) Gross capital formation: comprises gross fixed capital formation, changes in inventories and acquisition less disposal of valuables Gross fixed capital formation (GFCF) includes all expenditure by producers on acquisitions less disposals of produced fixed assets to be used in the production process, such as vehicles, machinery, equipment, buildings and other construction works, cultivated biological resources, weapons systems; intangible assets of computer software, mineral exploration, and literary, artistic and entertainment originals; certain additions or major improvements to non-produced tangible assets (land and sub-soil assets) major renovations to existing assets, own account GFCF capital transfers in kind and fixed assets acquired through barter 30
31 Table 4: Gross fixed capital formation (2/4) SNA recommends for GFCF data to be shown by following types of assets (i) (ii) (iii) (iv) (v) (vi) Dwellings Other buildings and structures Machinery and equipment Weapons systems Cultivated biological resources Costs of ownership transfer on non-produced assets (vii) Intellectual property products 31
32 Table 4: Gross fixed capital formation (3/4) GFCF estimates are based on construction surveys, building permits, enterprise surveys, accounts of corporations and NPISHs, government budget documents, foreign trade statistics and the household surveys (on own account construction). commodity flow methods are widely adopted to estimate GFCF by developing countries. GFCF is valued at purchasers prices and include costs of transport and installation and any fees or taxes for transfer of ownership. Own-account GFCF at basic prices or at the costs of production plus estimated operating surplus. 32
33 Table 4: Gross fixed capital formation (4/4) Asset-wise estimates of GFCF are usually compiled and these can easily be mapped to products in the use table Commodity flow methods adopted can also facilitate easy identification of products of GFCF. Output of construction on the supply side can be recorded as GFCF against construction product, after adjusting for minor repairs and maintenance and acquisition costs Output of work-in-progress for cultivated biological resources estimated on the supply side can be allocated to agriculture or livestock products on the use side against GFCF/CII, as the case may be Output of intellectual property products estimated on the supply side can be allocated to corresponding products on the use side Output of industrial machinery and goods that are partly consumption and partly capital (laptops, vehicles) can be allocated to the corresponding products as in the supply table 33
34 Table 4: Change in inventories (1/2) Changes in inventories are measured by value of entries into inventories less value of withdrawals and less value of any recurrent losses of goods held in inventories during the accounting period Inventories are usually classified into three broad categories Finished goods include goods acquired for resale by wholesalers and retailers, all goods stored by government as strategic reserves, such as food and fuel, and finished goods that are awaiting delivery to customers. Materials and fuels include raw materials and supplies which will be used up as intermediate consumption in the course of production in a future year. Work-in-progress consists of goods and services on which some processing has taken place but which are not yet in a finished form suitable for delivery to customers. In agriculture, work-in-progress consists of the natural growth of vineyards, orchards, plantations and timber tracts and the natural growth in livestock that are being raised for slaughter or milk 34
35 Table 4: Change in inventories (2/2) Sources of data for CII are the same as those used for estimating domestic production, intermediate consumption and value added components Data available from these sources is mostly finished products, semifinished products and raw materials and components, without detailed product break-down Assumptions may have to be made on the product profile of change inventories available in the source data Mostly, finished and semi-finished products can be allocated to the main product of the industry (same treatment as in the supply table, where these two items are added to the output of main product) Allocation of raw materials and components can be based on industry characteristics. If the survey includes separate questions for raw materials, chemicals, fuel, packing material, etc., allocation to products becomes easier. 35
36 Valuables: Table 4: Valuables Are produced goods of considerable value that are not used primarily for purposes of production or consumption but are held as stores of value over time. Are expected to appreciate or at least not to decline in real value, nor to deteriorate over time under normal conditions. They consist of precious metals and stones, jewellery, works of art, etc. Acquisitions of valuables are valued at their purchase prices together with associated costs of ownership transfer. Disposals are valued at their sale prices less any associated costs of ownership transfer. Supply of valuables can be estimated using the commodity flow methods Valuables mostly belong to few product groups included in SUTs, therefore, allocation to products in the use table is based on supply 36
37 Worked examples Example of compiling SUT 37
38 Suggested reading material Handbook on SUT: Compilation, Application, and Practices Relevant to Africa (Draft), UNECA The 2008 SNA, European Commission, IMF, OECD, UN, World Bank, 2009; Chapter 14: The supply and use tables and goods and services account Eurostat Manual of Supply, Use and Input-Output Tables, European Union (2008) Chapters 3 to 5

39 THANK YOU
E-TRAINING ON COMPILATION OF SUT
 E-TRAINING ON COMPILATION OF SUT IN AFRICA ACS/ESNA 2017 Session 2: Supply and Use Tables Overview of supply and use tables Structure of supply table domestic production columns Outline of presentation
E-TRAINING ON COMPILATION OF SUT
 E-TRAINING ON COMPILATION OF SUT IN AFRICA ACS/ESNA 2017 Session 1-Reading Materials: GDP Estimation by Production, Income and Expenditure Approaches GDP estimation by production, income and expenditure
Compilation of use tables at basic prices and split to domestic production and imports in Hungary
 22nd International Input-Output Conference Lisbon, Portugal, July 14 18, 2014 Compilation of use tables at basic prices and split to domestic production and imports in Hungary Mária Forgon and Éva Varga
Introduction to Supply and Use Tables, part 2 Data Sources and Compilation 1
 Introduction to Supply and Use Tables, part 2 Data Sources and Compilation 1 Introduction This paper continues the series dedicated to extending the contents of the Handbook Essential SNA: Building the
E-TRAINING ON COMPILATION OF SUT
 E-TRAINING ON COMPILATION OF SUT IN AFRICA ACS/ESNA 2017 Session 9- Informal sector Outline of the presentation Informal economy Operational guidelines for identifying informal sector and Informal employment
METHODOLOGICAL EXPLANATION INPUT-OUTPUT TABLES, SUPPLY AND USE TABLES
 METHODOLOGICAL EXPLANATION INPUT-OUTPUT TABLES, SUPPLY AND USE TABLES This methodological explanation relates to the data release: - Supply and use tables, input-output tables, Slovenia, annually (First
Lesson IV: Economic Flows and Stocks
 Lesson IV: Economic Flows and Stocks An Introduction to System of National Accounts - Basic Concepts Sixth e-learning Course on the 2008 System of National Accounts September November 2014 1 Content Definition
Statistical experience in compiling the input-output tables (IOT) based on the Chilean National Accounts 2008 Benchmark Compilation 1
 based on the Chilean National Accounts 2008 Benchmark Compilation 1") Statistical experience in compiling the input-output tables (IOT) based on the Chilean National Accounts 2008 Benchmark Compilation 1 Simón Guerrero H. 1 This paper is based on the methodological developments
Statistical experience in compiling the input-output tables (IOT) based on the Chilean National Accounts 2008 Benchmark Compilation 1 Simón Guerrero H. 1 This paper is based on the methodological developments
Annual GDP by production approach in current and constant prices: main issues 1
 Annual GDP by production approach in current and constant prices: main issues 1 Introduction This paper continues the series dedicated to extending the contents of the Handbook Essential SNA: Building
The Supply and Use Framework of National Accounts
 The Supply and Use Framework of National Accounts Joerg Beutel Konstanz University of Applied Sciences, Konstanz, Germany beutel@htwg-konstanz.de 1. Introduction The System of National Accounts 2008 -
Eurostat s ESA 95 manual on Input-Output: Valuation matrices (First complete draft)
") 13 th International Conference on Input-Output Techniques 21 25 August 2000, Macerata, Italy Session 10.4 Eurostat s ESA 95 manual on Input-Output: Valuation matrices (First complete draft) Norbert RAINER
13 th International Conference on Input-Output Techniques 21 25 August 2000, Macerata, Italy Session 10.4 Eurostat s ESA 95 manual on Input-Output: Valuation matrices (First complete draft) Norbert RAINER
Intellectual property
 Intellectual property products and macroeconomic statistics Presentation to IGA seminar "Economic globalisation: addressing measurement challenges related to IPPs" 16 March 2018, Luxembourg Content IPP
OPENING SECTION: INTRODUCTION TO THE CAPACITY BUILDING PROGRAMME ON THE COMPILATION OF THE SUPPLY AND USES TABLE (SUTS) IN AFRICA
 IN AFRICA") OPENING SECTION: INTRODUCTION TO THE CAPACITY BUILDING PROGRAMME ON THE COMPILATION OF THE SUPPLY AND USES TABLE (SUTS) IN AFRICA Economic Statistics and National Accounts Section ACS, UNECA at The UNECA/OECD/WB/WTO
OPENING SECTION: INTRODUCTION TO THE CAPACITY BUILDING PROGRAMME ON THE COMPILATION OF THE SUPPLY AND USES TABLE (SUTS) IN AFRICA Economic Statistics and National Accounts Section ACS, UNECA at The UNECA/OECD/WB/WTO
PART IV. Conceptual and Theoretical Issues
 PART IV Conceptual and Theoretical Issues 14. The System of Price Statistics A. Introduction 14.1 This chapter is about value aggregates and their associated price indices in an integrated system of economic
Table of contents for Statistics Denmark s input-output tables, 69 industries including two preliminary years. New edition in English, June 2016.
 Table of contents for Statistics Denmark s input-output tables, 69 industries including two preliminary years. New edition in English, June 2016. Matricer Name Row Col From To DZB_fyy 69 69 Danish industries
Balance of Payments Classification of Services Progress and Unresolved Issues. Note by OECD Statistics Directorate
 ESA/STAT/AC.103/20 21 June 2005 UNITED NATIONS DEPARTMENT OF ECONOMIC AND SOCIAL AFFAIRS STATISTICS DIVISION Meeting of the Expert Group on International Economic and Social Classifications New York, 20-24
Gross Capital Formation in current and constant prices, part 1: Gross Fixed Capital Formation 1
 Gross Capital Formation in current and constant prices, part 1: Gross Fixed Capital Formation 1 Introduction This paper continues the series dedicated to extending the contents of the Handbook Essential
TFSITS (06) 4. Balance of Payments Classification of Services. Update on Progress and a Look at the Remaining Issues
 4. Balance of Payments Classification of Services. Update on Progress and a Look at the Remaining Issues") TFSITS (06) 4 Balance of Payments Classification of Services Update on Progress and a Look at the Remaining Issues Draft Note by OECD Statistics Directorate February 2006 Introduction 1. This paper updates
TFSITS (06) 4 Balance of Payments Classification of Services Update on Progress and a Look at the Remaining Issues Draft Note by OECD Statistics Directorate February 2006 Introduction 1. This paper updates
Integration of environmental activity accounts
 Report Integration of environmental activity accounts Statistics Netherlands National Accounts Department Sjoerd Schenau Contact: Sjoerd Schenau (sscn@cbs.nl) Content 1. Introduction 3 2. The issue 4 2.1
Joensuu, Finland, August 20 26, 2006
 Session Number: Session 2C Session Title: New Developments in the Compilation of Supply and Use Tables and Input-Output Tables Session Organizer(s): Liv Hobbelstad Simpson, Statistics Norway, Oslo, Norway
THE PRESENT SITUATION IN THE NATIONAL ACCOUNTS STATISTICS: SOME PROBLEM AREAS
 THE PRESENT SITUATION IN THE NATIONAL ACCOUNTS STATISTICS: SOME PROBLEM AREAS PREPARED BY: HERZIE MOHAMED NORDIN SYED IBRAHIM MOHD JAMALUDIN PRESENTED FOR: REGIONAL COURSE ON SNA 2008 : IMPROVING EXHAUSTIVENESS
National Accounts Framework in the ICP
 Public Disclosure Authorized Public Disclosure Authorized Public Disclosure Authorized Public Disclosure Authorized International Comparison Program National Accounts Framework in the ICP Global Office
Group of Experts on National Accounts Interim meeting on Global Production Geneva, 3-4 April 2013
 Economic Commission for Europe Conference of European Statisticians Group of Experts on National Accounts Interim meeting on Global Production Geneva, 3-4 April 2013 Working paper No. 7: Recording imports
Module One: Review and Assessment of Economic Census Tools. Session 1.3: Fundamental Principles of Questionnaire Design Economic Census / Surveys
 Module One: Review and Assessment of Economic Census Tools Session 1.3: Fundamental Principles of Questionnaire Design Economic Census / Surveys Aloke Kar Indian Statistical Institute Regional Course on
NATIONAL ACCOUNTS METHODS TO ACHIEVE EXHAUSTIVENESS
 Chapter 5 NATIONAL ACCOUNTS METHODS TO ACHIEVE EXHAUSTIVENESS 5.1. Introduction... 69 5.2. Production Approach: General Methods... 70 5.2.1. Introduction... 70 5.2.2. Supply Based Methods... 71 5.2.3.
Input-Output Tables and Multipliers for Scotland 1998
 Input-Output Tables and Multipliers for Scotland 1998 Contents Preface 4 Page Section A - Use of the Scottish Input-Output Tables and Multipliers 7 A1 - Output and Supply (including 10-industry Supply
Foreword. Sarajevo, September Zdenko Milinović
 2 Foreword Development of the Structural Business Statistics started through the support projects to the statistical system of Bosnia and Herzegovina with the objective of training staff for conducting
The Gross National Product (GNP) is GDP added by net foreign income. National Income is GNP deducted by indirect net taxes (net) and depreciation.
 is GDP added by net foreign income. National Income is GNP deducted by indirect net taxes (net) and depreciation.") M E T A D A T A BASIC INFORMATION 1 Data Category : Gross Domestic Product (GDP) 2 Statistics Disseminator : Statistics Department, Bank Indonesia 3 Address : Jl. M.H. Thamrin No. 2 Jakarta 4 Contact :
M E T A D A T A BASIC INFORMATION 1 Data Category : Gross Domestic Product (GDP) 2 Statistics Disseminator : Statistics Department, Bank Indonesia 3 Address : Jl. M.H. Thamrin No. 2 Jakarta 4 Contact :
Goods sent abroad for processing: measuring and recording in the supply and use tables for Estonia
 Goods sent abroad for processing: measuring and in the supply and use tables for Estonia The 20th International Input-Output Conference, Bratislava, June 26-29 2012, Head of Input-Output Table Service,
INTERNATIONAL RECOMMENDATIONS ON DISTRIBUTIVE TRADE STATISTICS
 INTERNATIONAL RECOMMENDATIONS ON DISTRIBUTIVE TRADE STATISTICS ANNOTATED OUTLINE - Draft - INTRODUCTION A. Foreword 1. Historical background The IRDTS were first formulated in 1956 and revised in 1975.
System of National Accounts 2008
 Statistical Commission Fortieth session 24 27 February 2009 Item 3(e) of the provisional agenda Items for discussion and decision: National accounts Background document Available in English only System
What s new? Recent developments in the Task Force on SITS, UNSD and SITS, and the consultation document
 What s new? Recent developments in the Task Force on SITS, UNSD and SITS, and the consultation document Ronald Jansen, Chief International Trade Statistics Section United Nations Statistics Division UNSD
Quarterly National Accounts in Korea. Contributors
 Quarterly National Accounts in Korea No reproduction, copy, transmission or translation of this publication may be made without witten permission. Application should be sent to the National Income Statistics
Regional Workshop on Measuring the Informal Sector and the Non-Observed Economy 4 7 October 2015 Tehran NON OBSERVED ECONOMY IN NATIONAL ACCOUNTS
 Regional Workshop on Measuring the Informal Sector and the Non-Observed Economy 4 7 October 2015 Tehran NON OBSERVED ECONOMY IN NATIONAL ACCOUNTS Bengi YOSUNKAYA (Annual Accounts Group) 1 Content Introduction
EMPIRICAL PROCEDURE IN MEASURING NON-OBSERVED ECONOMY IN GDP ESTIMATES. Dr. Nikos Mylonas, Director of National Accounts of the NSSG,.
 Joint OECD-Eurostat-Russian Statistical State Committee Workshop on Measurement of the Non-Observed Economy Hosted by Russian State Statistical Committee SOCHI, RUSSIAN FEDERATION,16-20 October 2000 EMPIRICAL
United Nations Trade Statistics Perspective. United Nations Statistics Division Trade Statistics Branch
 United Nations Trade Statistics Perspective United Nations Statistics Division Trade Statistics Branch UN Trade Statistics Perspective: Outline UN Comtrade scope The Harmonized System Quantity Data Bilateral
Goods Account (L9) Course on External Sector Statistics Nay Pyi Taw, Myanmar January 19-23, 2015
 Course on External Sector Statistics Nay Pyi Taw, Myanmar January 19-23, 2015") Goods Account (L9) Course on External Sector Statistics Nay Pyi Taw, Myanmar January 19-23, 2015 Reproductions of this material, or any parts of it, should refer to the as the source. Overview of fgoods
Goods Account (L9) Course on External Sector Statistics Nay Pyi Taw, Myanmar January 19-23, 2015 Reproductions of this material, or any parts of it, should refer to the as the source. Overview of fgoods
Draft Version for Second Round of Global Consultation, October Chapter 6: Integrating and presenting the accounts.
 REVISION OF THE SYSTEM OF ENVIRONMENTAL - ECONOMIC ACCOUNTS (SEEA) United Nations Committee of Experts on Environmental Economic Accounting (UNCEEA) Statistics Division / Department of Economic and Social
BOP, EBOPS, CPC & ISIC
 BOP, EBOPS, CPC & ISIC Presentation by Alain Gaugris Trade in Services Unit International Trade Statistics Section United Nations Statistics Division 2 United Nations Plaza, DC2-1535B, New York, New York
ANNUAL QUALITY REPORT
 REPUBLIC OF SLOVENIA ANNUAL QUALITY REPORT FOR THE SURVEY GROSS INVESTMENTS IN FIXED ASSETS (INV-1, INV-3) FOR 2012 Prepared by: Edita Glinšek Date: January 2014 1/1 0 Table of Contents 0 Methodological
LINK BETWEEN THE CLASSIFICATION OF INDIVIDUAL CONSUMPTION BY PURPOSE (COICOP) AND THE CENTRAL PRODUCT CLASSIFICATION (CPC) 1
 AND THE CENTRAL PRODUCT CLASSIFICATION (CPC) 1") LINK BETWEEN THE CLASSIFICATION OF INDIVIDUAL CONSUMPTION BY PURPOSE (COICOP) AND THE CENTRAL PRODUCT CLASSIFICATION (CPC) 1 I. Introduction 1. At the 1996 Joint UNECE/OECD/EUROSTAT National Accounts Meeting,
LINK BETWEEN THE CLASSIFICATION OF INDIVIDUAL CONSUMPTION BY PURPOSE (COICOP) AND THE CENTRAL PRODUCT CLASSIFICATION (CPC) 1 I. Introduction 1. At the 1996 Joint UNECE/OECD/EUROSTAT National Accounts Meeting,
Mini-presentation on Turnover/Output for Office Administrative and Support Activities (ISIC 8210) in Poland
 in Poland") 30 th Voorburg Group Meeting Sydney, Australia September 21 st to September 25 th, 2015 Mini-presentation on Turnover/Output for Office Administrative and Support Activities (ISIC 8210) in Poland Central
30 th Voorburg Group Meeting Sydney, Australia September 21 st to September 25 th, 2015 Mini-presentation on Turnover/Output for Office Administrative and Support Activities (ISIC 8210) in Poland Central
Impact on BOP Data of Changes in International Standards for Processing and Merchanting
 BOPCOM-08/11 Twenty-First Meeting of the IMF Committee on Balance of Payments Statistics Washington, D.C., November 4 7, 2008 Impact on BOP Data of Changes in International Standards for Processing and
Definitions in SNA 2008
 Definitions in SNA 2008 Statistics of International Trade in Service: Challenges and Good Practices Regional Workshop for South-East Asian Countries Hanoi, Vietnam, 30 November 3 December 2010 United Nations
The revision of MSITS : Outline
 Statistics on Trade in Services: New Developments. The revised Manual on Statistics of international Trade in services. (MSITS 2010) Bettina.Wistrom@OECD.org OECD Statistics Directorate Main Sources WTO
10th Meeting of the Advisory Expert Group on National Accounts, April 2016, Paris, France
 SNA/M1.16/4 10th Meeting of the Advisory Expert Group on National Accounts, 13-15 April 2016, Paris, France Agenda item: 4 The Internet economy Introduction This paper presents the challenges which the
Volume measures in national accounts. IMF Statistics Department
 Volume measures in national accounts IMF Statistics Department Outline of this lecture Why volume measures? Volume measures in SNA main principles Methods for deriving volume measures by transaction category
China. Li Shantong and He Janus Data Source. 2. Sector Classification
 China Li Shantong and He Janus 1 1. Data Source The source of the initial input-output (I-O) table for China is "Input-Output Table of China - 2002 from the Department of National Economy Accounting, State
Introduction to Satellite Accounts
 Module-I: LN 8 Lecture Notes Introduction to Satellite Accounts Training Course Material for e-library on System of National Accounts March 2009 Introduction to Satellite Accounts This lecture note is
A Suggestion for SEEA Standard Tables on Energy
 London Group Meeting on Environmental and Economic Accounting 29 September 3 October 2008 EUROSTAT, Brussels, Belgium A Suggestion for SEEA Standard Tables on Energy Ole Gravgård Pedersen Statistics Denmark
Organisation de Coopération et de Développement Economiques Organisation for Economic Co-operation and Development
 OECD OCDE Organisation de Coopération et de Développement Economiques Organisation for Economic Co-operation and Development STATISTICS DIRECTATE National Accounts OECD MEETING OF NATIONAL ACCOUNTS EXPERTS
Introduction to Core Accounting Principles on SEEA and SNA
 Introduction to Core Accounting Principles on SEEA and SNA Julian Chow United Nations Statistics Division 16-18 November 2015 Shanghai Objectives of the Session Introduce and recall some fundamentals of
EXTENSION. The Economic Impact of a Commercial Cattle Operation in a Rural Nebraska County. Key Findings EC856
 EXTENSION The Economic Impact of a Commercial Cattle Operation in a Rural Nebraska County David J. Peters Extension Rural Economic Development Specialist EC856 The purpose of this analysis is to estimate
Updated System of National Accounts (SNA): Chapter 5: Enterprises, establishments and industries
: Chapter 5: Enterprises, establishments and industries") Statistical Commission Thirty-ninth session 26 29 February 2008 Item 3(d) of the provisional agenda Items for discussion and decision: National accounts Background document Available in English only Updated
Statistical Commission Thirty-ninth session 26 29 February 2008 Item 3(d) of the provisional agenda Items for discussion and decision: National accounts Background document Available in English only Updated
Goods sent abroad for processing
 GOODS SENT ABROAD FOR PROCESSING CHAPTER 5 Goods sent abroad for processing Introduction 5.1 The international organization of production has grown considerably in recent years, reflecting improved and
The Recording of Factoryless Goods Production in National and International Accounts
 Twenty-Seventh Meeting of the IMF Committee on Balance of Payments Statistics Washington, D.C. October 27 29, 2014 BOPCOM 14/13 The Recording of Factoryless Goods Production in National and International
Type of Inventory. OVERVIEW In case of manufacturing concerns. Stores and Spares. Formulae for Determining Cost of Inventory
 CHAPTER 4 INVENTORIES LEARNING OUTCOMES After studying this chapter, you will be able to: Understand the meaning of term 'Inventory'. Learn the technique of Specific identification method, FIFO, Average
DECOMPOSING GROSS FIXED CAPITAL FORMATION BY ECONOMIC ACTIVITY FOR COSTA RICA
 DECOMPOSING GROSS FIXED CAPITAL FORMATION BY ECONOMIC ACTIVITY FOR COSTA RICA 2012-2013 1. Gabriela Saborío Muñoz* Manuel Esteban Sánchez Gómez* Fabián Ramírez Gamboa* 2016 The ideas expressed in this
Environmental goods and services sector accounts
 Environmental goods and services sector accounts PRACTICAL GUIDE 2016 edition MANUALS AND GUIDELINES Environmental goods and services sector accounts PRACTICAL GUIDE 2016 edition Europe Direct is a service
Inclusion of Informal Sector Estimates in SUTs
 United Nations Economic Commissions for Africa Regional Seminar on Compilation and Application of Supply-Use Tables in Africa 5-8 February 2018, Addis Ababa, Ethiopia Inclusion of Informal Sector Estimates
Foreign Affiliate Trade Statistics 1999
 Catalogue No. 11F0027MIE No. 004 ISSN: 1703-0404 ISBN: 0-662-31995-8 Research Paper Foreign Affiliate Trade Statistics 1999 How Goods and Services are Delivered in International Markets by Colleen Cardillo
6. The balancing or integration procedure and validating the estimates
 6. The balancing or integration procedure and validating the estimates 6.0 GDP balancing procedure 6.0.1 Target total module Before the balancing of GDP can take place in the supply and use tables, so-called
Palestinian Central Bureau of Statistics Economic Statistics Directorate
 Palestinian Central Bureau of Statistics Economic Statistics Directorate The Services Survey 2002 User s Guide Raw Data Table of Contents Concepts and Definition Survey Questionnaire Data Set linkage Target
Typology of Global Production Arrangements
 Typology of Global Production Arrangements Introduction This chapter focuses on developing a typology of global production arrangements defined as an interlinked process performed in more than one country,
Boston, USA, August 5-11, 2012
 Session 8A: How to Capture Multi-Nationals in National Accounts Time: Friday, August10, 2012 PM Paper Prepared for the 32nd General Conference of The International Association for Research in Income and
SEEA Central Framework
 Statistical Commission Forty-third session 28 February 2 March 2012 Item 3 (e) of the provisional agenda Environmental-economic accounting Background document Available in English only REVISION OF THE
EBOPS 2010 Overview of the service categories
 EBOPS 2010 Overview of the service categories Regional Seminar on International Trade Statistics Ashgabat, Turkmenistan, 26-29 September 2016 United Nations Statistics Division Karoly Kovacs, Chief, Statistics
2011 Input-Output Tables for Japan
 2011 Input-Output Tables for Japan Joint Compilation Ministry of Internal Affairs and Communications Cabinet Office Financial Services Agency Ministry of Finance Ministry of Education, Culture, Sports,
Economic Surveys Results. Release Date : Oct 2015
 Economic Surveys Results 2014 Release Date : Oct 2015 Table of Contents Introduction 4 Key Points 5 Analysis of Results 6 3.1 Value added 6 3.2 Total production 7 3.3 Gross fixed capital formation 8 3.4
MINISTRY OF PLANNING AND INVESTMENT LAO STATISTICS BUREAU
 Workshop on Energy Statistics for ASEAN Countries Kuala Lumpur, Malaysia 21-23 November 2016 Data Collection On Energy Statistics and Using Data to Establish The Supply and Use Table Sypaseut NAVONGSA
Danish Environmental Expenditure Accounts 2008
 Ref. Ares(2012)173682-15/02/2012 Danish Environmental Expenditure Accounts 2008 by Ole Gravgård Pedersen Statistics Denmark Danish Environmental Protection Expenditure Accounts 2008 Statistics Denmark
Organization and methodology of domestic trade statistics in the Russian Federation
 Organization and methodology of domestic trade statistics in the Russian Federation 1. The trade is on of the major economic branches in terms of added value volume produced. It contributed 22% of Russian
Inventories. IAS Standard 2 IAS 2. IFRS Foundation
 IAS Standard 2 Inventories In April 2001 the International Accounting Standards Board (the Board) adopted IAS 2 Inventories, which had originally been issued by the International Accounting Standards Committee
Kiyoshi Kobayashi (Kyoto University)
") Online Publication Date: 10 March, 2012 Publisher: Asian Economic and Social Society Vietnam Economic Structure Change Based on Input-Output Table (2000-2007) Bui Trinh (National Account Department of
Online Publication Date: 10 March, 2012 Publisher: Asian Economic and Social Society Vietnam Economic Structure Change Based on Input-Output Table (2000-2007) Bui Trinh (National Account Department of
SEEA Central Framework
 Statistical Commission Forty-third session 28 February 2 March 2012 Item 3 (e) of the provisional agenda Environmental-economic accounting Background document Available in English only REVISION OF THE
Informal sector activity Methods and Estimation Techniques
 Informal sector activity Methods and Estimation Techniques Regional Workshop on National Accounts and the development of Economic Statistics Infrastructure within the SDGs Framework 15-18 May 2017 Amman,
Draft Handbook on Environmental Sector Chapter 4 - version 8_2
 EUROPEAN COMMISSION EUROSTAT Directorate E: Agriculture and environment statistics; Statistical cooperation Unit E3: Environmental statistics and accounts Doc. ENV/EGSS/TF/05 (2009) Original in EN Draft
Integrated framework for environmental activity accounts
 EUROPEAN COMMISSION EUROSTAT Directorate E: Sectoral and regional statistics Unit E-2: Environmental statistics and accounts; sustainable development Integrated framework for environmental activity accounts
Nigerian Gross Domestic Product Report
 Issue 01 Quarter: One Year: 2014 Nigerian Gross Domestic Product Report Quarter One 2014 NATIONAL BUREAU OF STATISTICS Overview of GDP in Quarter One 2014 In the first quarter of 2014, Nigeria s Nominal
Inventories IAS 2 IAS 2. IFRS Foundation
 IAS 2 Inventories In April 2001 the International Accounting Standards Board (the Board) adopted IAS 2 Inventories, which had originally been issued by the International Accounting Standards Committee
The Development of an Integrated Approach to Business Statistics at United Nations Statistics Division 1
 The Development of an Integrated Approach to Business Statistics at United Nations Statistics Division 1 by Ivo Havinga and Vladimir Markhonko I. Introduction In his statement of programme issues to the
Belarus. Irina Tochitskaya. 1. Source Data
 Belarus Irina Tochitskaya The Belarusian input-output (I-O) table in the GTAP 7 p4 Data Base was constructed from inputoutput tables and some supporting data supplied by the Ministry of Statistics and
MARNA KEARNEY Energy Research Centre University of cape Town
 Modelling the impact of CO 2 taxes in combination with the Long Term Mitigations Scenarios on Emissions in South Africa using a dynamic computable general equilibrium model MARNA KEARNEY 2008 Energy Research
11th Meeting of the Advisory Expert Group on National Accounts, 5-7 December 2017, New York, USA
 SNA/M1.17/9.2 11th Meeting of the Advisory Expert Group on National Accounts, 5-7 December 2017, New York, USA Agenda item: 9.2 CIF/FOB recording of imports and exports in the national accounts and the
Turkey. Mustafa Acar The original input-output table
 14.12 Turkey Mustafa Acar 14.12.1 The original input-output table The source table for Turkey s input-output (I/O) table is The Input-Output Structure of the Turkish Economy 1990, published by the State
The Danish Energy and Emission Accounts. by Anna Andriianets Statistics Denmark
 The Danish Energy and Emission Accounts by Anna Andriianets Statistics Denmark The Danish Energy Accounts The current Danish energy accounts were constructed in the 1970 s Consistent time series for the
IFRS Training. IAS 2 Inventories. Professional Advisory Services
 IFRS Training IAS 2 Inventories Table of Contents Section 1 Overview 2 Scope 3 Definitions 4 Measurement 5 Perpetual Versus Periodic 6 Cost Formulas 7 Net Realizable Value 8 Recognition 9 Disclosure Section
Joint OECD / Eurostat questionnaire on national accounts employment and hours worked SLOVAKIA
 Joint OECD / Eurostat questionnaire on national accounts employment and hours worked SLOVAKIA I. Employment Question 1.0: Describe succinctly the architecture of your estimation method for employment in
COUTRY NOTE INTERNATIONAL MERCHANDISE TRADE STATISTICS (IMTS), BANGKOK, 9-12 SEPTEMBER, 2008 WORKSHOP
, BANGKOK, 9-12 SEPTEMBER, 2008 WORKSHOP") COUTRY NOTE INTERNATIONAL MERCHANDISE TRADE STATISTICS (IMTS), BANGKOK, 9-12 SEPTEMBER, 2008 WORKSHOP SOURCES AND COMPILATION OF IMTS IN KENYA PRELUDE The collection and compilation of external trade statistics
COUTRY NOTE INTERNATIONAL MERCHANDISE TRADE STATISTICS (IMTS), BANGKOK, 9-12 SEPTEMBER, 2008 WORKSHOP SOURCES AND COMPILATION OF IMTS IN KENYA PRELUDE The collection and compilation of external trade statistics
UNITED NATIONS DEPARTMENT OF ECONOMIC AND SOCIAL AFFAIRS STATISTICS DIVISION
 UNITED NATIONS DEPARTMENT OF ECONOMIC AND SOCIAL AFFAIRS STATISTICS DIVISION Workshop on the updated and new recommendations for International Merchandise Trade Statistics (IMTS 2010) and their implementation
PHILIPPINES. Sectoral Activities Department. Agriculture & Fishing. Fig. 1: Employment by Major Economic Activity ('000s),
,") PHILIPPINES 35,000 30,000 25,000 20,000 15,000 10,000 Fig. 1: Employment by Major Economic Activity ('000s), 2001-2008 Agriculture, Hunting and Fishing Mining and Quarrying Electricity, Gas and Water Supply
PHILIPPINES 35,000 30,000 25,000 20,000 15,000 10,000 Fig. 1: Employment by Major Economic Activity ('000s), 2001-2008 Agriculture, Hunting and Fishing Mining and Quarrying Electricity, Gas and Water Supply
Introduction to Core Accounting Principles on SEEA and SNA. Sokol Vako United Nations Statistics Division
 Introduction to Core Accounting Principles on SEEA and SNA Sokol Vako United Nations Statistics Division Objectives of the Session Define the scope of measurement in the SEEA > Defining the economy and
Paper VB 14 Turnover and output for Leasing of intellectual property...
 Paper VB 14 Turnover and output for Leasing of intellectual property... Robbert de Ruijter CBS Den Haag Henri Faasdreef 312 2492 JP The Hague P.O. Box 24500 2490 HA The Hague +31 70 337 38 00 www.cbs.nl
Documentation of the GDP indicator
 Documentation of the GDP indicator November 2016 Statistics Denmark Sejrøgade 11 2100 Copenhagen Ø, Denmark by Bahar Dudus, bdu@dst.dk Daniel F. Gustafsson, dfg@dst.dk Rasmus Rold Sørensen Carmela Moreno,
Women and Men Operators of Enterprises in India s Informal Sector
 WIEGO Statistical Brief N o 18 December 2017 and Operators of Enterprises in India s Informal Sector Govindan Raveendran 1 Half of the global workforce, more so in developing countries, is self-employed,
Estimation of Rural and Urban Income
 Estimation of Rural and Urban Income Introduction 32.1 The Central Statistical Organisation (CSO) has been compiling estimates of Rural and Urban income of the Indian economy along with the exercises for
19: Relationship between IMTS 2010, MSITS 2010 and BPM6 - particularly the use of ITRS and enterprise surveys
 Regional Seminar on International Trade Statistics: Implementation of recommendations 19: Relationship between IMTS 2010, MSITS 2010 and BPM6 - particularly the use of ITRS and enterprise surveys Addis
Food Grain Stocking Pattern in India & the Information Gap
 International Seminar on Approaches and Methodologies for Private Food Grain Stock Measurement New Delhi, 9-11 November 2016 Food Grain Stocking Pattern in India & the Information Gap Technical Session
indicators for the Kymenlaakso region
 T h e F i n n i s h E n v i r o n m e n t 698en ENVIRONMENTAL PROTECTION Ilmo Mäenpää and Esa Mänty Economic and material flow indicators for the Kymenlaakso region Documentation report 2 of the ECOREG
Report (July 2012) Organization, purpose and participants
 Organization, purpose and participants") UNITED NATIONS DEPARTMENT OF ECONOMIC AND SOCIAL AFFAIRS STATISTICS DIVISION UNSD-SACU workshop on the implementation of the new recommendations for International Merchandise Trade Statistics (IMTS 2010)
UNITED NATIONS DEPARTMENT OF ECONOMIC AND SOCIAL AFFAIRS STATISTICS DIVISION UNSD-SACU workshop on the implementation of the new recommendations for International Merchandise Trade Statistics (IMTS 2010)