Chapter 4 Demand, Supply, and Equilibrium. Outline. Markets. How Do Buyers Behave? How Do Sellers Behave? Supply and Demand in Equilibrium
|
|
|
- Megan Thompson
- 5 years ago
- Views:
Transcription
1 Part I: Introduction to Economics 1. The Principles and Practice of Economics 2. Economic Methods and Economic Questions 3. Optimization: Doing the Best You Can 4. 1 / 44
2 Chapter / 44
3 / 44
4 In a perfectly competitive market, (1) sellers all sell an identical good or service, and (2) any individual buyer or any individual seller isn t powerful enough on his or her own to affect the market price of that good or service. The demand curve plots the relationship between the market price and the quantity of a good demanded by buyers. 4 / 44
5 The supply curve plots the relationship between the market price and the quantity of a good supplied by sellers. The competitive equilibrium price equates the quantity demanded and the quantity supplied. When prices are not free to fluctuate, markets fail to equate quantity demanded and quantity supplied. 5 / 44
6 Q: How much more gasoline would people buy if its price were lower? 6 / 44


7 Chapter The market is a group of economic agents who are trading a good or service, and the rules and arrangements for trading. e.g. markets with specific physical location or through online transactions. 7 / 44
8 Competitive If all sellers and all buyers face the same price, that price is refereed to as the market price. In a perfectly competitive market all sellers sell an identical good or service, any individual buyer or any individual seller is not powerful enough to affect the market price. Buyers and sellers are price takers. Very few, if any, markets are perfectly competitive. If sellers have nearly identical goods and most markets participants face lots of competition, then the perfectly competitive model is a good approximation of how actual markets work. 8 / 44
9 4.2 Quantity demanded is the amount of the good or service that buyers are willing to purchase at a given price. Demand schedule is the table that reports the quantity demanded at different prices, holding all else equal. 9 / 44

10 Demand Curves Demand curve plots the quantity demanded at different prices. Exhibit 4.1 Chloe s Demand Schedule and Demand Curve for Gasoline 10 / 44
11 The price of gasoline and the quantity demanded are negatively related. Almost all goods have demand curves exhibit this fundamental negative relationship, which economists call the Law of Demand: the quantity demanded rises when the price falls (holding all else equal). 11 / 44
12 Willingness to Pay ( 願付價格 ) Willingness to pay is the highest price that a buyer is willing to pay for an extra unit of a good, which is the height of the demand curve for that marginal unit of the good. As you consume more of a good, your willingness to pay for an additional unit declines, this is called diminishing marginal benefit. 12 / 44
13 From Individual Demand Curves to Aggregated Demand Curves The sum of all individual demand curves of all potential buyers is the aggregation of the individual demand curves. The market demand curve plots the relationship between the total quantity demanded and the market price, holding all else equal. 13 / 44

14 Exhibit 4.2 Aggregation of Demand Schedules and Demand Curves 14 / 44
15 Building the Market Demand Curve Exhibit 4.3 Market Demand Curve for Oil The key property of a demand curve is the negative relationship between price and quantity demanded. Market price for oil from 2011 to 2013: $100 per barrel. 15 / 44
16 Shifting the Demand Curve The demand curve shifts when one of the following five major factors change: Tastes and preferences Income and wealth Availability and prices of related goods Number and scale of buyers Buyers expectations about the future 16 / 44
17 Changing Tastes and Preferences For example, concern for global warming will decrease the demand for gasoline. Demand curve will shift to the left. Changes in tastes could also increase the demand for gasoline, and shift the demand curve to the right. 17 / 44
18 Exhibit 4.4 Shifts of the Demand Curve vs. Movement Along the Demand Curve 18 / 44
19 Changing Income or Changing Wealth For a normal good ( 正常財 ), an increase in income causes the demand curve to shift to the right (holding the good s price fixed). If rising income shift the demand curve to the left (holding the good s price fixed), then the good is called an inferior good. ( 劣等財 ) 19 / 44
20 Changing Availability and Prices of Related Goods Public transportation and gas are substitutes ( 替代品 ), because a fall in the price of public transportation leads people drive their cars less, producing a left shift in the demand curve for gas. Two goods are said to be complements ( 互補品 ) when the fall in the price of one good, leads to a right shift in the demand curve for the other good. 20 / 44
21 Changing Number and Scale of Buyers Switches from gasoline to battery power cars. Changing Buyers Beliefs About the Future Expecting job losses. 21 / 44

22 Q: How much more gasoline would people buy if its price were lower? 22 / 44
23 Exhibit 4.5 The Quantity of Gasoline Demanded (per person) and Gasoline in Brazil, Mexico, and Venezuela Price per gallon in 2013: Brazil $5.58, Venezuela $ / 44
24 4.3 Quantity supplied is the amount of a good that sellers are willing to sell at a given price. Supply schedule is the table that reports the quantity supplied at different prices. Supply curve plots the quantity supplied at different prices. 24 / 44

25 Exhibit 4.6 ExxonMobil s Supply Schedule for Oil and Supply Curve for Oil In almost all cases, quantity supplied and price are positively related (holding all else equal), which economists call the Law of Supply. 25 / 44
26 Willingness to Accept For an optimizing firm, the height of the supply curve is the firm s marginal cost. The height of the supply curve is also the lowest price that a seller is willing to get paid to sell an extra unit of a good, economists call this the seller s willingness to accept. 26 / 44

27 From the Individual Supply Curve to the Market Supply Curve Exhibit 4.7 Aggregation of Supply Schedules and Supply Curves 27 / 44
28 Market supply curve plots the relationship between the total quantity supplied and the market price, holding all else equal. Exhibit 4.7 Market Supply Curve for Oil 28 / 44
29 Shifting the Supply Curve The supply curve shifts when the following variables change: Prices of input used to produce the good Technology used to produce the good Number and scale of sellers Sellers expectations about the future 29 / 44
30 Changing Prices of Input An input is a good or service used to produce another good or service. An increase in the price of steel shifts the supply of oil to the left. An decrease in the price of steel shifts the supply of oil to the right. 30 / 44
31 Exhibit 4.9 Shifts of the Supply Curve vs. Movement Along the Supply Curve 31 / 44
32 Changes in the Technology Improvement in technology shifts the supply to the right. Changes in the Number and Scale of Sellers During the Libyan civil war, the worldwide supply curve of oil shifted to the left by 1.5 million barrels per day. Changes in Sellers Beliefs About the Future Expecting a winter spike in natural gas prices, natural gas suppliers shift the supply curve to the left in the summer. 32 / 44
33 4.4 Demand in Competitive markets converge to the price at which quantity supplied and quantity demanded are the same. Exhibit 4.10 Demand Curve and Supply Curve for Oil 33 / 44
34 Competitive equilibrium ( 均衡 ) is the point at which the market comes to an agreement about what the price will be (competitive equilibrium price) and how much will be exchanged (competitive equilibrium quantity) at that price. Excess supply occurs when suppliers provide more than consumers want at a given price. This situation results in a surplus. 34 / 44
35 Exhibit 4.11 Excess Supply 35 / 44
36 Excess demand occurs when consumers want more than suppliers provide at a given price. This situation results in a shortage. Exhibit 4.12 Excess Demand 36 / 44
37 Curve Shifting in Competitive What would happen if a major oil exporter suddenly stopped production, as Libya did in 2011? Exhibit 4.13 A Left Shift of the Supply Curve 37 / 44
38 What would happen if rising environmental concerns led consumers to cut back their carbon footprint by using less oil? Exhibit 4.14 A Left Shift of the Demand Curve 38 / 44
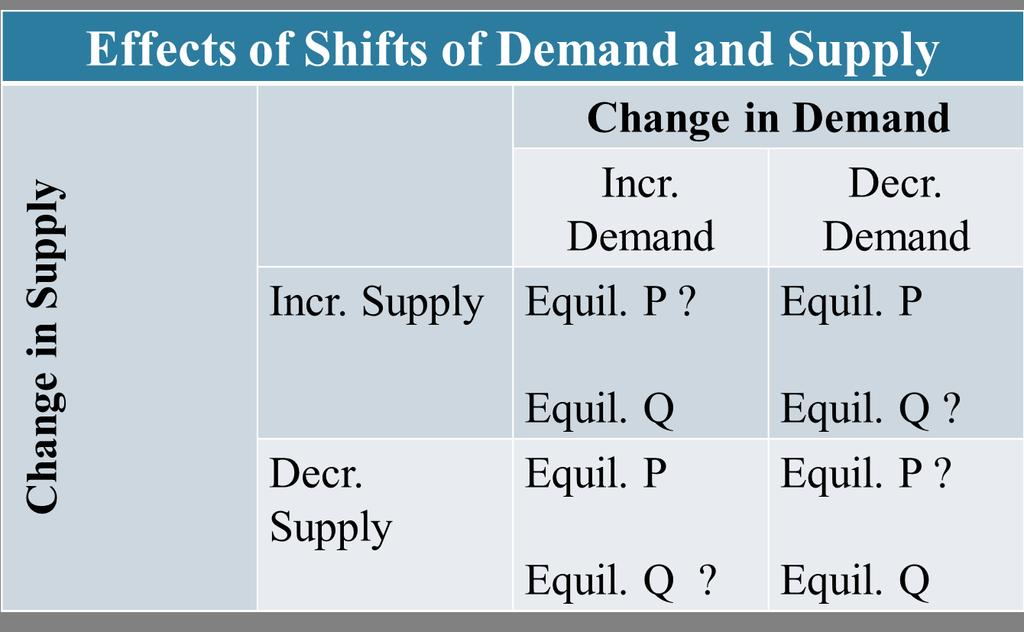
39 How simultaneous shifts in the supply and the demand curves translate into changes in the market price and the quantity of transactions. Exhibit 4.15 Both the Demand Curve and the Supply Curve Shift Left 39 / 44
40 40 / 44
41 4.5 What Would Happen If the Tried to Dictate During the U.S. oil crisis of , the U.S. government effectively capped the price (price ceiling) of gasoline, causing quantity demanded to exceed quantity supplied. 41 / 44
42 When the quantity demanded is greater than the quantity supplied, there is a shortage of gasoline at the capped price. What will happen? Who gets to buy the gasoline? Long waiting lines, fighting? Rent and other price controls. 42 / 44
43 The Unintended Consequence of Fixing Market Prices Exhibit 4.16 Excess Demand for Henrico County s Laptops What will happen to a first-come, first-served sale of 1,000 Apple laptops for $50 each? What determines who will get the 1,000 Laptops supplied? 43 / 44
44 Exhibit Excess Demand when prices are fixed How is this related to the college admission in Taiwan? Situations where prices are fixed at the level higher than the equilibrium market prices (price floor), what will happen? 44 / 44