Before we begin... -Please fill out the left column -Differentiate Needs vs Wants -Fill out right column after workshop
|
|
|
- Rudolf Franklin
- 5 years ago
- Views:
Transcription
1 Before we begin... -Please fill out the left column -Differentiate Needs vs Wants -Fill out right column after workshop
2 5 secrets you may be missing
3 Agenda... -Why should you listen to me -Market Landscape -Trends -5 Secrets -Digital Publication App -Panel Discussion
4 Why should you listen to me


5

6 Our mission Improve your agency s bottom line through workflow mapping and technology analysis


7 Our people Innovative Engineers 6 Sigma Developers People


8 Our industry knowledge spans -Travel agents -Airline employees -Hotel employees -Car employees -Developers -Scripters -Management consultants -Engineers

9 Our experience Over 350 total on-site engagements -155 corporate - 85 leisure - 40 consolidators - 24 online Helping Agencies Since 2005


10 Our experience

11 Where we have been
12 Market Landscape
13 Market landscape 1. Travel is complex 2. Agency business is challenging 3. Money to be made and value to be added
14 Travel is complex -The markets are fragmented -Change is constant

15 Travel value chain Travel Demand Travel Supply

16 Fragmentation

17 Fragmentation Total Cost Per Transaction = $13.44
18 Market landscape 1. Travel is complex 2. Agency Business is challenging 3. Money to be made and value to be added
19 Agency business is challenging. -Clients are demanding -Competition fierce -Increasingly thin margins

20 Agency trends

21 Fierce competition


22 Fierce competition
23 Market landscape 1. Travel is complex 2. Agency Business is challenging 3. Money to be made and value to be added
24 Money to be made and value to be added -Enter new markets -Sell new products -Cost savings -Traveler security -Service and convenience

25 Travel on the rise

26 Travel on the rise

27 Value add areas. Source: CWT 2013
28 Travel value chain Travel Demand Travel Supply
29 Trends: Cost Management Revenue Optimization Demographic Shift
30 Trends: cost management -Online booking tool -Scripting -Automation

31 Cost management Travel Demand Travel Supply
32 Online booking tool
33 Trends: revenue optimization -Standard contracting -Supplier relations

34 Revenue optimization Travel Demand Travel Supply

35 Contract Optimization Services


36 Trends: demographic shift -Shopping Methods -Agency Population

37 Demographic shift Travel Demand Travel Supply

38 Demographics ~75% use 1-4 websites

39 Demographics Are you targeting the right group?


40 Agent learning
41 5 Secrets

42 Do you know how your KPIs compare to your peers/competitors If tools you invested in are helping or hindering agents productivity what does your profitability look like across customer tiers where are your hidden costs if servicing certain customers may be undermining your profitability how to view true transaction-level data to tell you what s really going on

43 So where do I start? -Timed workflow analysis -Technology assessment -Reporting breakdown -Employee culture test -Customer snapshot -Data security scan -Malware protection update -Financial integrity evaluation


44 Bit.ly/5SecretsToSuccess
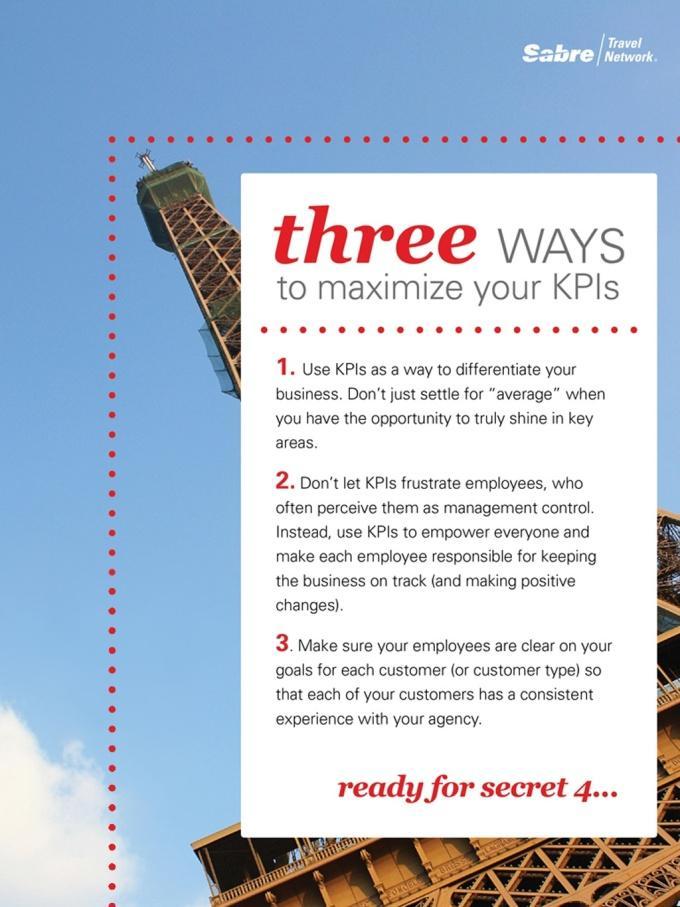
45 5 Secrets 1. Where do you spend you time? 2. Automation creation 3. KPI based infrastructure and reporting 4. Customer Management 5. Employee Culture

46 Secret 1: Where do you spend your time?


47 Front Office Disposition Summary Where is your time spent Sabre Average Handle Time Website Walk-In 42% AHT: 500s Phone ABC Agency AHT: 395s change 30% AHT: 388s Website Walk-In Phone % AHT: 177s Website Walk-In Phone
48 5 Secrets 1. Where do you spend you time? 2. Automation creation 3. KPI based infrastructure and reporting 4. Customer Management 5. Employee Culture

49 Secret 2: Automation creation
50 Secret 2: Automation Creation Shopping PNR Creation Pricing Document Delivery Quality Control Update Notifications
51 5 Secrets 1. Where do you spend you time? 2. Automation creation 3. KPI based infrastructure and reporting 4. Customer Management 5. Employee Culture
52 Secret 3: Key performance indicators Functional Area Key Indicator Suggested Methods Sales and marketing Account management Operations management Transaction processing Reporting and analysis Customer profitability analysis Customer service mix Service fee profitability Customer retention effectiveness Service level effectiveness Consultative management Resource and staffing People development Technology deployment Integration and optimization Front-office effectiveness Mid-office fulfillment effectiveness Back-office accounting Agency performance Supplier performance Customer reporting Benchmarking Build a PNL for each customer Analyze each customer on a per transaction basis Analyze pipeline success Understand customer worth Complete quarterly reviews with key customers Process optimization and control Measure staff utilization Measure call-handle time and after-call work Track errors and exceptions Measure Analyze
53 Premier Benchmarking Front Office Operational Benchmarking Average Premier Agency Time Spend Average Premier Agency Characteristics Process Group Corporate Leisure Initialize 11% 10% Bookings Range Revenue Range 100K-1M $1M-$15M Shop/Price/Sell 28% 49% Recap/File Finish 17% 18% QC/Ticketing 18% 6% Other 26% 17% Total 100% 100% Cost savings range $50K- $750K Hours of observations 10 hrs 50 hrs Time Period taken Value of our services $10K-$75K
54 5 Secrets 1. Where do you spend you time? 2. Automation creation 3. KPI based infrastructure and reporting 4. Customer Management 5. Employee Culture

55 Secret 4: Customer management
56 Business model shift
57 5 Secrets 1. Where do you spend you time? 2. Automation creation 3. KPI based infrastructure and reporting 4. Customer Management 5. Employee Culture

58 Secret 5: Employee culture
59 Digital Publication


60 Digital Publication

61 Panel Discussion


62 Panel Discussion -Ewa Jaros -Max Gurdian -Diego Molina

63 Stay Connected facebook.com/sabretravel twitter.com/sabretn youtube.com/sabretravelnetwork agentstream.com #TTX13 sabretravelnetwork.com/blog