AUSTRALIAN PHARMACEUTICAL INDUSTRIES LIMITED BBY EMERGING COMPANIES CONFERENCE 24 JUNE 2014
|
|
|
- Rafe Townsend
- 5 years ago
- Views:
Transcription


1 AUSTRALIAN PHARMACEUTICAL INDUSTRIES LIMITED BBY EMERGING COMPANIES CONFERENCE 24 JUNE 2014
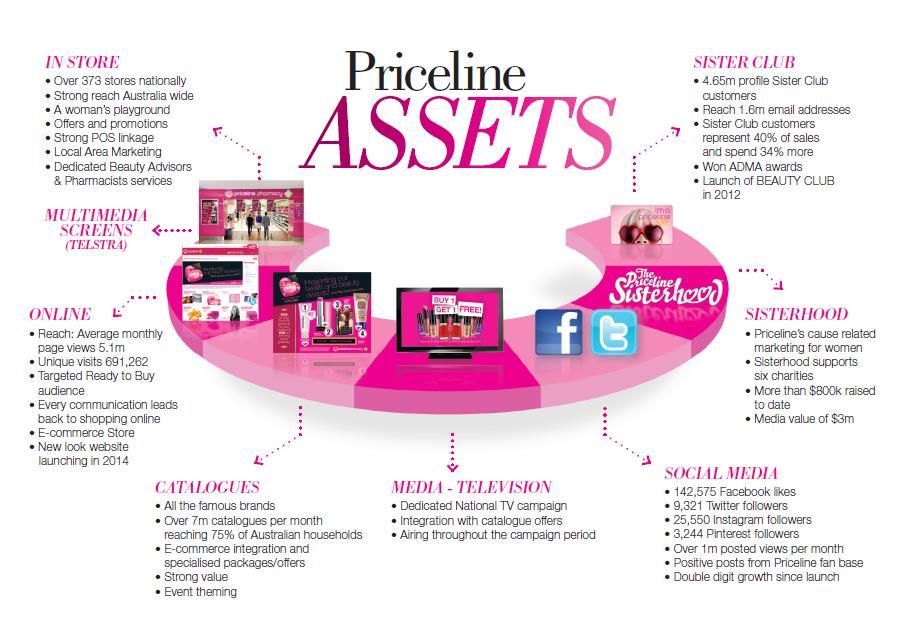
2 API snapshot API is a leading health and beauty retailer and franchise partner. The key assets: Priceline Pharmacy Australia s leading health and beauty retail destination with 373 stores at $1.65bn in retail sales* 231 Priceline Pharmacy stores 142 Priceline stores Pharmacy distribution Australia s leading pharmaceutical distributor by volume with 9 distribution centres nationally Manufacturing New Zealand based OTC and toiletries facilities for ANZ market *Register sales from franchised and company-owned stores 2
3 Highlights 1H14 Income Statement Revenue + 4.6% Gross Profit + 6.0% Operating Costs + 3.0% Impairment $131m Financing % Group Revenue up 4.6% (pcp down 12.5%) Pharmacy sales up 2% despite continued PBS price disclosure reforms with underlying growth up 8% Retail sales up 11.5% with same store sales growth up 5.3% Gross profit increase of 6% to $215m Gross profit margin improved to 13.6% with Pharmacy up 30bps to 8.9% following trading terms adjustments and tighter inventory management Retail margin steady despite intense tactical activity Continued focus on cost control, operating costs before depreciation up 3.0% predominantly from rent increases, restructuring costs, insurance settlement and marketing costs Warehousing and deliver productivity gains with costs flat while volumes up 6% Underlying EBIT margin up to 2.1% (pcp 1.97%) Following review $131m impairment charges taken on the Retail and NZ business units, CH2 investment and Pharmacy customer loans Reduction in financing costs due to runoff of interest rate swaps and reduction in average net debt Debt default waived following impairment charges Operating leverage and debt servicing improved Net Profit* % Revenue generated through sales initiatives drove the top line and tight controls and financial management delivered +29.6% lift in earnings Underlying earnings per share 3.25 cents Fully Franked dividend of 1.5 cents *Net Profit refers to underlying NPAT before Impairment charges. Underlying EBIT refer Appendix 3
4 Segment summaries Retail segment had strong top line growth and increasing GP: Reported sales up 11.5% to $395.5m* Comparable store retail sales up 5.3%* Gross profit up 6.5% to $101.3m* Pharmacy distribution growth off-setting PBS Reforms: Revenue up 2% to $1.213bn, with underlying growth of 8% adjusted for PBS Reforms GP increase reflects continued reduction in trading terms and discounts New Zealand manufacturing: Flat sales of $18m impacted by FX and declines in Australian contract volumes that are expected to recover in second half EBIT includes $800k redundancy charge following restructure in December 2013 *Excludes dispensary sales and profit 4
5 Operating costs Operating costs well managed in tight environment and targeted at reducing cost structure and driving growth in sales Warehousing and distribution costs flat reflects continued productivity gains with increased volumes Sales and Marketing expenses increased 2.9% predominantly from Company store wages and rent increases Administration costs up $2.2m which was flat after non recurring costs for NZ restructuring, IT redundancy and head office rent increase 5
6 Debt metrics strengthen A$m FY14 1H FY13 FY FY13 1H Cash Debt Net Debt Average Net Debt Net Debt/(Net Debt + Equity) 19% 17% 17% Net Debt/Underlying EBIT 1.8x 2.1x 2.1x Underlying EBIT/Interest 3.5x 2.6x 2.5x Material improvement in interest cover and debt coverage Reduction in net debt and average net debt during the period Gearing impacted by impairment charges * Underlying EBIT and NPAT refer Appendix 3 6
7 ROFE & ROE A$m FY14 1H FY13 FY FY13 1H Underlying EBIT* Underlying NPAT* Equity Net debt Funds employed Underlying ROFE* (annualised) 10.3% 8.0% 8.3% Underlying ROE* (annualised) 5.0% 4.1% 4.0% Returns lift reflects impairment charges and strong lift in underlying earnings. * Underlying EBIT and NPAT refer Appendix 3 7

8 API One Enterprise project API moved to whole of company functional approach in 2012 to leverage merchandising, marketing and back office synergies Stage two now commenced with $35m investment in SAP ERP platform to facilitate re-engineering of company back office systems and functions Project on track to go live by late 2014 and to meet the company's cost of capital hurdle Cost savings identified that derive an investment payback of between 5 and 5.5 years Depreciation charges expected to reflect a 7 year effective life 8
9 Capital management update Working Capital Capex Debt Trading terms will continue to be managed as they have been in recent past Inventory optimisation project to reduce inventory levels Supplier term harmonisation post SAP upgrade expected to drive improvement Current capex focus on SAP upgrade Investment in Distribution network upgrade complete Retail store refurbishment circa $5m per annum to continue Stay-in-business capex expected to be circa $10m post SAP implementation Cash Advance Debt facilities refinanced June 2014 Securitisation facilities refinance in May 2015 expect to see a reduction in facilities Continued focus on debt reduction Target operating leverage of < 2 times and debt servicing > 4 times Dividends Expect to maintain dividend at current levels and maintain 50% payout ratio going forward Sufficient franking credits to maintain fully franked dividend into foreseeable future 9
10 Priceline Pharmacy scorecard Key performance indicators Status Retail network sales (excluding dispensary) +8.0% Retail network sales (including dispensary) +6.9% Comparable store growth +5.3% Online sales at $2.2m +281% Register margin variance (including scan and markdown) (0.12)% Transactions +5.0% Basket size +1.8% Store network at Sister Club membership 4.6m Brand awareness 94% Dispensary volume +4.0% 10


11 Growing ahead of market Dominant position in Health & Beauty Pharmacy Grocery MAT Quarter +3.7% +4.8% +7.6% +7% +1.1% -0.3% TOTAL +2.9% +2.6% Source: Nielsen ScanTrack Pharmacy, Data to period ending 9/3/

12 Priceline Pharmacy proposition Priceline is a compelling proposition for pharmacists Greater earnings potential to offset PBS Reform Deep Business, Pharmacy and Retail expertise Sister Club Health Plus will drive further growth directly from integrated dispensary programs Script growth strong at circa 4% comparable store growth 12


13 Why we dominate in beauty Range: No other competitor comes close on range of mass cosmetics, cosmetic accessories and skincare brands Exclusives: Our buying power allows us to negotiate exclusive ranges or launch periods. Marketing then drives customers to us as only retailer New: We are famous for new Fragrance international sourcing: delivers value local distributors cannot match Promotional activity: Value that is offered is competitive and tactical activity cannot be matched by others Beauty Advisors: Experts in how to get the look what s new what s right for you 13


14 Growing in health Opportunity to grow share of health market remains compelling through: Market competitive pricing in scripts, amplifying communication to the customer on the value we offer Delivering disruptive tactical activity on key items or category wide Focusing on exclusive range or sizes Delivering superior service through pharmacists and health heroes Offering range extensions in growth categories such as super foods Delivering professional programs and technical and service training to our teams 14

 58% 56% 59% 52% Last")

15 Priceline leads brand preference January/March 2014 Prompted Awareness 90% 89% 89% 85% Consideration 83% 75% 75% 76% Visitation (Last 12M) 58% 56% 59% 52% Last Purchased 23% 16% 18% 19% Preference 10% 1% 3% 3% Advocacy 5% 1% 1% 2% Galileo Kaleidoscope Pty Ltd 15
16


17 Highly successful loyalty program The Priceline Sister Club is the strongest customer loyalty program in pharmacy today Over 4.6 million members Award winning loyalty program for effectiveness Sister Club card members generate 40% of sales and spend 34% more per visit than non members 17

18 Pharmacy Distribution consistency Management has increased volumes following strong supplier alliances to pursue growth with key independents Continue to leverage independent pharmacy program, Club Premium, with growth faster than expected More than 1000 aligned customers in key brands and programs Priceline Pharmacy, Soul Pattinson, Pharmacist Advice and Club Premium More than 2000 first line customers 18


19 New Zealand future Expect significant improvement in second half Clear activities on sales initiatives and cost management executed Business has ability to supply broader product and private label offerings into API aligned channels Blackmores agency remains strong 19
20 In summary Half Year results strong with underlying net profit after tax up 29% Priceline Pharmacy 3 rd quarter same store growth 6.6% with YTD at 5.7% Solid cashflow with improved debt metrics Outlook for an expected underlying NPAT $28m $30m* * Outlook is subject to: no material change in consumer or customer demand a stable economic climate no unforeseen adjustments to the regulatory environment or reforms to the Pharmaceutical Benefits Scheme 20
21 AUSTRALIAN PHARMACEUTICAL INDUSTRIES LIMITED BBY EMERGING COMPANIES CONFERENCE 24 JUNE 2014
22 Appendix 1: Underlying earnings reconciliation A$m H H Reported result from operating activities (78.0) 29.9 Intangible impairment (NZ manufacturing & Retail) Impairment pharmacy customer loans and bank guarantees on balance sheet Underlying EBIT Reported net profit after tax (114.9) 12.8 After tax effect of underlying adjustments Impairment and share of loss from associates (CH2) 20.1 (0.3) Underlying net profit after tax
23 Appendix 2 ASIC Regulatory Guide 230 Disclosing non-ifrs financial information In December 2011 ASIC issued Regulatory Guide 230. To comply with this Guide, Australian Pharmaceutical Industries Limited is required to make a clear statement about the non-ifrs information included in the Profit announcement and Half Year presentation for the period ending 28 February In addition to statutory report amounts, the following non-ifrs measures are used by management and the directors as the primary measures of assessing financial performance of the Group and Individual Segments: Non-IFRS measures used in describing the Business Performance include: Earnings before interest tax (EBIT) Earnings before interest, tax, depreciation, amortisation (EBITDA) Free cash Comparative Store Growth Interest cover Underlying EBIT Interest Cover Adjustment Return on funds employed (RoFE) Underlying Pharmacy Growth In addition to the above the following non-ifrs measures are used by management and the directors to assess the underlying performance of the Group following the impact of the impairment charges at February Underling NPAT Underlying EBIT Underlying EBITDA The directors consider that these performance measures are appropriate for their purposes and present meaningful information on the underlying drivers of the continuing business after considering the impact of the impairment charges at February Many of the measures used are common practice in the industry within which Australian Pharmaceutical Industries Limited operates. The Profit Announcement and Full Year presentation has not been audited or reviewed in accordance with Australian Auditing Standards. 23
24 Appendix 3 - Definitions EBITDA - Result from operating activities before Depreciation and Amortisation EBIT Result from operating activities (includes late fee income from overdue trade debt) Free Cash Net cash from operating activities plus net cash from investing activities Comparative Store Growth - Sales performance compared to last period on stores trading in the network greater than one year Interest Cover Result from operating activities divided by net financing costs Net Debt Borrowings less cash on hand Return on funds employed EBIT / Equity plus Net Debt Underlying Pharmacy Revenue Growth Revenue computated on volumes before PBS price changes Underlying EBIT Refer Appendix 1 Underlying EBITDA Underlying EBIT less depreciation and amortisation Underlying NPAT Refer Appendix 1 24