GEZ PETROL STATION: CVP ANALYSIS AND SPREADSHEET MODELLING FOR PLANNING AND DECISION MAKING
|
|
|
- Shanna Green
- 5 years ago
- Views:
Transcription
1 INSTRUCTOR S MANUAL GEZ PETROL STATION: CVP ANALYSIS AND SPREADSHEET MODELLING FOR PLANNING AND DECISION MAKING Case Overview Mr. Aiman, an area manager of GEZ Berhad, realised the importance for petrol station operators to have an understanding of fundamental management accounting concepts such as cost behavior and cost-volume-profit (CVP) analysis. He also believed the petrol station operators should be proficient in using Microsoft Excel functionality and able to construct intelligent financial model with extended sensitivity analysis. Being a manager responsible for training the petrol station operators, Mr Aiman would like to introduce the CVP concepts and spreadsheet model building process to the petrol station operators, to aid them in planning and decision making. To construct the Excel spreadsheet model, Mr Aiman sought the assistance of Rizal, a University lecturer in accounting, who in turn gathered the relevant operational and financial data from Baron Service Station, a typical petrol station under GEZ stable. The model should be flexible enough to allow the petrol station operator to anticipate, for example, (1) what will happen to overall profitability of the petrol station if the fuel prices go up? (2) what is the minimum volume of fuel that needed to be sold in order to break even? (3) how much extra profit can be generated if credit card sales is reduced? and (4) is it viable to install an ATM kiosk and incurring administrative charges from bank in order to lure more customers to visit the petrol station? As the petrol station sells multiple products (petrol, diesel and convenience goods), the owner is also interested to know which product lines are the most and least profitable. Thus, the model should be able to generate segmented income statement with appropriate allocation of the common fixed costs to the each of the products. 1
2 Intended Courses Management Accounting at the undergraduate and postgraduate levels Financial Modelling at the undergraduate and post-graduate levels Integrated Case Study at the undergraduate level Information Technology at the undergraduate level Executive development programme on Entrepreneurship for business entrepreneurs and sole proprietors Research Methodology and Data Sources The operational and financial data are obtained from the owner of Baron Service Station. Other data are obtained through interviews with the area manager of GEZ Berhad and websites of the relevant institutions. Case Objectives The case discussion is intended to achieve the following learning outcomes: 1. Students are able to prepare a financial model which include a segmented contribution income statement based on the information on product mix; 2. Students are able to calculate the break-even point, and distinguish between fixed and variable costs; 3. Students are able to differentiate between traceable fixed costs and common fixed costs; 4. Students are able to build a financial model that is sufficiently flexible to allow various what if analysis to be performed; 2
3 5. Students are able to use what if analysis tools in Excel such as Goal Seek and Data Tables. The case is assigned following coverage of cost behaviour, budgeting and CVP analysis to provide for requisite foundational knowledge. The lecture on those topics which precedes the case will equip students with the knowledge to apply to the case and minimise the application of irrelevant ideas to the case. The case can be covered in a 2-hour discussion class. Students have to read the case in advance, and develop the financial model using Excel spreadsheet prior to class discussion. Students are recommended to look for instructions on how to use Excel Goal Seek and Data Table. Suggested Discussion Questions 1. Using financial modelling techniques, produce a segmented income statement. The model should be sensitive to various scenarios. 2. How lucrative is the petrol station business? 3. Since the margin on fuel business is very low (6%) compared to convenience store (20%), do you agree that the convenience store is subsidising the fuel business? 4. If the government raised the fuel prices by 15% in order to cut its fuel subsidy, do you anticipate the profitability of the petrol station business would be eroded? 5. If credit card sales are reduced from 40% to 20%, what is the effect on overall profitability? 6. What is the break-even sales for each segment in litres and Ringgit sales? 7. Is utility cost fixed or variable? What difference does it make to the breakeven volume if it is classified as (i) fixed cost, and (ii) variable cost? 3
4 8. Assuming installing an ATM kiosk will generate additional sales and incur fixed administrative charges from a bank, what is the acceptable range of fees if installing an ATM kiosk may increase fuel sales by a possible range of 1% to 10%? Cost-Volume-Profit (CVP) Analysis A CVP or break-even analysis is used to determine how changes in costs and volume affect a company's operating income and net income. It is often used to find a break-even point, or to determine the quantity to be sold/produced in order to achieve a certain profit. The following assumptions are required in performing the analysis: Sales price per unit is constant, Variable costs per unit are constant, Total fixed costs are constant, Everything produced is sold, Costs are only affected by the change in production/sales. If a business sells more than one product, they are sold in the same mix (for example, 30% of A, 50% of B, and 20% of C). A CVP analysis requires that all the costs (manufacturing, selling, and administrative) be classified into variable or fixed. In the case of Baron, the variable costs would be the purchase price of fuel and merchandise sold in SelesaMart, product loss, credit card charge and royalty. All other costs (salary, insurance, stationaries, utilities and rent) are considered fixed. The case is complex because it involves 2 businesses (fuel and convenience store), and there are 3 products under the fuel business. The case thus, involves two levels of sales mix and 4 segments altogether. 4
5 Two important concepts in solving a CVP problem are contribution margin and contribution margin ratio. The contribution margin (CM) represents the amount of income or profit the company made before deducting its fixed costs, i.e., sales revenue minus variable costs. In other words, it is the amount of sales revenue available to cover the fixed costs. Contribution margin ratio (CMR) is the percent of sales available to cover fixed costs (contribution margin divide by sales). For example, if a company sells 100 units of product A at RM30 a unit, with a variable cost of RM18 per unit, the contribution margin is RM1200 (contribution margin per unit of RM12). The CM ratio is 40%. If the fixed cost is RM600, the profit is RM600. Break-even point The break even point represents the level of sales when net profit is zero. In other words, it is the point where sales revenue equals total variable costs plus total fixed costs, or where contribution margin equals fixed costs. Using the above example, if the fixed cost is RM600: Break even point in units = RM600/RM12 = 50 units Break-even sales = RM600/0.4 = RM1500 The contribution margin income statement is as follows: Sales (50 x RM30) 1500 Variable cost 900 Contribution margin 600 Fixed cost 600 Net profit 0 5
6 If the firm targets an income of RM300, the sales in Ringgit and units are: Required units to be sold = (fixed cost + targeted income)/cm per unit = (RM600 + RM300)/12 = 75 units In finding the break-even or performing a CVP analysis, the Excel model will use the contribution margin income statement. By using Goal Seek of Excel (setting our goal, i.e. net income) to become zero, Excel will calculate the break even sales in RM and units. Alternatively, we can set our goal to be any amount of profit that we target, and Excel will give us the sales in RM and units. Here, we ignore income taxes. If a targeted net income (income after taxes) is being calculated, then income taxes would also be added to fixed costs along with targeted net income. Sales Mix If a business sells more than one product, the assumption is that they are always sold in the same proportion or mix. In the case of Baron, first the proportion between the store and the fuel sales is that for every RM100 sales of fuel, SelesaMart will make a RM7.429 sales. The proportion of sales mix for Ron95, Ron97 and diesel is about 79.27%, 1.64% and 19.09%, respectively. In calculating the breakeven, the total fixed cost will be divided by the average contribution margin to find the total sales. The sales for each segment or product is then calculated accordingly based on the proportion of sales mix. As for Baron, the business will be divided into four segments. The simplest way in finding the break-even for each product is by using Excel s Goal Seek, setting the value of the overall net 6
7 profit (in the contribution margin income statement) equals zero. The CM income statement is the output of the model where no raw data is allowed to be entered. Each entry of the income statement will be referred to the relevant value(s) in the input section. Fixed cost Another issue with mixed products is the allocation of fixed costs to the businesses and products. Some fixed costs are specific to each product but some are indirect costs. The allocation of indirect fixed costs are based on some cost drivers, such as machine hours, labour hours, and sales proportion. Some costs are common and not being allocated to the segments. In the case of Baron, some staff cost such as salaries of pump crew are specific. Others such as clerks salary can be allocated based on the nature of their work. Some staff cost such as security guard can be considered common and may not be allocated. Students may argue on the methods that they use to allocate the fixed costs to the respective segments or whether they want to allocate or not. The Art of Spreadsheet Modelling A spreadsheet model is an attempt to build a representation of reality using logical mathematical relationships. A spreadsheet can be used to show how changes in the external environment will impact the success of a business. In order to assess the profitability of Baron Petrol Station, a financial model capable of computing the level of income for each business line under various planning scenarios is developed as shown in Exhibit 1. The model is basically a segmented contribution margin income statement of the two businesses (Convenience store and fuel), where 7
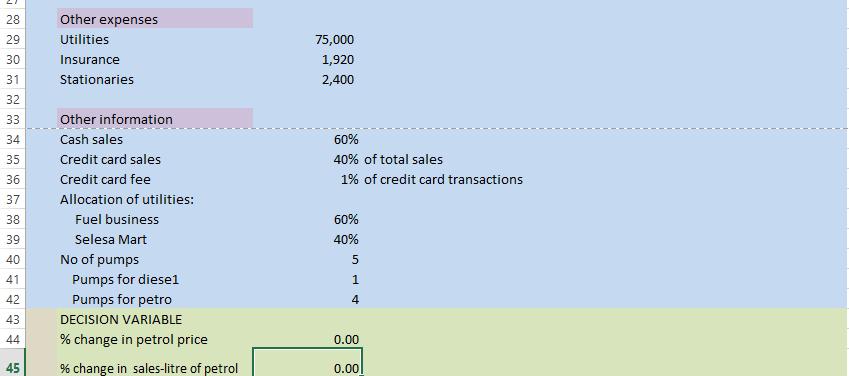
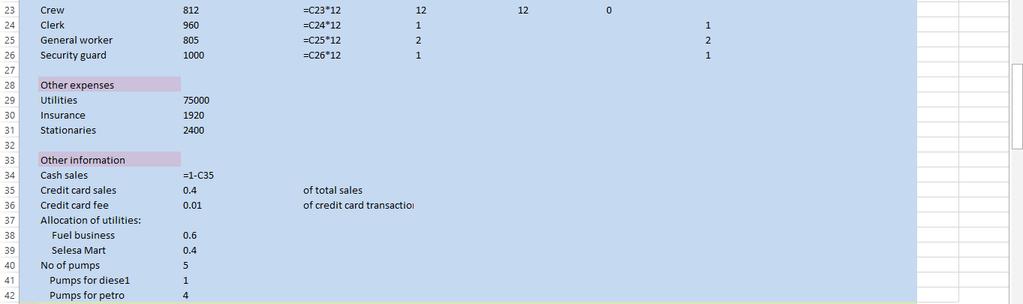
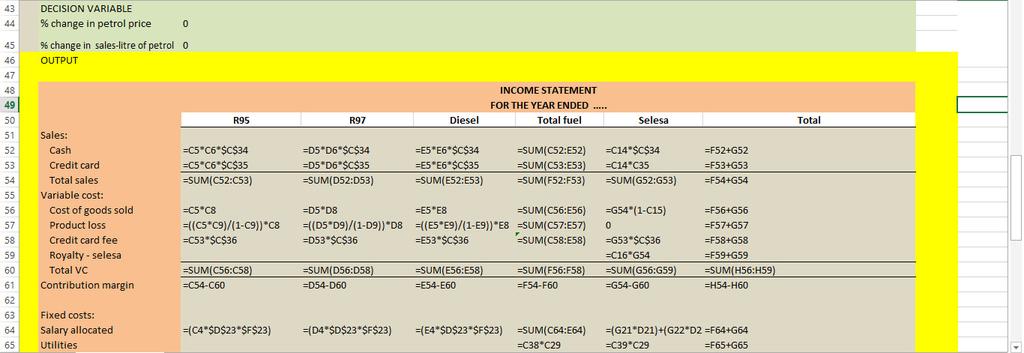
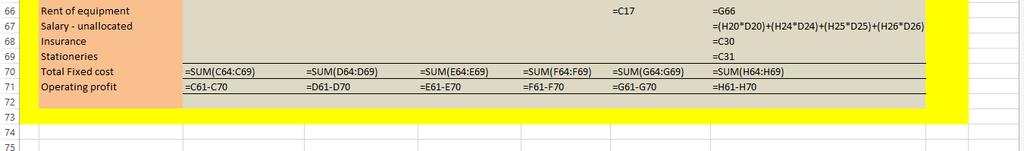
8 the fuel business is further divided into 3 segments (R95, R97 and Diesel). Thus, there are 4 segments in total. A typical spreadsheet model has three building blocks; output, input and decision variable. A model output is the ultimate quantity of interest that is computed by the model. In this case, the profits generated by the different lines of business (fuel business i.e. R95, R97, diesel and SelesaMart). A model input is an assumption about the value of a key quantity of interest that is needed to compute a model output. Models often have many inputs! For example, in this case, all the data given in the case are inputs sales in litres, sales proportion between the three types of fuel, unitcost, sales price, sales mix of fuel and SelesaMart, proportion of credit card sales (60%), credit card charge, product loss, salary and all other expenses and data required in the decision making (see Input Section of the model in Exhibit 1). Decision Variables are quantities that can be controlled by the decision maker. Baron Petrol Station may increase the litres of fuel sold if it install an ATM kiosk although there is uncertainty on the magnitude of the sales increase, so it would be the decision variable. The heart of any model is the set of relationships (usually implemented through Excel formulas) that are used to transform model inputs and decision variables into outputs. The Output Section in this case is Baron s Contribution Margin Income Statement. Note that the value of the output cells should not contain raw numbers. They should contain cell numbers of the input section. Any formulae used would be referred to the cell number in the input section. For example, in cell C53 (Credit card sales for R95), =C5*C7 should be entered. The model will not work for other scenarios if for example = *0.4 is entered in the cell. In doing a sensitivity analysis, a decision maker will only need to change 8
9 the input, for example from 60%:40% of cash sales to credit card sales ratio to 70%:30%. The output figure will automatically change. Exhibit 2 shows the formulae entered in each cell. A spreadsheet model is easier to follow if we use different colours to denote each type of building block. The model in Exhibit 1 uses the following color-coding convention: Blue for Inputs Green for Decision Variables Yellow for Output The following steps will often help us build a model: STEP 1: What do we want to use the model to accomplish? STEP 2: To accomplish our goal, what output quantities must be computed? STEP 3: What inputs and decision variables need to be determined in order to compute the needed outputs? STEP 4: Identify the key logical relationships between our inputs, decision variables, and outputs. In essence, this requires us to determine the calculations or formulas that enable the model user to turn the inputs and decision variables into output values. STEP 5: Set up a spreadsheet that uses the logical relationships to relate inputs, decision variables, and outputs. Any assumptions we make about model inputs are bound to be in error, for example, if the credit card and cash sales mix is 70%:30% instead of 60%:40% or some other combinations. For this reason, a modeller should always do a sensitivity analysis to determine how sensitive model outputs are to changes in important model inputs. An intelligent model needs to be flexible so that it can easily incorporate changes. 9
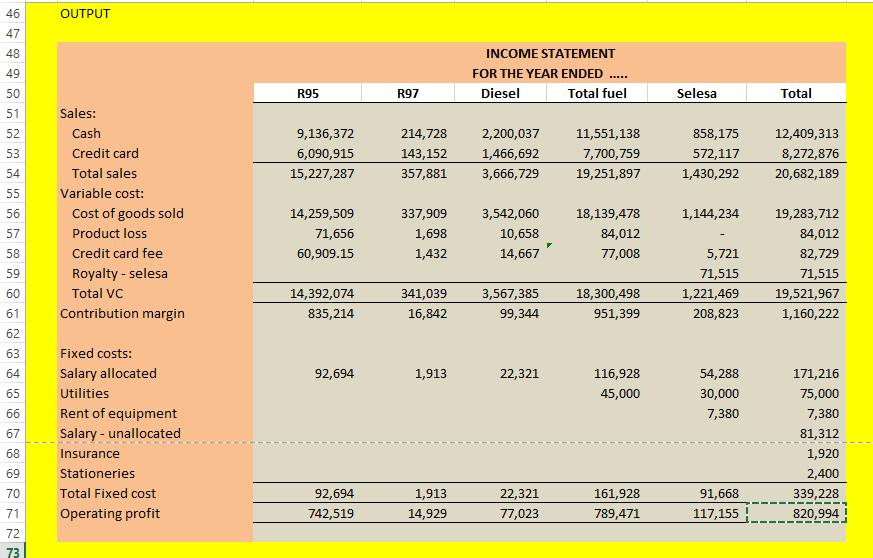
, it appears that for Baron petrol station, the whole business is profitable with net profit of")
10 Case Analysis 1. The model is as shown in Exhibits 1 and Based on Exhibit 1 under the baseline scenario when litres of fuel sold is 10,671,252 (INPUT cell F5), it appears that for Baron petrol station, the whole business is profitable with net profit of about RM820,994 (OUTPUT cell H71). However, this amount has not considered other costs (if applicable) such as lease rental on the property and renovation on petrol station. 3. Before taking into account the unallocated fixed costs SelesaMart contributes 16% of overall profitability. Thus, the claim that convenience store is subsidizing the fuel business is not supported by the evidence. 4. By changing the decision variable data in cell C44 from 0% (baseline scenario) to 15%, the operating profit of the business increased from RM820,994 to over RM1 million. While consumers feel the pinch, petrol station operators may enjoy the benefit from the price increase. Students may find this puzzling. 5. By changing the INPUT cell C35 from 40% to 20%, overall profit increased slightly from RM820,994 to RM862,358 due to the saving in credit card charges of about RM40,000 (reduced from RM82,729 to RM41,364). 6. To find the break-even, click Data, What if Analysis and Goal Seek. In the following dialog box, set cell H71 to value 0, by changing C45. 10
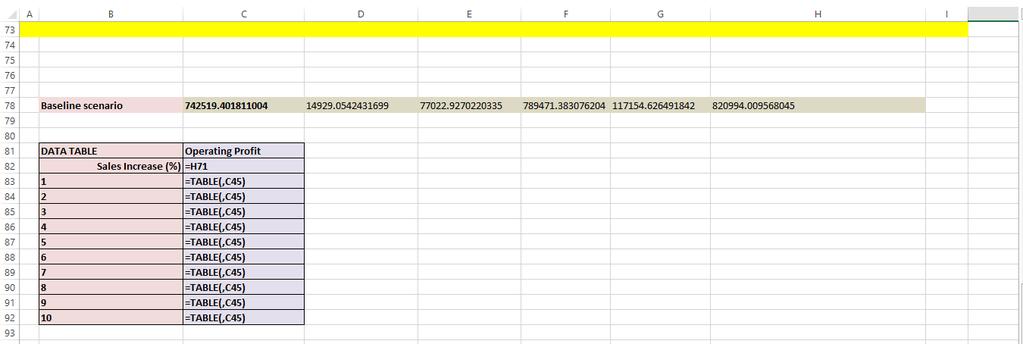
11 7. When utility is treated as variable cost, the break-even point is lower. A point to note is that as fixed costs increase the break-even point increases and the profit potential goes up with increased volume of sales. A company with higher ratio of fixed costs to variable costs is said to have higher degree of operating leverage since its operating income is more sensitive to changes in sales. Utility (RM75,000) is treated as variable cost Utility (RM75,000) is treated as fixed cost 1. Fixed Cost RM264,228 RM339, Contribution Margin Ratio (1,160, )/20,682,189 =5.25% 1,160,222/20,682,189 =5.61% Breakeven in RM RM5,032,914 RM6,047, The One-Way Data Table Analysis (Exhibit 3) shows that if fuel sales increased by 1% due to the availability of ATM kiosk, profit increased from RM820,994 (baseline scenario) to RM832,596. However under optimistic scenario, when sales is projected to increase by 10%, profit reached RM937,016. Thus, during negotiation with the bank on the appropriate fees to charge for providing the ATM kiosk, the acceptable range is about RM10,000 (under pessimistic scenario that sales increased by 1%) to about RM100,000 (under optimistic scenario that sales increased by 10%). Based on the practice where petrol stations are charged RM30,000 RM50,000 per annum by the bank for providing this off-site ATM facility, thus as long as sales increased by at least 5%, it is viable to install 11
12 an ATM kiosk. However qualitative factor such as safety risk due to potential robbery at off-site ATMs must be considered too. 12
13 Report on Preliminary Use in the Classroom The case has been tested once in a Financial Modelling class in an MBA program and twice in Integrated Case Study classes offered to final year Accounting students by one of the case writers. For the Financial Modelling class, the case was used after students were taught on how to prepare financial models to solve CVP problems with mixed products. In analyzing the case, students worked in pairs. In the Integrated Study classes, where students were not initially exposed to financial modelling, the lecturer made an attempt to teach them the techniques of financial modelling in a 3-hour class. All the students have prior knowledge on costing and CVP analysis. In solving the case, students are divided into groups of four to five people. The case contributed 10% of their overall marks for both classes. Students found the case challenging. The case sharpened their critical thinking and was able to achieve its intended objectives. A majority of the students were able to prepare a good model, and were able to use the model in sensitivity analysis. Based on the fruitful comments from the students, improvements have been made to the case. It is also interesting to ask students whether product loss due to evaporation should be treated as cost of goods sold or selling and administrative expenses in preparing the income statement for external financial reporting. Students opinion may be divided between the two. In finding the loss due to evaporations, a majority of students would merely multiply the loss percentage by the litres sold and the cost per litre (litres sold X product loss percentage X cost per litre), while a good student will calculate the loss as follows: Product loss = litres sold X [product loss percentage/(1-product loss percentage)] X cost per litre. 13
14 Other Comments The case can also be used in preparing a model to forecast the sales and operating profit of the petrol station, particularly for the years 2011 and 2012, given the statistics on the number of vehicles according to states in the Exhibits and in the text. To be able to prepare the forecast, assumptions about the cost and price of fuel, and other expenses should also be given to students. 14

15 15 Exhibit 1

16 16 Exhibit 2

17 17 Exhibit 3