Erosion and Corrosion for Oil & Gas Equipment
|
|
|
- Emil Wheeler
- 5 years ago
- Views:
Transcription
1 OIL & GAS Erosion and Corrosion for Oil & Gas Equipment (Application of CFD) Mazdak Parsi 1 SAFER, SMARTER, GREENER
2 Outline Erosion in Oil and Gas Equipment Erosion Equation Development Erosion in Choke valves CFD-based Erosion Modeling for Multiphase Flow RCA Multiphase Flow Modeling Conclusions 2

3 Erosion in Oil and Gas Equipment For the majority of oil & gas fields, sand from the reservoir formation is an inevitable by-product. Erosion: a complex mechanical process in which material is removed from the pipeline due to repeated sand particle impacts. Sand may cause damage to well components such as sand screens, tubing, down-hole safety valves, electrical submersed pumps (ESPs). Consequences: pipe failures, financial losses, environmental issues 3

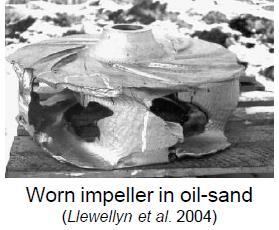

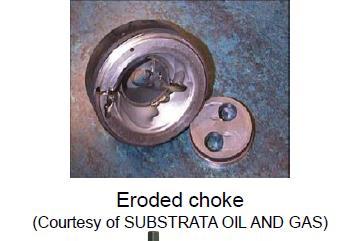
4 Examples of Erosion 4

5 CFD-Based Erosion Modeling 5


6 Erosion Equation Development Figure 3: CFD unstructured mesh with 770k elements and inflation layers around the specimen. 6
 30º")
 90º (f) flow")


7 Erosion Equation Development (a) 30º (b) 45º (c) 60º (d) 75º (e) 90º (f) flow streamlines for θ = 90º Figure 6: Contours of velocity magnitude for different impact angles (V g = 102 m/s). Velocity Contours 7
 (c) 8 Figure 11: Erosion")
 54 m/s, b) 79 m/s, c) 102")
8 Erosion Equation Development (b) (c) 8 Figure 11: Erosion ratios for gas velocities of a) 54 m/s, b) 79 m/s, c) 102 m/s.


9 Examples Erosion in Choke Valves Area of high erosion Problem: Particle impact at the small area with high velocity causing excessive erosion Flow Inlet Particle trajectories colored by velocity and associated erosion area for two chokes 9


10 Examples Erosion in Choke Valves (Cont d) Results Brick stopper Downstream piping Choke gallery 10
11 CFD-Based Erosion Modeling for Multiphase Flow 11


12 Introduction and Background Gas condensate wells Early Life Late Life pressure decreases gas flow rate decreases liquid production increases Annular flow Slug flow Churn flow transition 12

13 Wire-Mesh Sensor (Validation of CFD Results) CFD simulations require experimental data for validation. Wire-Mesh Sensor provides void fraction distribution over the pipe crosssection. Data Analysis: phase distributions, void fraction time series, periodic structure velocities, etc. 13


14 Phase Distributions (different liquid structures) Violent Agitation Void Fraction Liquid Gas Trough Gas Slug Pseudo Slug Huge Wave 14


15 CFD Simulation of Multiphase Flow Typical Mesh liquid gas Typical Inlet Conditions 15
")
16 CFD vs WMS Data (Void Fraction Time Series) 16
17 CFD vs WMS (Radial Void Fraction Profile) V SG = 10.3 m/s V SL = 0.30 m/s V SG = 18.1 m/s V SL = 0.30 m/s V SG = 27.3 m/s V SL = 0.30 m/s 17
18 18
19 CFD-based Erosion Modeling for Multiphase Flow Unsteady flow simulation and particle tracking are simultaneously performed. The value of mass removal of wall per unit area was recorded during the simulation run-time. When the rate of mass removal reached a steady-state condition, the rate was used for erosion computation. 19
20 CFD-based Erosion Modeling for Multiphase Flow V SG = 10.3 m/s V SL = 0.30 m/s Steady-state Particles start to impact 20
21 CFD-based Erosion Modeling for Multiphase Flow V SG = 27.3 m/s V SL = 0.30 m/s 21
 Experiment CFD Case No.")
 V SL (m/s) Particle Size (micron) Erosion Rate (mpy) 1 9.")


22 Comparison of CFD Erosion Results to Experimental Data CFD vs Experiments (Parsi et al.; 2015) Experiment CFD Case No. V SG (m/s) V SL (m/s) Particle Size (micron) Erosion Rate (mpy) V SG (m/s) V SL (m/s) Particle Size (micron) Erosion Rate (mpy) Experimental UT Data Acquisition Experiments: ultrasonic technique was employed to measure erosion rates for a variety of flow conditions. 22


23 Erosion in Horizontal Multiphase Flow Passage of a pseudo slug (flow direction from left to right) 23
24 Void Fraction Time Series Distance from inlet X= 1m X= 5m X= 9m 24

25 Iso-void Fraction 25
.")
26 Erosion in Horizontal Multiphase Flow Liquid film covering a large region of the elbow (flow direction from left to right). 26
27 27
28 time-step air-water phase distributions particle concetration t = 39.0 s t = 40.0 s t = 44.0 s t = 46.0 s t = 50.5 s 28
29 Particle Distribution 29

30 Erosion Contour 30
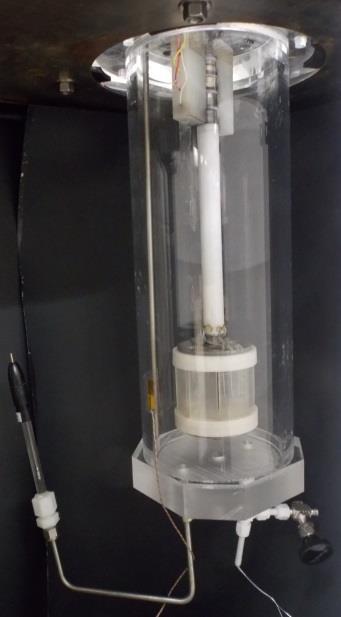
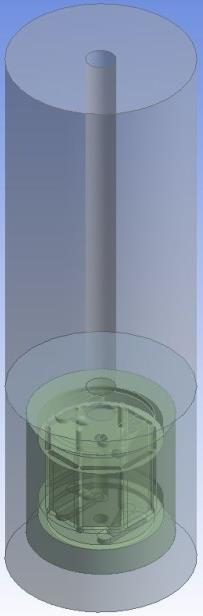
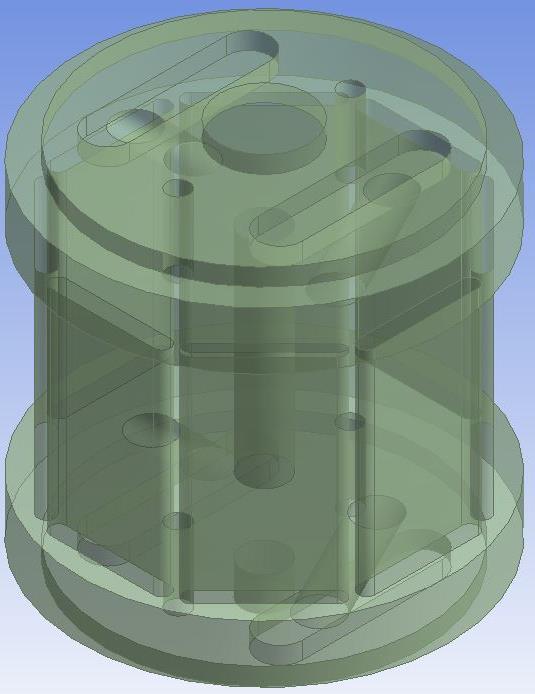
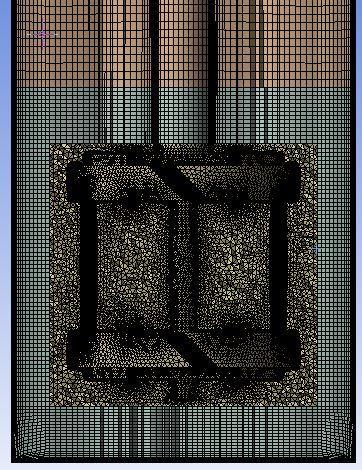
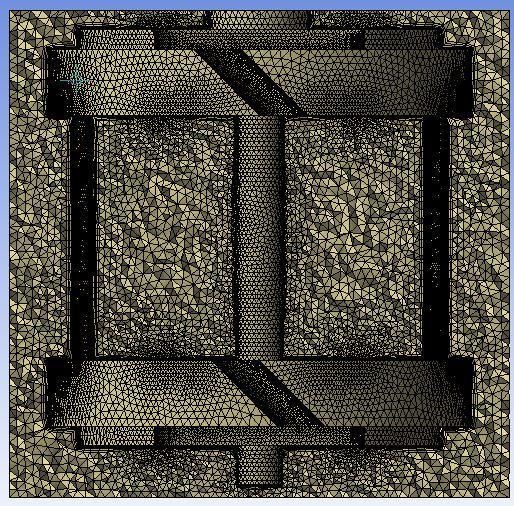
31 RCA Multiphase Flow Modeling Figure 1. Model of RC and computational grid. 31

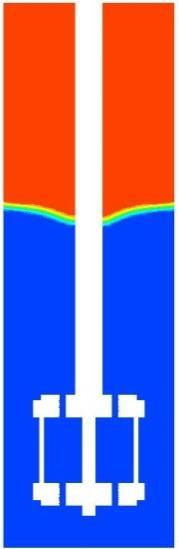
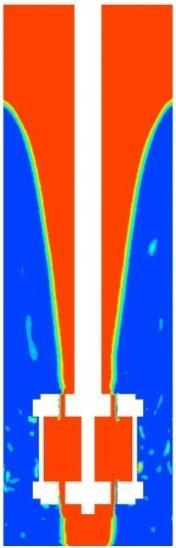
32 Iso-void Fraction & Phase Distributions rpm 600 rpm 800 rpm 1200 rpm
33 Vortex Height: CFD vs. Exp. 33


34 Wall-Shear Stress Contours outer surfaces inner surfaces 34
35 Wall-Shear Stress Time Series 200 rpm 600 rpm 800 rpm 1200 rpm 35
36 Wall-Shear Stress 36
37 Acknowledgement Dr. Mustafa Kara (DNV GL) Dr. Jose Vera (DNV GL) Mr. Madhu Agrawal (BP) Dr. Anchal Jatale (ANSYS) 37
38 SAFER, SMARTER, GREENER 38