In-Process Inspection of Selective Laser Melting by Quantitative Optical Tomography
|
|
|
- Matthew Jones
- 5 years ago
- Views:
Transcription


1 In-Process Inspection of Selective Laser Melting by Quantitative Optical Tomography A. Ladewig, J. Bamberg, G. Zenzinger, 42. MPA-Seminar, October 5th
2 Outline Selective Laser Melting Quality Assurance Concept Online Monitoring by Optical Tomography Quantification of Optical Tomography Results 2
3 Selective Laser Melting Quality Assurance Concept Online Monitoring by Optical Tomography Quantification of Optical Tomography Results 3

4 From Powder to Part Trumpf, 3druck.com 4
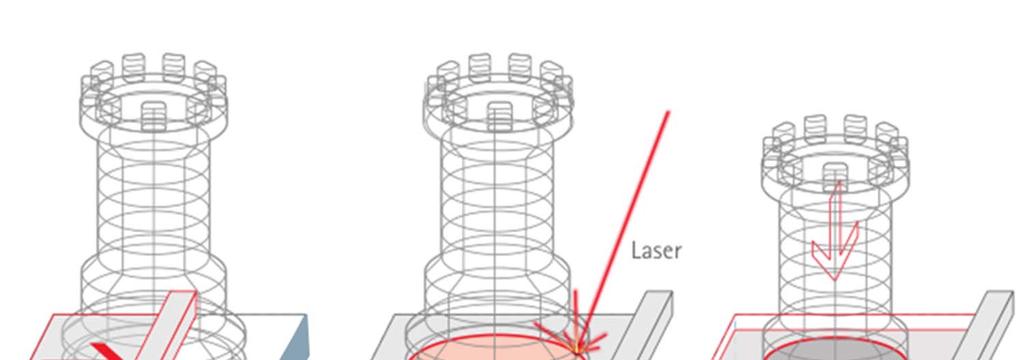
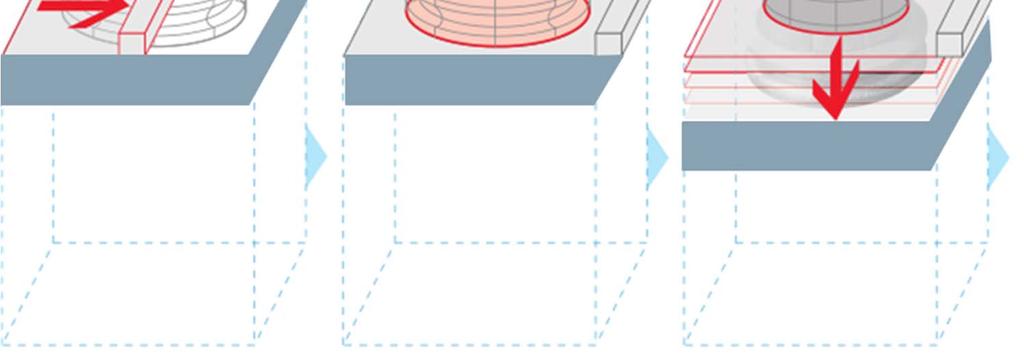
5 SLM-Principle Build-up layer by layer 5
 total: 7 machines Materials IN718 MAR-M509 Stainless Steel 316L")
6 Additive MTU Additive MTU 6 production machines (M280) 1 technology machine (M290) total: 7 machines Materials IN718 MAR-M509 Stainless Steel 316L (Ti6Al4V) 6

7 Laser Melting The AM Machine Laser power: 400 W; Diameter: <100 µm Scanning speed: up to 7 m/s; typical 1 m/s Platform size 250x250 mm The AM Process Meltpool size ~ 100 µm High temperature gradients Powder size ~30 µm 7

8 Layer Build-up Layer thickness: 40 µm (IN718) Time for one layer varies depending on the part complexity 8


9 Final Parts Complex, hollow 3d-structures Up to 7000 layers Grinding wheel Fuel nozzle 9

10 Our Target: Aero-Engine-Parts Situation: - Aero-engines have a lot of complex shaped, hollow parts Opportunity: - Simplify manufacturing - Realize new designs Challenge: - High quality requirements 10
11 Selective Laser Melting Quality Assurance Concept Online Monitoring by Optical Tomography Quantification of Optical Tomography Results 11


12 Phases of Implementation Phase 3: New AM Design Manufacturing of functional structures to reduce weight and cost (bionic design) Phase 2: Substitution Cost effective manufacturing of raw parts Substitution of castings Phase 1: Tooling, Rig and Development Hardware Manufacturing of tooling, Rig- and development hardware 12


13 The Four Columns of Quality Assurance for SLM QA QA QA QA Raw Material / Powder Production- Line SLM-Process Final Part e.g. Particle Size Distribution e.g. Machine Calibration / Approval e.g. Layer Thickness e.g. Metrology and NDT: X-CT, FPI, VT 13

14 Problem: Lack-of-Fusion Defect SLM-process deviations can lead to lack-of-fusion defects Internal defect NO FPI 3D part geometry NO UT Too small compared to part thickness Metallographic Cross Section NO X-Ray Online Process Monitoring necessary! 14
15 Selective Laser Melting Quality Assurance Concept Online Monitoring by Optical Tomography Quantification of Optical Tomography Results 15


16 Principle of Optical Tomography Laser Camera Long time exposure of urban traffic traffic volume Brightness in the picture equals radiance x time Measurement for energy input / distance energy Long time exposure in additive manufacturing amount of heat 16


17 Data Generation scmos-camera thermal stabilized max 100 Hz 5 MegaPixel filter Noise reduction Image processing Online analysis 1 image / layer Up to 5000 images / part 17

18 Realization of Optical Tomography 18

19 OT Image Build-up 19

 Monitoring layer by layer without lack of data acquisition")
20 Features of Optical Tomography Geometry & Metrics Welding Parameters Process Deviations All of them with high lateral resolution (0.1 mm x 0.1 mm) Monitoring layer by layer without lack of data acquisition Optical 3D characterization of the complete SLM build job 20


21 Optical Tomography and Process Perturbation From 2d OT image stack by X-ray rendering software 2d OT image of boroscope bosses 3d OT image of a boroscope boss with indications due to process perturbation 21
22 Selective Laser Melting Quality Assurance Concept Online Monitoring by Optical Tomography Quantification of Optical Tomography Results 22

23 Build Jobs with Forced Process Perturbations Build jobs with 120 cylindrical specimens Each specimen with 10 localized process perturbations Process perturbation by Argon gas flow reduction Production of lack of fusion defects 23


24 OT Images of Process Perturbations High Resolution (up to 5 µm) Xray Lack of Fusion Correlation Many different indications Detail 3d-Image 24


25 Comparison of OT- and X-Ray Images 400 perturbated layers compared Algorithm developed using OT brightness values, size of indications and threshold value (signature) From In-Process Monitoring to In-Process Control H. U. Baron, A. Ladewig We.2.D OT signature correlates to defect size down to 50 µm


26 Validation of X-Ray Images X-ray image of perturbated layer Metallographic cross-section Rupture test All X-ray indications confirmed 26
27 Selective Laser Melting Quality Assurance Concept Online Monitoring by Optical Tomography Quantification of Optical Tomography Results 27
28 Result I Correlation between OT-signature and defect size exists Probabilitiy of detection (POD) evaluated Sensitivity: 150 µm defect 90/95% POD Automatic defect detection and classification developed Optical Tomography is now a quantitative inspection tool for lack of fusion defects. 28


29 Result II OT process control installed on all our SLM machines 100 % process control of all build jobs OT systems will be available commercially from EOS 29


30 Thank You for Your Attention! 30