1. To learn and to gain experience in the preparation of metallographic specimens.
|
|
|
- Violet Banks
- 5 years ago
- Views:
Transcription
1 METALLOGRAPY Objectives 1. To learn and to gain experience in the preparation of metallographic specimens. 2. To examine and analyze the microstructures of metals and metallic alloys. 1.Introduction Microscopical Examination The microstructural study of a material can provide information regarding the morphology and distribution of constituent phases as well as the nature and pattern of certain crystal imperfections. Optical metallography is a basic tool of material scientists, since the equipment is relatively inexpensive and the images can be obtained and interpreted easily. Distribution and morphology of the phases can be studied and, if their properties are known, a quantitative analysis of the micrographs provides some information about the bulk properties of the specimen. A limited study of line and surface informations is also possible with the optical microscope. In order to obtain reproducible results, with good contrast in the image, the specimen surface is polished and subsequently etched with appropriate reagents before microscopic examination. In a polished specimen, the etching not only delineates grain boundaries, but also allows the different phases to be distinguished by differences in brightness, shape, and color of the grain. Differences in contrast may result from differences in light absorption characteristics of the phases. Etching results in preferential attack or preferential colouring of the surface. The preferential attack is electrochemical corrosion; it is well known that different materials corrode at different rates. Grain boundaries are often anodic to the bulk metal in the interior of the grain and so are etched away preferentially and delineated. Staining is produced by the deposition of solid etch product on the specimen surface. This is formed by chemical reaction between the etchant and the specimen. Under favorable conditions the use of a proper etchant enables the identification of constituents. Failure analysis depends a great deal on metallographic examination. Microstructural examination can provide quantitative information about the following parameters: 1) The grain size of specimens 2) The amount of interfacial area per unit volume 3) The dimensions of constituent phases 4) The amount and distribution of phases. Magnifications up to 1000x can be obtained with a resolution of 2µ. For grain size measurements, the grains along a line, circle, or within a known area are counted. It would be useful to obtain an 1
 can be noted.")
2 average value of grain diameter from a microstructural section. In linear intercept method, the grains intercepted by a theoretical line on the specimen surface are counted (Fig. 1). The number of grain boundaries intersected per unit length of a test line (nl) can be noted. The average grain size; NL=Ni/(L/M) NL: mean number of interceptions per unit length, Ni: the number of interceptions counted on the field, L: the length of the test line(s) used in mm, M = the magnification. Fig.1 Linear intercept method for grain size determination Specimen preparation for Microscopical Examination Grinding A small piece of specimen is cut by a metal cutting saw. After cutting operation, burrs on the edges of the specimen should be carefully removed by a fine file or coarse grinding paper. The silicon carbide grinding papers are held flat in a unit containing water facility for lubrication purpose. Each unit contains four grades of papers, starting with grade 400 (coarse) and finishing with grade 1200 (fine). Grinding of the work piece is done by starting with the coarse papers and then continuing with the fine papers. In each stage, grinding is done by rubbing the specimen backwards and forwards on the grinding paper in one direction only, until the surface is completely ground, that is, until only grinding marks due to this particular paper can be seen to cover the whole surface. The specimen is washed thoroughly to remove coarse silicon carbide particles before proceeding to a finer paper. The direction of grinding is changed from paper to paper, so that the removalof previous grinding marks is easily observed. The extra time spent on each paper should be increased as the finer papers are used. At the end of the grinding sequence, the specimen is washed thoroughly and dried. Now, the specimen is ready for polishing. 2
3 Polishing The polishing is done on rotating wheels covered by a special cloth. Alumina is employed as polishing agent. The 1 micron size is commonly used, but the total polishing time shortened by starting on the 7 or 3 micron grade. The pad should be kept well supplied with lubricant. The specimen should be held firmly in contact with the polishing wheel, but excessive pressure should be avoided. During polishing the specimen should be rotated or moved around the wheel so as to give an even polish. The specimen should be thoroughly cleaned and dried between each wheel. Etching Before etching, it is essential to ensure that the polished surface is grease and smear free. If the final polishing has involved the use of magnesia ( in the form of an aqueous paste of fine magnesia) or alumina (in the form of an aqueous suspension of fine alumina), then thorough washing followed by drying off with acetone or alcohol will give a suitable surface, although it must not be fingered afterwards. Etching is generally done by swabbing. Etching times will vary from specimen to specimen, however, a good general, procedure is to observe the surface during etching, and to remove the specimen when evidence of the grains first appears. Microscopical examination will then reveal whether the degree of etching is sufficient. Further etching can then follow to strengthen up the details as required. After each etching, the specimen should be thoroughly washed in running water, followed by drying off with acetone or alcohol. 2.Tests and Results 1. Put microstructure photos with correct magnification bar. 2. Explain the specimen typical microstructure. 3. Calculate the average grain diameter of the micrograph, using linear intercept method. 3.Discussion 1. Why must metallographic samples be washed and carefully dried before proceeding from one grinding or polishing operation to the next? 2. What is the purpose of etching metallographic samples? 3. Why are metallographic samples sometimes mounted in plastic? 4. What is the difference between a Eutectoid steel and a Hypoeutectoid steel? 5. At room temperature : What are the phases of a eutectoid steel? What are the constituents of a eutectoid steel? What are the phases of a hypoeutectoid steel? What are the constituents of a hypoeutectoid steel? 6. Briefly explain the effect of grain size on the strength of a metal. 4. What is Grain Size and Grain Number? Relation between ASTM Grain Size and Grain number? 7. How to reduce the grain size? 8. Why with decreasing grain size there is decrease in impact transition temperature? Please explain it by using Hall Petch equation. 3

4 ROUGHNESS MEASUREMENTS Objectives 1. To expose student about surface roughness measurement theory. 1.Introduction Roughness is a measure of the texture of a surface. It is quantified by the vertical deviations of a real surface from its ideal form. If these deviations are large, the surface is rough; if they are small the surface is smooth. Roughness is typically considered to be the high frequency, short wavelength component of a measured surface (see surface metrology).roughness plays an important role in determining how a real object will interact with its environment. Rough surfaces usually wear more quickly and have higher friction coefficients than smooth surfaces. Roughness is often a good predictor of the performance of a mechanical component, since irregularities in the surface may form nucleation sites for cracks or corrosion. Although roughness is usually undesirable, it is difficult and expensive to control in manufacturing. Decreasing the roughness of a surface will usually increase exponentially its manufacturing costs. This often results in a trade off between the manufacturing cost of a component and its performance in application. Measurement. Roughness may be measured using contact or non contact methods. Contact methods involve dragging a measurement stylus across the surface; these instruments include profilometers. Non contact methods include interferometry, confocal microscopy, electrical capacitance and electron microscopy. Principle of a contacting stylus instrument profilometer: A cantilever (1) is holding a small tip (2) that is sliding along the horizontal direction (3) over the object's surface (5). Following the profile the cantilever is moving vertically (4). The vertical position is recorded as the measured profile (6) shown in light green. 1

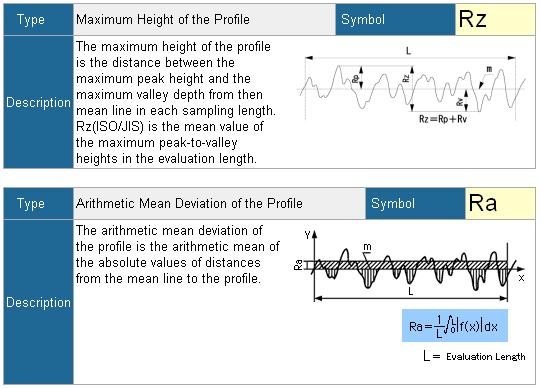
5 Sketch depicting how a probe stylus travels over a surface. For 2D measurements, the probe usually traces along a straight line on a flat surface or in a circular arc around a cylindrical surface. The length of the path that it traces is called the measurement length. The wavelength of the lowest frequency filter that will be used to analyze the data is usually defined as the sampling length. Most standards recommend that the measurement length should be at least seven times longer than the sampling length. The assessment length or evaluation length is the length of data that will be used for analysis. Commonly one sampling length is discarded from each end of the measurement length. Roughness Parameters. Each of the roughness parameters is calculated using a formula for describing the surface. There are many different roughness parameters in use, but R a is by far the most common. Other common parameters include R z, R q, and R sk. Some parameters are used only in certain industries or within certain countries. For example, the R k family of parameters is used mainly for cylinder bore linings, and the motif parameters are used primarily within France. Since these parameters reduce all of the information in a profile to a single number, great care must be taken in applying and interpreting them. Small changes in how the raw profile data is filtered, how the mean line is calculated, and the physics of the measurement can greatly affect the calculated parameter. Amplitude Parameters. Amplitude parameters characterize the surface based on the vertical deviations of the roughness profile from the mean line. Many of them are closely related to the parameters found in statistics for characterizing population samples. For example, Ra is the arithmetic average of the absolute values and Rt is the range of the collected roughness data points. 2
6 3
7 Tests and Results 1. Measure the surface roughness after each grinding step. 2. Record these readings in Table 1. Table 1. Roughness measurement of normalized steel Measurement Number Mean Value After 400 grit grinding After 800 grit grinding After polishing Discussion 1. What is purpose the surface roughness measurement? 2. What are the different methods to measure the roughness of a surface? 4
8 JOMINY HARDENABILITY TEST Objectives 1. Introduce students to the concepts of hardenability 2. Demonstrate hardenability in a steel 3. Display the effects on microstructure of the hardening process 4. Provide instruction for a full lab experiment on hardenability (if equipment is available) 1.Introduction The hardenability of a steel is defined as that property which determines the depth and distribution of hardness induced by quenching ftom the austenitic condition. The dependence of hardness upon quenching rate can be understood ftom the time temperature transformation characteristics of steel, and, for a particular steel, can be estimated from the T T T diagram. A part may be hardened by quenching into water, oil, or other suitable medium. The surface of the part is cooled rapidly, resulting in high hardness, whereas the interior cools more slowly and is not hardened. Because of the nature of the T T T diagram, the hardness does not vary linearly from the outside to the center. Hardenability refers to capacity of hardening (depth) rather than to maximum attainable hardness. The hardenability of a steel depends on (1) the composition of the steel, (2) the austenitic grain size, and (3) the structure of the steel before quenching. In general,hardenability increases with carbon content and with alloy content. The most important factor influencing the maximum hardness that can be obtained is mass of the metal being quenched. In a small section, the heat is extracted quickly, thus exceeding the critical cooling rate of the specific steel and this part would thus be completely martensitic. The critical cooling rate is that rate of cooling which must be exceeded to prevent formation of nonmartensite products. As section size increases, it becomes increasingly difficult to extract the heat fast enough to exceed the critical cooling rate and thus avoid formation of nonmartensitic products. Hardenability of all steels is directly related to critical cooling rates. Procedure Sample of medium carbon steel machined to the shape shown in Fig.1. It is a cylindirical bar with a 25 mm. diameter and 100 mm. length. The specimen is placed in the furnace at C for about 1 /2 1


9 hour. The water flow rate is adjusted so that the water column is approximately the distance 50 mm above the end of the pipe, when water is flowing freely. After the sample has been austenitized, it is removed from the furnace and placed directly into the quenching apparatus. A jet of water is quickly splashed at one end of the specimen. After the entire sample has cooled to room temperature, the scale oxidation is removed; two opposite and flat parallel surfaces are ground along the length of the bar. Rockwell C hardness measurements are then made every 2 mm and these readings are recorded. Results Plot a hardenability curve of Rockwell hardness vs. distance from the quenched end. 2
. 2. Why is hardness important? When is hardness important? 3.")
10 2.Tests and Results 1. Evaluate the hardenability of the steel used in this experiment using the plotted hardenability curve. 3.Discussion 1. How is the role of carbon and various alloy elements on the hardenability of steels (Give examples of different hardenability curves ). 2. Why is hardness important? When is hardness important? 3. What is hardenability? Where is it used in industry? 4. Do all steels have the same hardenability? Why or Why not? 5. How does the hardness change as a function of distance from the quenched end? 6. How does grain size relate to hardness? What would a graph of grain size as a function of distance look like? 7. Does the hardness of the martensite phase change with steel composition, or is the hardness value a constant? References 1. Shackelford, IF, Introduction to Materials Science 2. Smith, W.F., Principles of Materials Science and Engineering 3. ASM, Heat Treater's Guide S 3


11 TITLE PAGE OF LAB REPORT Mechanical Engineering Department Course Name: Semester and Year: Lab.Groupe: Material Heat Mechanical Name of Lab Instructor: Date of Experiment Performed: Date of Report Submitted: Title of Experiment: Name of Team Leader: Instructor Comments: Names of Group Members: Grade:
12 EXPERIMENTAL METHODS FORMAT FOR LABORATORY REPORTS Title page: Use the standard cover page downloadable from course website: (10 point) A laboratory report must contain the following sections in the given order: Results: max. 3 pages Give the results of your experiment and discuss them. Compare and contrast your observations with those reported in the relevant literature. Use tables and figures as necessary. (30 point) Discussions:. Answer the questions at the end of your experiment sheet in this section.(50 point) References: References must be numbered in square brackets in the text and figure/table captions in increasing order and must be listed in the same order in the end of your report in the following format: (10 point) 1. W.D. Callister, Jr., Fundamentals of Materials Science and Engineering An Integrated Approach, John Wiley & Sons, Inc., USA,