MODELLIZZAZIONE DEI PRODOTTI EVITATI GRAZIE AI MATERIALI OTTENUTI DAL RICICLO. Politecnico di Milano DICA Sezione ambientale Centro Studi MatER
|
|
|
- Hugh Harrison
- 5 years ago
- Views:
Transcription


1 MODELLIZZAZIONE DEI PRODOTTI EVITATI GRAZIE AI MATERIALI OTTENUTI DAL RICICLO Lucia Rigamonti, Mario Grosso Politecnico di Milano DICA Sezione ambientale Centro Studi MatER
2 The context Materials from the recycling = secondary materials Quality and market of secondary materials evaluation of the benefits associated with the recycling increase of the reliability of Life Cycle Assessment (LCA) studies used as a support decision tool in the choice of waste technologies and treatments aimed at the sustainable use of resources and to close the loop waste-management-oriented LCA and circular economy 2
3 Evaluation of the benefits associated with the recycling Question 1: Is the secondary material really a product or is it a waste? Market value: > 0 product it is reasonable to assume that the secondary material is sold and can substitute for materials/products on the market evaluation of the benefits associated with the recycling < 0 waste no benefits 3


4 Evaluation of the benefits associated with the recycling In the case of: secondary material = product Question 2: What is the actual market of the secondary material? What is the secondary material used for? Close-loop recycling Open-loop recycling same primary route Open-loop recycling different primary route 4
5 Evaluation of the benefits associated with the recycling In the case of: secondary material = product Question 3: What is the origin of the substituted material? Virgin raw material (i.e. primary material) consequential LCA Average origin, i.e. a mix of virgin and recycled material attributional LCA 5
6 Evaluation of the benefits associated with the recycling In the case of: secondary material = product Question 4: What is the quality of the secondary material compared to the quality of the substituted material? 7
7 Down-cycling The technical properties of a material can be unfavourably changed in the recycling process. This means e.g.: - the secondary material can replace the primary material only in certain applications - the secondary material can replace the primary material only after additional measures have been performed, and/or to a limited degree, or for a limited duration - there is a limit to the number of cycles of recycling that the material can afford - a higher amount of the recycled material is needed than of the virgin material to provide the same functionality - the secondary material has to be mixed with primary material or higher quality secondary material to meet the minimum technical specifications Down-cycling is the term generally used to account for such a phenomenon 8
8 Paper Quality of secondary materials The reduction in swelling and the loss of fibre flexibility after drying reduce the strength potential of recovered fibres (Bajpai, 2014) In the recycling process, the fibres lose their resilience due to the progressive reduction of their length and of the bonds between the fibres (Pro Carton, 2016) Fibres can be recycled 5 to 7 times on average (Pro Carton, 2016) Additives potentially present in paper products may be re-introduced to the paper production process once the waste paper is recycled. This may lead to accumulation of additives in newly manufactured paper and board products (Pivnenko et al. 2013). Mineral oil hydrocarbons are among the identified substances in additives. In packaging industry, mineral oils might contaminate paperboards used for food packaging (Kral et al., 2013) 9
9 Plastic Quality of secondary materials Properties of recycled plastics are not consistent, but inherent loss of properties occurs at each recycling step, which limits the recycling numbers (Kaillala and Nousiainen 1999, Cheng et al. 2010) The aspects affecting plastics recycling are e.g. greyish color and less good processing properties of recycled polymers due to limited sorting specificity and remaining content of additives, fillers, polymer cross contamination, non-polymer impurities and degradation (EC-JRC, 2010, Wiedmann et al. 2009) In the plastic industry, stabilizers like cadmium, lead and tin, as well as flame retardants, might contaminate the recycled products (Kral et al., 2013) One of the factors primarily influencing quality of plastics recycling is the presence of additives. The metal analysis of Cr in 48 analysed waste plastic samples showed potential spreading and accumulation of chemicals ending up in the waste plastics (Pivnenko et al., 2015) 10
10 Aluminium Quality of secondary materials Mixed scrap streams contain a high variety of alloying elements, which prevent their recycling into a wrought product, therefore most of the mixed Al scrap is nowadays used to produce cast alloys (Paraskevas et al., 2013) The potential use of secondary aluminium is affected by the content of alloying elements (Nakajima et al., 2010). Nakajima et al. (2010) quantitatively demonstrated the limit of removal of impurity elements during the aluminum remelting process The quality of secondary aluminium is affected by its oxidation level (estimated between 11% and 23% for Al from bottom ash above 0.8 mm, Biganzoli and Grosso, 2013) According to the European Aluminium Association (EAA) (2013) if the recycling operations lead to a change of the inherent properties of the recycled Al compared to primary Al, a market value analysis should be carried out to clarify whether it is necessary to apply a value correction or not Corrected substitution ratios were proposed by Koffler and Florin (2013) 11
11 Quality of secondary materials Steel Decisive for steel quality and therefore for the field of application is the concentration of tramp elements, such as copper and tin. As these elements are nobler than iron and not volatile, they are also critical for the recycling process (Reck and Graedel, 2012; von Gleich et al., 2004) Scrap-input quality which, in turn, depends on the alloying elements and on the degree of material separation (Haupt et al., 2016) According to Nakamura et al. (2012), when the contaminants occurring in secondary materials exceed the maximum content allowed for the target product to be produced out of the secondary material, additional high purity materials must be added to dilute the contaminant to an acceptable level Due to the accumulation of tramp elements, however, high quality products such as sheet metal for the automotive industry need to be produced from primary material (Nakamura et al., 2014) 12
12 General mass balance of the recycling process 1000 kg of collected material (usually impure) SYSTEM BOUNDARIES OF THE RECOVERY PROCESS SORTING residues < 1000 kg of sorted (clean) material RECYCLING residues << or <<<1000 kg of primary material << 1000 kg of new material (i.e. secondary material) 13


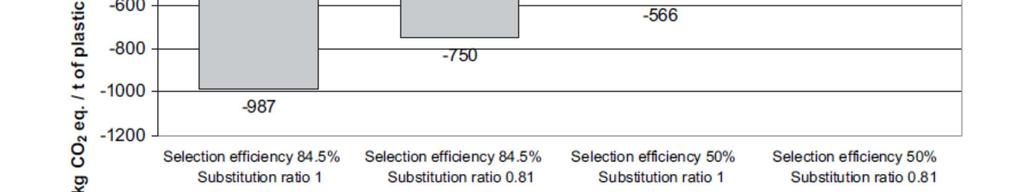
13 Case study - 24% - 25% 14
14 Case study Gentil et al.,
15 The replacement coefficient replacement coefficient : the coefficient quantifying the amount of primary material that can be replaced by the waste-derived material at a certain point (i.e. the point of substitution) of the recycling chain* Replacement coefficient R = Q * M Q = coefficient that takes into the quality of the waste-derived material compared to quality of the primary material, at the point of substitution. This coefficient represents to what extent the inherent properties of the material are kept in recycling activities. M = coefficient that takes into account the existence of a market for the wastederived material, i.e. it is 0 if there is no market, it is e.g. 0.5 if only 50% of the waste-derived material has a market, it is 1 if all the material is used in the market. *case where the waste-derived material replaces the same virgin material, either in the same application or in a different application, but replacing the same primary production route 25
16 The replacement coefficient Why coefficient M? Because the existence of a market depends: - on the quality of the waste-derived material (considered in coefficient Q), e.g. if the quality of the waste-derived material is low, this may be used only in certain applications that alone are not able to absorb all the produced material - on the diffidence and the lack of knowledge on the quality of the wastederived material by the potential users: cases may exist where the quality of the waste-derived material is good, but the market is not developed due to the cited reasons Coefficient M can be calculated considering the percentage of the wastederived material actually sold by the producer out of the total wastederived material produced. 26
17 The replacement coefficient Other possible formulation of the replacement coefficient (indeed already present in literature: Schrijvers et al., 2016b): R = P P = market-price ratio of the waste-derived material to the superseded primary material. It varies between 0 and 1. In some cases it can be even higher that 1 27
18 The replacement coefficient R = Q * M Approach based on technical consideration (e.g. technical properties, maximum number of recycling cycles), but at the same time it includes the fundamental information about the actual use of the secondary material Weaknesses: the calculation of coefficient Q involves subjective choices on which technical property to consider for correction R = P Approach based on economic considerations but at the same time it implicitly includes information about the quality of the secondary material (in fact, if the quality is really low, the market-price ratio will be near to zero) Weaknesses: the market-price ratio can vary over time and therefore the LCA has a limited temporal validity If data are available, we recommend to calculate the replacement coefficient according to both formulations and then to take the lowest value. The other one might be used in a sensitivity analysis. 28
19 The replacement coefficient The replacement coefficient shall be calculated and applied at the point of substitution: Point of substitution: it is the exact point along the recycling chain where the material derived from the waste can be used in substitution of the corresponding primary material Different considerations can be applied to the examined materials, e.g.: - For paper, the substitution is at the level of pulp - For aluminium, the point of substitution is identified at the Al scrap level - As iron and steel are produced in two different processes, the output of the production, i.e. the liquid steel, offers the best point of substitution - In the case of plastics, the point of substitution is at the end of the recycling chain 29
20 The replacement coefficient To calculate the amount of displaced primary material, the replacement coefficient shall be multiplied by the amount of waste-derived material at the point of substitution when the point of substitution is at the end of the recycling chain: Parameter Value Sorting efficiency 90% Reprocessing efficiency 85% Q (quality) 0.83 collected material: 1000 kg secondary material: 1000 kg * 0.9 * 0.85 = 765 kg M (market) 1 avoided primary material to be modelled in the LCA = 765 kg * 0.83 * 1 = 635 kg 30
21 Conclusions and perspectives The quality and the actual market of the secondary material strongly affects the performances of material recycling Research is needed to move from quantitative recycling to quality recycling, especially when very high levels of source separation are achieved, which means that the separated materials are far from being pure Paper in submission (special thanks to M. Niero, M. Haupt, M. Grosso, J. Judl, K. Manninen, L. Zampori) 34
22 GRAZIE PER L'ATTENZIONE! CONTATTI: