Bulk Metallic Glasses
|
|
|
- Alexandrina Porter
- 5 years ago
- Views:
Transcription
1 2018 Spring Advanced Physical Metallurgy Bulk Metallic Glasses Eun Soo Park Office: Telephone: Office hours: by appointment 1
2 * Development strategy of completely new materials a. Alloyed pleasures: Multi metallic cocktails b. Synthesize metastable phases Equilibrium conditions Non equilibrium conditions : non equilibrium processing = energize and quench a material
3 Chapter 2. Metallic Glass If liquid is cooled, two events can occur. 1) Crystallization (solidification at T m.p. ) 2) Undercooled below T m.p. More viscous (supercooled) Glass 3
4 If liquid is cooled, two events can occur. Melting and Crystallization are Thermodynamic Transitions Discontinuous changes in structure and properties at T m Structures are thermodynamically controlled and described by the Phase Diagram T melting and T liquidus have fixed and specific values, 1710 o C for SiO 2, for example The Glass Transition is a Kinetic Transition Continuous changes in structure and properties near T g Structure and properties are continuous with temperature Structures and properties can be changed continuously by changing the kinetics of the cooled or reheated liquid 4
5 Melting and Crystallization are Thermodynamic Transitions Solidification: Liquid Solid <Thermodynamic> Interfacial energy ΔT N T m Liquid Undercooled Liquid Solid No superheating required! Interfacial energy No ΔT N SL LV SV vapor Melting: Liquid Solid In general, wetting angle = 0 No superheating required!
6 * Quasi chemical approach SL LV SV Solid: force between pairs of atoms vaporize: break all pairwise bonds For, example: Copper (Cu) Vaporization Melting Heat of vaporization 80 Kcal/mole vs Heat of fusion 3.1 Kcal/mole 25 times 1/25 broken Melting: each bond is replaced by one with 4 percent less E, although bond energy of liquid is changed by the positions. Heat of fusion during melting: need to generate weaker liquid bonds 6
7 7
8 * Comparison between experiment and theory Most metal ΔT N < several K but Turnbull and his coworker ΔT N larger (~several hundreds K) by formation of large number of very small drops 8
9 9

10
11 Glass Formation is Controlled by Kinetics Glass-forming liquids are those that are able to by-pass the melting point, T m Liquid may have a high viscosity that makes it difficult for atoms of the liquid to diffuse (rearrange) into the crystalline structure Liquid maybe cooled so fast that it does not have enough time to crystallize Two time scales are present Molar Volume glass liquid Internal time scale controlled by the viscosity (bonding) of the liquid Temperature External timescale controlled by the cooling rate of the liquid 11


12 Microscopic time: time for events at sub-atomic distance and duration 12

13 13
14

15 * Glass: Solid? or liquid? 15
16 Variation of viscosity with temperature for crystal and glass formation
17 Glass : undercooled liquid with high viscosity The higher the structural relaxation, the closer it moves toward a true glass. A solid is a materials whose viscosity exceeds centipoise (10 12 Pa s) cf) liquid ~10-2 poise 17
18 * Glass transition On cooling, although the driving force for nucleation is continually increasing, this is opposed by the rapidly decreasing atomic mobility which, at very high undercoolings, dominates. Eventually, homogeneously frozen at T g. * Glass transition : region over which change of slope occurs T g = fictive temperature, T f T f = T g thermodynamic property? thermodynamic property 18


19 DSC trace of Vitreloy 1 : the temperature regions sectioned according to phase transformations ΔT x : indication of thermal stability of the glass produced
20 Thermal analysis: DSC A calorimeter measures the heat into or out of a sample. A differential calorimeter measures the heat of a sample relative to a reference. A differential scanning calorimeter does all of the above and heats the sample with a linear temperature ramp. Differential Scanning Calorimetry (DSC) measures the temperatures and heat flows associated with transitions in materials as a function of time and temperature in a controlled atmosphere. 20
21 Schematic of DSC Instrument Low mass > 1 gram Sample Reference T 1 T 2 Pt thermopile heater Pt thermopile heater Inert gas flow W 21
22 Variation of T g depending on alloy compositions Broken Bonds Exothermic (0.5 w/g per div.) (a) Ni 61 Zr 22 Nb 7 Al 4 Ta 6 (b) Cu 46 Zr 42 Al 7 Y 5 (c) Zr 36 Ti 24 Be 40 (d) Mg 65 Cu 15 Ag 10 Gd 10 (d) (c) (b) (a) Temperature (K) 22
23 Glass transition Temperature (T g ) W based MG Fe based BMG Ni based BMG Ti based BMG Cu based BMG Zr based BMG Al based MG Mg based BMG Ca based BMG Fracture Strength (GPa) Elastic modulus (GPa)


24 Pd 42.5 Ni 7.5 Cu 30 P D max 80mm Intermetallics, Vol30, Nov2012, P 19 24
25 * Free volume = specific vol. of glass specific vol. of the corresponding crystal normal glass~ 2 3% difference / bulk metallic glass ~ % difference Shrinkage in solidification at T m can amount to 5 10 % by volume. V l Specific volume V g Glass V F V F V c Crystalline T g Temperature At the glass transition temperature, T g, the free volume increases leading to atomic mobility and liquid like behavior. Below the glass transition temperature, atoms (ions) are not mobile and the material behaves like solid T m 25


26 * Micro/Nano casting Liquid Molar Volume, V Glass Glass formation: continuous change Crystal Crystallization: abrupt change Near-net shape production T g Temperature, T T melting Vacuum Chamber Die Precision Gears for Micro-motors Cavity Die Molten Alloy Induction Coil sleeve Plunger Precision die casting MRS BULLETIN 32 (2007)654.
27 The Cooling Rate Affects the Properties of Glass Faster cooling freezes in the glass at a higher temperature The temperature is lowered so fast that the liquid does not have time to relax to the properties at the next lower temperature, glass is formed at a high temperature Slower cooling freezes in the glass at a lower temperature The temperature is lowered slowly enough that the liquids can relax to properties at lower and lower temperatures, glass is eventually formed at a lower temperature Molar Volume glassy state Fast cooling medium slow supercooled liquid liquid Temperature 27
28 Typically T g is ~ 50 60% of the melting point. (0.6T m ) * J Mater Res, 19 (2004) 685.
29 * T g depends on thermal history even in same alloy composition. Specific Volume [cm 3 /mol] Specific Volume [cm 3 /mol] As-melt-spun ribbon T g,v = 379 K T g,v = 374 K 15 mm bulk ingot Vgb(T) = (T-293) Temperature [K] Vgr(T) = (T-293) T ΔV=0 T g,v Kauzman (isentropic) temp. = 286 K ΔT g /T g = 1.32 % Organic glass polyvinylacetate (8K, <3%) Temperature [K] Vl(T) = (T-293) Vc(T) = (T-293) T m ΔV at T m = 1.29 % Smaller than most crystalline (3-6%) * APL, 92 (2008)
 relax and eventually transform to crystalline ground state")
30 * Kinetic Nature of the Glass Transition Ideal glass * Glass exited state (suf icient time) relax and eventually transform to crystalline ground state 30

31 2.5 Thermodynamics and Kinetics of Glass Formation Phase Transition Thermodynamically: what is possible! Kinetics: speed/rate of the transition Thermodynamical classification: first order & second order 31

32 Order (degree) of transition Continuous phase transitions: occur when the minimum in the thermodynamic potential evolves smoothly into two equal minima. An example is seen in the model of phase separation, along the co-existence line. E P C D 32

33 Order (degree) of transition E P C D CD, DE, DP: Equilibrium of 2 phases latent heat Volume change 1st order transition T and P beyond point p : vapor and liquid are indistinguishable. Single phase: only property changes. No boiling pt. / no latent heat Higher order transition 33
34 34

35 35

36 36

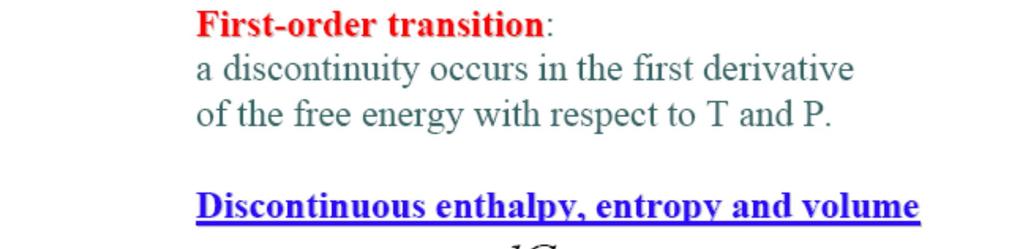
37 The First-Order Transitions Latent heat Energy barrier Discontinuous entropy, heat capacity G S T S = L/T C P S T T P, N T C P T 37


38 The Second Order Transition No Latent heat Continuous entropy Second-order transition G S T S=0 C P S T T P, N T C P T


39 ~ Brass is a 50:50, Cu:Zn alloy with a b.c.c structure. ~ At low temperatures, T<460K, the Zn and Cu atoms for an ordered structure (eg. Cu atoms in the body-centre sites in top diagram) 39
40 Intermediate Phase < 0, H mix < 0 / H mix ~ -21 kj/mol β Order-disorder transformation: Low temp. ordered structure High temp. disordered structure β (fcc) (hcp) 40
41 Ordered Alloys 0 H H 0 L mix S mix a. ΔH mix < 0 A atoms and B atoms like each other. How does the phase diagram differ from the previous case? b. What would happen when ΔH mix << 0? The ordered state can extend to the melting temperature. congruent maxima 41

42 Order-disorder phase transformation - Not classical phase change=~not depend on diffusion process - change of temperature allowed a continuous re-arrangement of atoms without changing the phase - boundary: ordered lattice & disordered lattice/phase rule could not applied there are cases in which an ordered phase of one composition exists in equilibrium with a disordered phase of a different composition. - Simple composition of the type AB or AB 3 can the transformation (i.e. at the temperature maximum) be considered diffusionless. 42
43 * Solid solution random mixing entropy negative enthalpy H S mix 0 Large composition range G * Compound : AB, A 2 B entropy covalent, ionic contribution. enthalpy more negative H S mix 0 Small composition range G 43

44 액정의가는분자가서로의위치는불규칙하지만모두일정방향으로향하고있는상태 44
45 Thermodynamics for glass transition ~ not thermodynamic nature ~ close to second order phase transition at T g G changes continuously. V, H. S changes continuously. α T C P K T changes discontinuously. The glass transition is pseudo second order phase transition. And the transition depends on kinetic factors. 45
46 (V, S, H) continuous (α T C P K T ) discontinuous Schematic of the glass transition showing the effects of temperature on the entropy, viscosity, specific heat, and free energy. T x is the crystallization onset temperature. 46
47 Schematic of the glass transition showing the effects of temperature on free energy 47
48 1) multi component system: ΔS _high order alloy easy 2) low chemical potential due to 1 low enthalpy 2 large interfacial E between liquid and solid phase : ΔH f _constituents with large negative heat of mixing solid/liquid interface E
49
50 derivative of thermodynamic properties discontinuous (C p, α T, K T ) ~ dramatically decrease C p near T g during cooling ~ dramatically increase C p near T g during heating Experimental observation during heating because the monitoring is very difficult during cooling Glass transition: heat endothermic 50


51 Pd 42.5 Ni 7.5 Cu 30 P ~73mm D max 80mm Intermetallics, Vol30, Nov2012, P ESPark Research Group
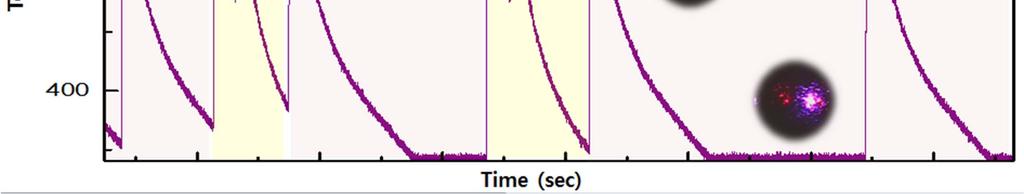
52 BMG formation of Pd 42.5 Ni 7.5 Cu 30 P 20 Alloy under Radiative Cooling mm ball sample Temperature(K) T l Intensity No Recalescence Phenomena during cooling! 600 T g Time(sec.)
53 V T Diagram of Pd 42.5 Ni 7.5 Cu 30 P V l Specific volum(g/cm 3 ) ΔV at T g = 0.36 % T g T s T l ΔV at T m = 1.35 % Temperature(K) ESPark Research Group
54 V T Diagram & C p /ε T Diagram of Pd 42.5 Ni 7.5 Cu 30 P Pd 42.5 Ni 7.5 Cu 30 P Specific volume(cm 3 /g) T g T l No crystallization behavior during cooling! Cp/ε (J/mol K) Temperature(K)