Chapter 2: Mechanical Behavior of Materials
|
|
|
- Mark Briggs
- 5 years ago
- Views:
Transcription
1 Chapter : Mechanical Behavior of Materials Definition Mechanical behavior of a material relationship - its response (deformation) to an applied load or force Examples: strength, hardness, ductility, stiffness Why we need these? All manufacturing processes involve deformation of material understood based on the mechanical properties
2 Strains Definition Ratio of change in shape (say length) to original shape (or length) (unitless) Tension Compression Shear l Engineering (Nominal) Strain (Uniaxial loading) e Positive in tension Negative in compression Shear Strain (Shear loading) a b l l o o


3 Tensile Test Zone I Stress proportional to Strain Linear relationship No permanent deformation Zone II Relationship between stress and strain is not linear Gage area decreases uniformly Permanent deformation Plastic deformation Zone III Non-uniform decrease in area Start of Necking Permanent deformation Plastic deformation
4 Tension Tension test specimen prepared according to ASTM standards l o = original gage length A o = original cross-sectional area Engineering (nominal) Stress P A o Proportional limit; Hooke s law; Young s modulus E e Plastic Deformation Ultimate Tensile Strength (UTS) Necking Yield Point Modulus of Resilience Y E Poisson s Ratio = ratio of lateral to longitudinal strain 0.% Offset Method = to define the location of Y
5 Ductility Ability of material to deform plastically before fracture How large a strain the material withstands before fracture Elongation (0~60%) Gage length must be specified l f lo Elongation 00 lo Reduction in Area (0~90%) Reduction in Area A o A o A f 00
6 True Stress and True Strain True Stress Where True Strain P is the instantaneous load applied perpendicular to the specimen cross-section A is the instantaneous area of the specimen Units: Pa (N/m ) or psi (pound per square inch) l dl l ln lo l Where lo l o is the original length l is the instantaneous length l Volume constancy ln ln lo True strain is used in metalworking due to large strains P A Ao A Do ln D ln Do D
7 True stress-true strain Curve Strain Hardening Relation n K n: strain hardening exponent K: strength coefficient K is true stress for unity true strain Y f : Flow stress True stress required to continue plastic deformation at a constant true strain Toughness Toughness f d 0 Energy per unit volume dissipated up to the fracture; area under the true stress-true strain curve
8 Instability Onset of necking Slope of load-elongation curve at UTS is zero dp = 0 n Example. A material has a true stress-true strain curve given by: kpa Calculate the true UTS and the engineering UTS of this material. 0.5
9 Types of Stress-Strain Curves Perfectly Elastic Material fractures under elastic stress No plastic Deformation Rigid, Perfectly Plastic Infinite value of E; No elastic recovery Elastic, Perfectly Plastic Combination of the first two Finite value of E and elastic recovery Rigid, Linearly Strain Hardening Flow stress increases with increasing strain No elastic recovery Elastic, Linearly Strain Hardening Acceptable approximation of the behavior of most engineering materials
10 Effect of Temperature Carbon Steel
11 Strain Rate Engineering Strain Rate e de dt d ll l o dt o l o dl dt v l o e v True Strain Rate d l d ln l dt dt v: rate of deformation o l dl dt v l not proportional v
12 Effect of Strain Rate Sensitivity of strength to strain rate increases with temperature C m: strain rate sensitivity exponent ~0.05 cold working 0.05~0.4 hot working C: strength coefficient m
13 Effect of m Strain hardening Increase in resistance to necking Necking is delayed with increasing m
 No effect on the strain or load at onset of necking Mechanical properties not")
14 Effect of Hydrostatic Pressure Strain at fracture increases No effect on the shape of true stress-true strain curve (extends it) No effect on the strain or load at onset of necking Mechanical properties not changed
15 Effect of Radiation Exposure to radiation Higher yield stress Higher tensile stress Higher hardness Lower ductility and toughness


16 Compression Forging, rolling, extrusion under compressive loads Barreling Cause: friction between the specimen faces and dies Difficult to make perform compression tests Cross-sectional area changes along the length Friction dissipates energy increase in compressive force Solution Use lubrication
17 Compression Engineering Strain Rate True Strain Rate e v h v h o v: speed of the die h o : original height of the specimen h: instantaneous height of the specimen Cam Plastometer To perform tests at a constant true strain rate
18 Tension vs Compression True stress- True strain Curve Same for ductile Different for brittle
19 Bauschinger Effect Initial tensile yield stress Y Deform in tension into plastic range Reverse the load Yield stress in compression will be lower than original Y Same if first compression is applied Also known as Strain Softening or Work Softening -Y

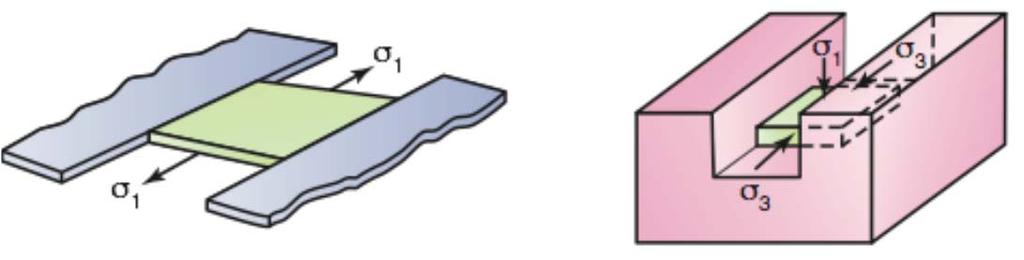
20 Plane-Strain Compression Test Definition Strain in a plane (no strain in the rd dimension) Width of the specimen does not undergo any significant change The yield stress in plane strain: Y Y
21 Disk Test For brittle materials Disk is subjected to diametral compression Tensile stresses develop perpendicular to the vertical centerline Disks fractures and splits vertically in half P dt : uniform stress along the centerline d : diameter of the disk t : thickness of the disk

![Deformation) Flow Rules (Plastic Deformation) )] ( [ )] ( [](/docs-images/88/117455442/images/22-1.jpg ")] ( [ E E E )] ( [ )] ( [ )] ( [ d d d d d d E E, 0 For")
22 Triaxial Stress Stress in D Thin-walled spherical shell expansion Wire drawing Deep drawing Hooke s Law (Elastic Deformation) Flow Rules (Plastic Deformation) )] ( [ )] ( [ )] ( [ E E E )] ( [ )] ( [ )] ( [ d d d d d d E E, 0 For Simple Tension

23 States of Stress Plane Stress When one or two of the pairs of faces on an element have zero stress 0 Plane Strain When one or two of the pairs of faces on an element have zero strain 0
24 Yield Criteria When a material deform plastically under triaxial stress? Maximum-Shear-Stress Criterion (Tresca) Maximum shear stress within an element becomes equal or exceeds Shear Yield Stress k (a critical value) k max Using principal stresses and Mohr s circle: max min Y the intermediate principal stress has no effect on yielding Assumptions: Materials is continuous, homogeneous and isotropic Yield stress is same in tension or compression Relation between Tensile and Shear Yield Stress For simple tension: Y k
25 Yield Criteria Distortion-Energy Criterion (von Mises) Intermediate principal stress is taken into consideration Y Example.5 A thin-walled spherical shell is under internal pressure, p. The shell is 50.8 cm in diameter and 0.54 cm thick. It is made of a perfectly plastic material with a yield stress of 8 MPa. Calculate the pressure required to cause yielding of the shell according to both yield criteria.
26 Plane Stress ( = 0) Yield Criteria Tresca max min Y st & rd Quadrant: is the lowest Y or Y nd & 4 th Quadrant: is the intermediate Y von Mises Y
27 Plane Strain ( = 0) Yield Criteria Tresca is always the intermediate max min Y k Y von Mises Y Y k Y
28 Experimental Verification of Yield Criteria Ductile material go with von Mises criterion Tresca may be used for simplicity
29 Volume Strain Definition Volume Change Original Volume Using Hooke s law For plastic deformation Bulk Modulus ( E Bulk Modulus Mean Stress m m 0 ) E ( ) ( )
30 Effective Stress & Effective Strain Maximum Shear Stress Criterion (Tresca) Distortion Energy Criterion (Mises) The factors are chosen so that each effective value reduces to its value in simple tension ( ) ] ) ( ) ( ) [( ] ) ( ) ( ) [(
31 Comparison Normal & Shear Stress Tension: Torsion: principal, 0 always Tresca: von Mises: Strain Tension: Torsion:, 0 Tresca: von Mises: 4
 = area under the curve For Uniaxial Deformation u 0 d n K n K u Y n Y average flow")
32 Work of Deformation Work per unit volume = product of stress and strain Energy per unit volume, u (Specific Energy) = area under the curve For Uniaxial Deformation u 0 d n K n K u Y n Y average flow stress
33 Work of Deformation For Triaxial Stress du d d d Generally u ideal d 0 This is ideal energy or minimum energy Ideal Work Work = (u)(volume)

34 Work of Deformation Friction Work u friction to overcome at the die-work interfaces Redundant Work u redundant due to heterogeneous (non-homogeneous) deformation Total Work u total u ideal u friction u redundant Efficiency u u ideal total Depends on particular process, frictional conditions, die geometry 0~60% Extrusion 75~95% Rolling
35 Work, Heat, & Temperature Rise Work of deformation during plastic deformation is converted into heat A small portion (5~0%) of total energy input is stored as elastic energy Temperature rise, T assuming all work is converted into heat T u c total = density c = specific heat of the material
36 Examples Problem.48 A material has the following properties: UTS = 45 MPa and n = 0.5 Calculate the strength coefficient K. Problem.5 A cable is made of four parallel strands of different materials, all behaving according to the equation σ = K n, where n = 0. The materials, strength coefficients, and cross sections are as follows: Material A: K = 450 MPa, A o = 7 mm ; Material B: K = 600 MPa, A o =.5 mm ; Material C: K = 00 MPa, A o = mm ; Material D: K = 760 MPa, A o = mm ; (a) Calculate the maximum tensile load that this cable can withstand prior to necking. (b) Explain how you would arrive at an answer if the n values of the three strands were different from each other.
 What is the yield stress using the Tresca criterion? (c) What if the von Mises criterion is used? (d) The stress state causes measured strains of = 0.4 and = 0., with not being measured.")
37 Examples Problem.97 A metal is yielding plastically under the stress state shown in the accompanying figure. (a) Label the principal axes according to their proper numerical convention (,, ). (b) What is the yield stress using the Tresca criterion? (c) What if the von Mises criterion is used? (d) The stress state causes measured strains of = 0.4 and = 0., with not being measured. What is the value of?